Abstract
Coastal areas gather increasing hazards, exposures, and vulnerabilities in the context of anthropogenic changes. Understanding their spatial responses to acute and chronic drivers requires ultra-high spatial resolution that can only be achieved by UAV-based sensors. UAV lasergrammetry constitutes, to date, the best observation of the xyz variables in terms of resolution, precision, and accuracy, allowing coastal areas to be reliably mapped. However, the use of lidar reflectivity (or intensity) remains poorly examined for mapping purposes. The added value of the lidar-derived near-infrared (NIR) was estimated by comparing the classification results of nine coastal habitats based on the blue–green–red (BGR) passive and BGR-NIR passive–active datasets. A gain of 4.14% was found at the landscape level, while habitat-scaled improvements were highlighted for the “salt marsh” and “soil” habitats (4 and 4.56% for producer’s accuracy, PA, and user’s accuracy, UA; and 8.95 and 9.48% for PA and UA, respectively).
1. Introduction
Coastal areas play a key role in the adaptation of ocean-climate change due to their land–sea interface [1]. The mapping and monitoring of their use and cover are crucial to understanding where the most exposed and vulnerable zones are located and how to manage them in a sustainable way [2]. The finest spatial resolution possible is required to empower the diagnosis and prognosis of coastal objects subject to current and future erosion and/or submersion risks. To date, unmanned aerial vehicles (UAVs) consist of the best platforms to bear sensors capable of providing centimeter-scale 2D and 3D coastal information [3]. The active lidar instrument scans coastal landscapes at a rate of hundreds of thousands of points per second, propagating at the speed of light [4]. UAV-based lidar products enable the best accuracy and precision in xyz data among the airborne/spaceborne tools. However, lidar intensity remains poorly harnessed in Earth observation from satellite to drone, despite its obvious added value in terms of spectral information [5].
This study aims to assess the contribution of the UAV-based lidar-derived near-infrared (NIR) intensity to the overall accuracy (OA) and kappa coefficient (κ) of the classification of a coastal landscape, provided with nine representative natural, semi-natural, and anthropogenic habitats. The lidar NIR contribution is quantified in the light of blue–green–red (BGR) passive imagery, whose camera is co-located with the lidar sensor.
2. Methodology
2.1. Study Site
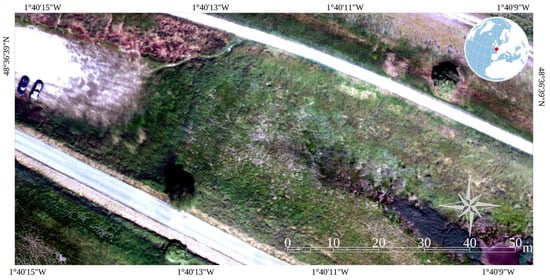
The study site is located along the bay of Mont Saint-Michel, midway between the most extended salt marshes in northern France and rural polders (Figure 1).

Figure 1.
Blue–green–red composite imagery of the study site and its global location (11,385 × 5538 pixels; 0.01 m pixel size; 23,626,927 points).
This site was selected based on the diversity of the habitats, namely salt marsh, grass, dry grass, shrub, tree, soil, sediment, road, and car (Table 1). Every class was represented by 4600 pixels, which were split into 2300 calibration and 2300 validation pixels. Both sub-datasets were spatially disjointed to avoid spatial autocorrelation. A total of 41,400 pixels were therefore used for, first, training the probabilistic maximum likelihood learner, then for testing its predictability.

Table 1.
Habitat name, description, and blue–green–red derived thumbnails.
2.2. Drone Lidar Flight
The lidar drone mission was realized on 5 June 2023 using a Zenmuse L1 sensor (DJI, Shenzhen, China) mounted on a DJI Matrice 300 RTK quadcopter (DJI, Shenzhen, China) linked with a DJI D-RTK2 high precision Global Navigation Satellite System (GNSS) station base. The flight mission followed these navigational parameters: 50 m height, 4 m/s speed, 12 min time, 2.04 km path length, 0.30 km2, 233 BGR pictures, and 0.013 m ground sample distance.
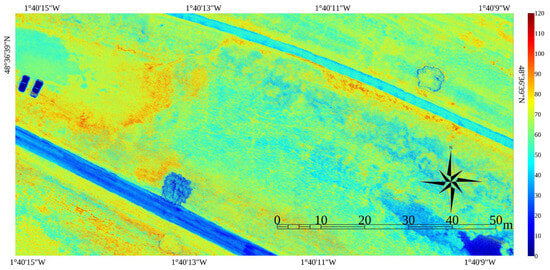
The Zenmuse L1 sensor is designed to have a 905 nm Livox Avia laser, a 200 Hz inertial measurement unit, and a 1-inch RGB camera (20 Mp), all mounted on a 3-axis gimbal provided with a DJI Skyport (DJI, Shenzhen, China), enabling the synchronization of the lidar RTK positioning with the Matrice 300 RTK system. The point sampling rate was fixed at 240 kHz in the dual return mode, and the line scanning pattern was selected (repetitive field-of-view: 70.4° horizontal × 4.5° vertical). The lidar mission followed these specific parameters: 80% front overlapping, 70% side overlapping, and an average density point of 2 477 points/m2. The DJI native (but proprietary) lidar format was implemented into DJI Terra (DJI, Shenzhen, China) to obtain the las format in the local datum RGF93, projected in Lambert 93, along the IGN69 altimetry. The mean NIR intensity was rasterized at 0.01 m from the resulting point cloud (Figure 2).

Figure 2.
Infrared lidar-derived near-infrared imagery of the study site (11,385 × 5538 pixels; 0.01 m pixel size; 23,626,927 points).
3. Results and Discussion
3.1. Landscape Scale
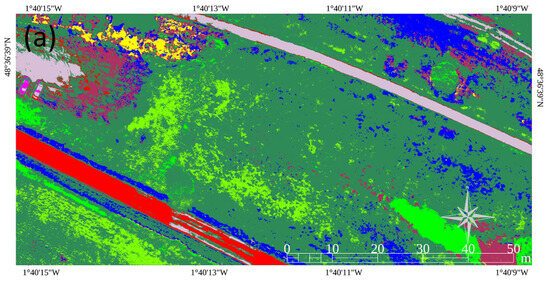
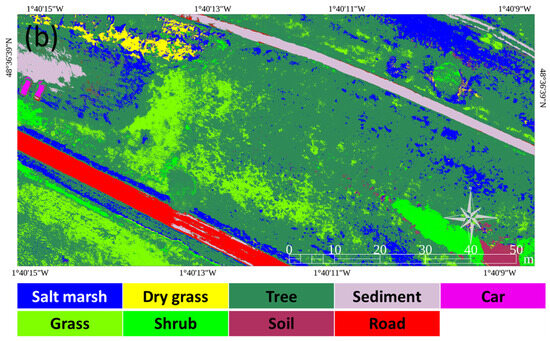
The OA and κ were derived from the confusion matrices established from the validation datasets of the BGR (Table 2) and BGR-NIR (Table 3) classifications. OA and κ reached 84.57% and 0.8264 for the BGR and 88.71% and 0.8730 for the BGR-NIR datasets, respectively (Figure 3).

Table 2.
Confusion matrix derived from the blue–green–red classification.

Table 3.
Confusion matrix derived from the blue–green–red + lidar-derived near-infrared classification.


Figure 3.
Classification of the nine classes in the coastal landscape based on (a) blue–green–red imagery and (b) lidar-derived near-infrared + blue–green–red imageries (11,385 × 5538 pixels, 0.01 m pixel size).
3.2. Habitat Scale
Regarding the producer’s accuracy (PA), the habitats that most benefited from the NIR addition were “road”, “grass”, and “soil”, whereas “tree” lost a little detection.
About the user’s accuracy (UA), “soil”, “tree”, and “salt marsh” gained in discrimination, whereas “road” and “grass” were less classified (Table 4).

Table 4.
Results of the producer’s accuracy and user’s accuracy differences between BGR and BGR-NIR classifications.
The consistent augmentation for “salt marsh” and “soil” might be explained by the higher and lower reflectance in the NIR spectrum, respectively. High salt marsh vegetation, such as Puccinellia, Festuca, Aster, Limione, or Elymus genera, displays a tangible higher NIR reflectance in the summer season [6], while the “soil” investigated here corresponded to the transitional wet-to-dry area just above a pond, thus the lower NIR reflectance due to the moisture.
4. Conclusions
The contribution of the UAV-borne lidar-derived NIR intensity to the classification of a coastal landscape (provided with nine representative habitats) was evaluated by comparing OA, PA, and UA results associated with a passive BGR dataset and a combination of a passive–active BGR-NIR dataset using a probabilistic maximum likelihood classifier. At the landscape level, the addition of the lidar NIR intensity to the BGR reference increased OA by 4.14%. At the habitat level, “salt marsh” and “soil” gained 4 and 8.95% in PA, respectively, and 4.56 and 9.48% in UA, respectively. It is therefore recommended to add the lidar-derived intensity into classification when front and side overlaps at least reach 80 and 70%, respectively.
Author Contributions
Conceptualization, A.C., D.J., R.G., E.P. and E.F.; methodology, A.C., D.J., R.G., E.P. and E.F.; software, A.C., D.J., R.G., E.P. and E.F.; validation, A.C., D.J., R.G., E.P. and E.F.; formal analysis, A.C., D.J., R.G., E.P. and E.F.; investigation, A.C., D.J., R.G., E.P. and E.F.; resources, A.C., D.J., R.G., E.P. and E.F.; data curation, A.C., D.J., R.G., E.P. and E.F.; writing—original draft preparation, A.C., D.J., R.G., E.P. and E.F.; writing—review and editing, A.C., D.J., R.G., E.P. and E.F.; visualization, A.C., D.J., R.G., E.P. and E.F.; supervision, A.C., D.J., R.G., E.P. and E.F.; project administration, A.C., D.J., R.G., E.P. and E.F.; funding acquisition, A.C., D.J., R.G., E.P. and E.F. All authors have read and agreed to the published version of the manuscript.
Funding
This research received no external funding.
Institutional Review Board Statement
Not applicable.
Informed Consent Statement
Not applicable.
Data Availability Statement
The datasets presented in this article are not readily available because the data are part of an ongoing study. Requests to access the datasets should be directed to DJ.
Acknowledgments
The authors are grateful to the French Office for Biodiversity for authorizing the UAV flights over natural and semi-natural habitats.
Conflicts of Interest
The authors declare no conflict of interest. The funders had no role in the design of the study, in the collection, analysis, or interpretation of data, in the writing of the manuscript, or in the decision to publish the results.
References
- Toimil, A.; Losada, I.J.; Nicholls, R.J.; Dalrymple, R.A.; Stive, M.J. Addressing the challenges of climate change risks and adaptation in coastal areas: A review. Coast. Eng. 2020, 156, 103611. [Google Scholar] [CrossRef]
- Bukvic, A.; Rohat, G.; Apotsos, A.; de Sherbinin, A. A systematic review of coastal vulnerability mapping. Sustainability 2020, 12, 2822. [Google Scholar] [CrossRef]
- Collin, A.; James, D.; Mury, A.; Letard, M.; Houet, T.; Gloria, H.; Feunteun, E. Multiscale Spatiotemporal NDVI Mapping of Salt Marshes Using Sentinel-2, Dove, and UAV Imagery in the Bay of Mont-Saint-Michel, France. In European Spatial Data for Coastal and Marine Remote Sensing; Springer International Publishing: Cham, Switzerland; New York, NY, USA, 2022; pp. 17–38. [Google Scholar]
- Collin, A.; Pastol, Y.; Letard, M.; Le Goff, L.; Guillaudeau, J.; James, D.; Feunteun, E. Increasing the Nature-Based Coastal Protection Using Bathymetric Lidar, Terrain Classification, Network Modelling: Reefs of Saint-Malo’s Lagoon? In European Spatial Data for Coastal and Marine Remote Sensing; Springer International Publishing: Cham, Switzerland; New York, NY, USA, 2022; pp. 235–241. [Google Scholar]
- Collin, A.; Ramambason, C.; Pastol, Y.; Casella, E.; Rovere, A.; Thiault, L.; Davies, N. Very high resolution mapping of coral reef state using airborne bathymetric LiDAR surface-intensity and drone imagery. Int. J. Remote Sens. 2018, 39, 5676–5688. [Google Scholar] [CrossRef]
- Mury, A.; Collin, A.; Etienne, S.; Jeanson, M. Wave attenuation service by intertidal coastal ecogeosystems in the Bay of Mont-Saint-Michel, France: Review and meta-analysis. In Estuaries and Coastal Zones in Times of Global Change; Springer Water, Springer: Singapore, 2020; pp. 555–572. [Google Scholar]
Disclaimer/Publisher’s Note: The statements, opinions and data contained in all publications are solely those of the individual author(s) and contributor(s) and not of MDPI and/or the editor(s). MDPI and/or the editor(s) disclaim responsibility for any injury to people or property resulting from any ideas, methods, instructions or products referred to in the content. |
© 2023 by the authors. Licensee MDPI, Basel, Switzerland. This article is an open access article distributed under the terms and conditions of the Creative Commons Attribution (CC BY) license (https://creativecommons.org/licenses/by/4.0/).


