Proceeding Paper

Change in Aridity Index in the Mediterranean Region under Different Emission Scenarios †

1
Research Centre for Atmospheric Physics and Climatology, Academy of Athens, 11521 Athens, Greece
2
Laboratory of Climatology and Atmospheric Environment, National and Kapodistrian University of Athens, 15784 Athens, Greece
3
Navarino Environmental Observatory (N.E.O.), 24001 Messinia, Greece
4
Mariolopoulos-Kanaginis Foundation for the Environmental Sciences, 10675 Athens, Greece
5
Biomedical Research Foundation, Academy of Athens, 11527 Athens, Greece
*
Author to whom correspondence should be addressed.
Presented at the 16th International Conference on Meteorology, Climatology and Atmospheric Physics—COMECAP 2023, Athens, Greece, 25–29 September 2023.
Environ. Sci. Proc. 2023, 26(1), 171; https://doi.org/10.3390/environsciproc2023026171
Published: 5 September 2023

Abstract

:
In the present study, the spatial and temporal variability of the Aridity Index (AI) in the Mediterranean region during the 30-year period 1971–2000 is analyzed. The analysis is performed on a decadal timescale. Subsequently, the projected change in the AI in the periods 2031–2060 (near future) and 2071–2100 (far future) under the RCP4.5 and RCP8.5 emission scenarios in comparison with 1971–2000 (reference period) is presented. The input of the calculations are simulation results supplied by the CORDEX EU project. In total, an ensemble of 20 combinations of global climate models (GCMs) and regional climate models (RCMs) are used. The calculation of the AI is based on potential evapotranspiration, which, in turn, is calculated according to the classic method of Thornthwaite. Our results show that drier conditions are to be expected in the future along a wide zone in southern Europe, including Spain, Italy, Bulgaria, Greece and Turkey, as well as in Northern Africa, particularly under the RCP8.5 scenario and towards the end of the century.

1. Introduction

The Mediterranean region is considered a climate change hotspot due to the adverse conditions expected to occur there, including enhanced aridity [1]. The combination of increased temperature and decreased precipitation height is expected to put stress on water resources, especially during the summer [2]. This paper examines the change in aridity in the region until the end of the 21st century, focusing on its structure on the latitudinal and on the vertical dimensions.

2. Materials and Methods

The Aridity Index (AI) is a metric for the examination of the surplus or deficit of humidity in a location, which has been used by numerous researchers (e.g., [3]). The AI is defined as the ratio of precipitation height, P, in that location to the potential evapotranspiration, PET, i.e., to the amount of water that could evaporate should it be available [4]. Many formulas have been proposed for the calculation of PET. Here, the classic method of Thornthwaite [5] is used.
The input data for the present paper are results of EUR-11 simulation results obtained via EURO-CORDEX. In total, an ensemble of 20 combinations of global and regional climate models were used to simulate the climate of Europe for the years 1971–2100 under the scenarios RCM4.5 and RCM8.5. The resolution of all 20 RCMs is 0.11° × 0.11° lat, or about 12.5 km × 12.5 km, and their domain and orography are practically identical, allowing for easy comparison.
The monthly averages of surface temperature and precipitation height were used to calculate the AI on a decadal timescale as well as for three 30-year periods: reference period 35 (REF, 1971–2000), near future (NF, 2031–2060) and far future (FF, 2071–2100).

3. Results

Figure 1 broadly presents the orography of the study area for one of the RCMs used; the other RCMs (not shown) have only minor differences. Only two contour levels have been used, namely 500 m and 1500 m, because they will be used below. The horizontal lines denote the division of the area in seven latitudinal zones ranging from 30° N to 47.5° N with 2.5° of width each. A buffer zone with a width of 10 grid points from the edge of the RCM domains that is excluded from the analysis is represented by a line visible in the bottom right corner.
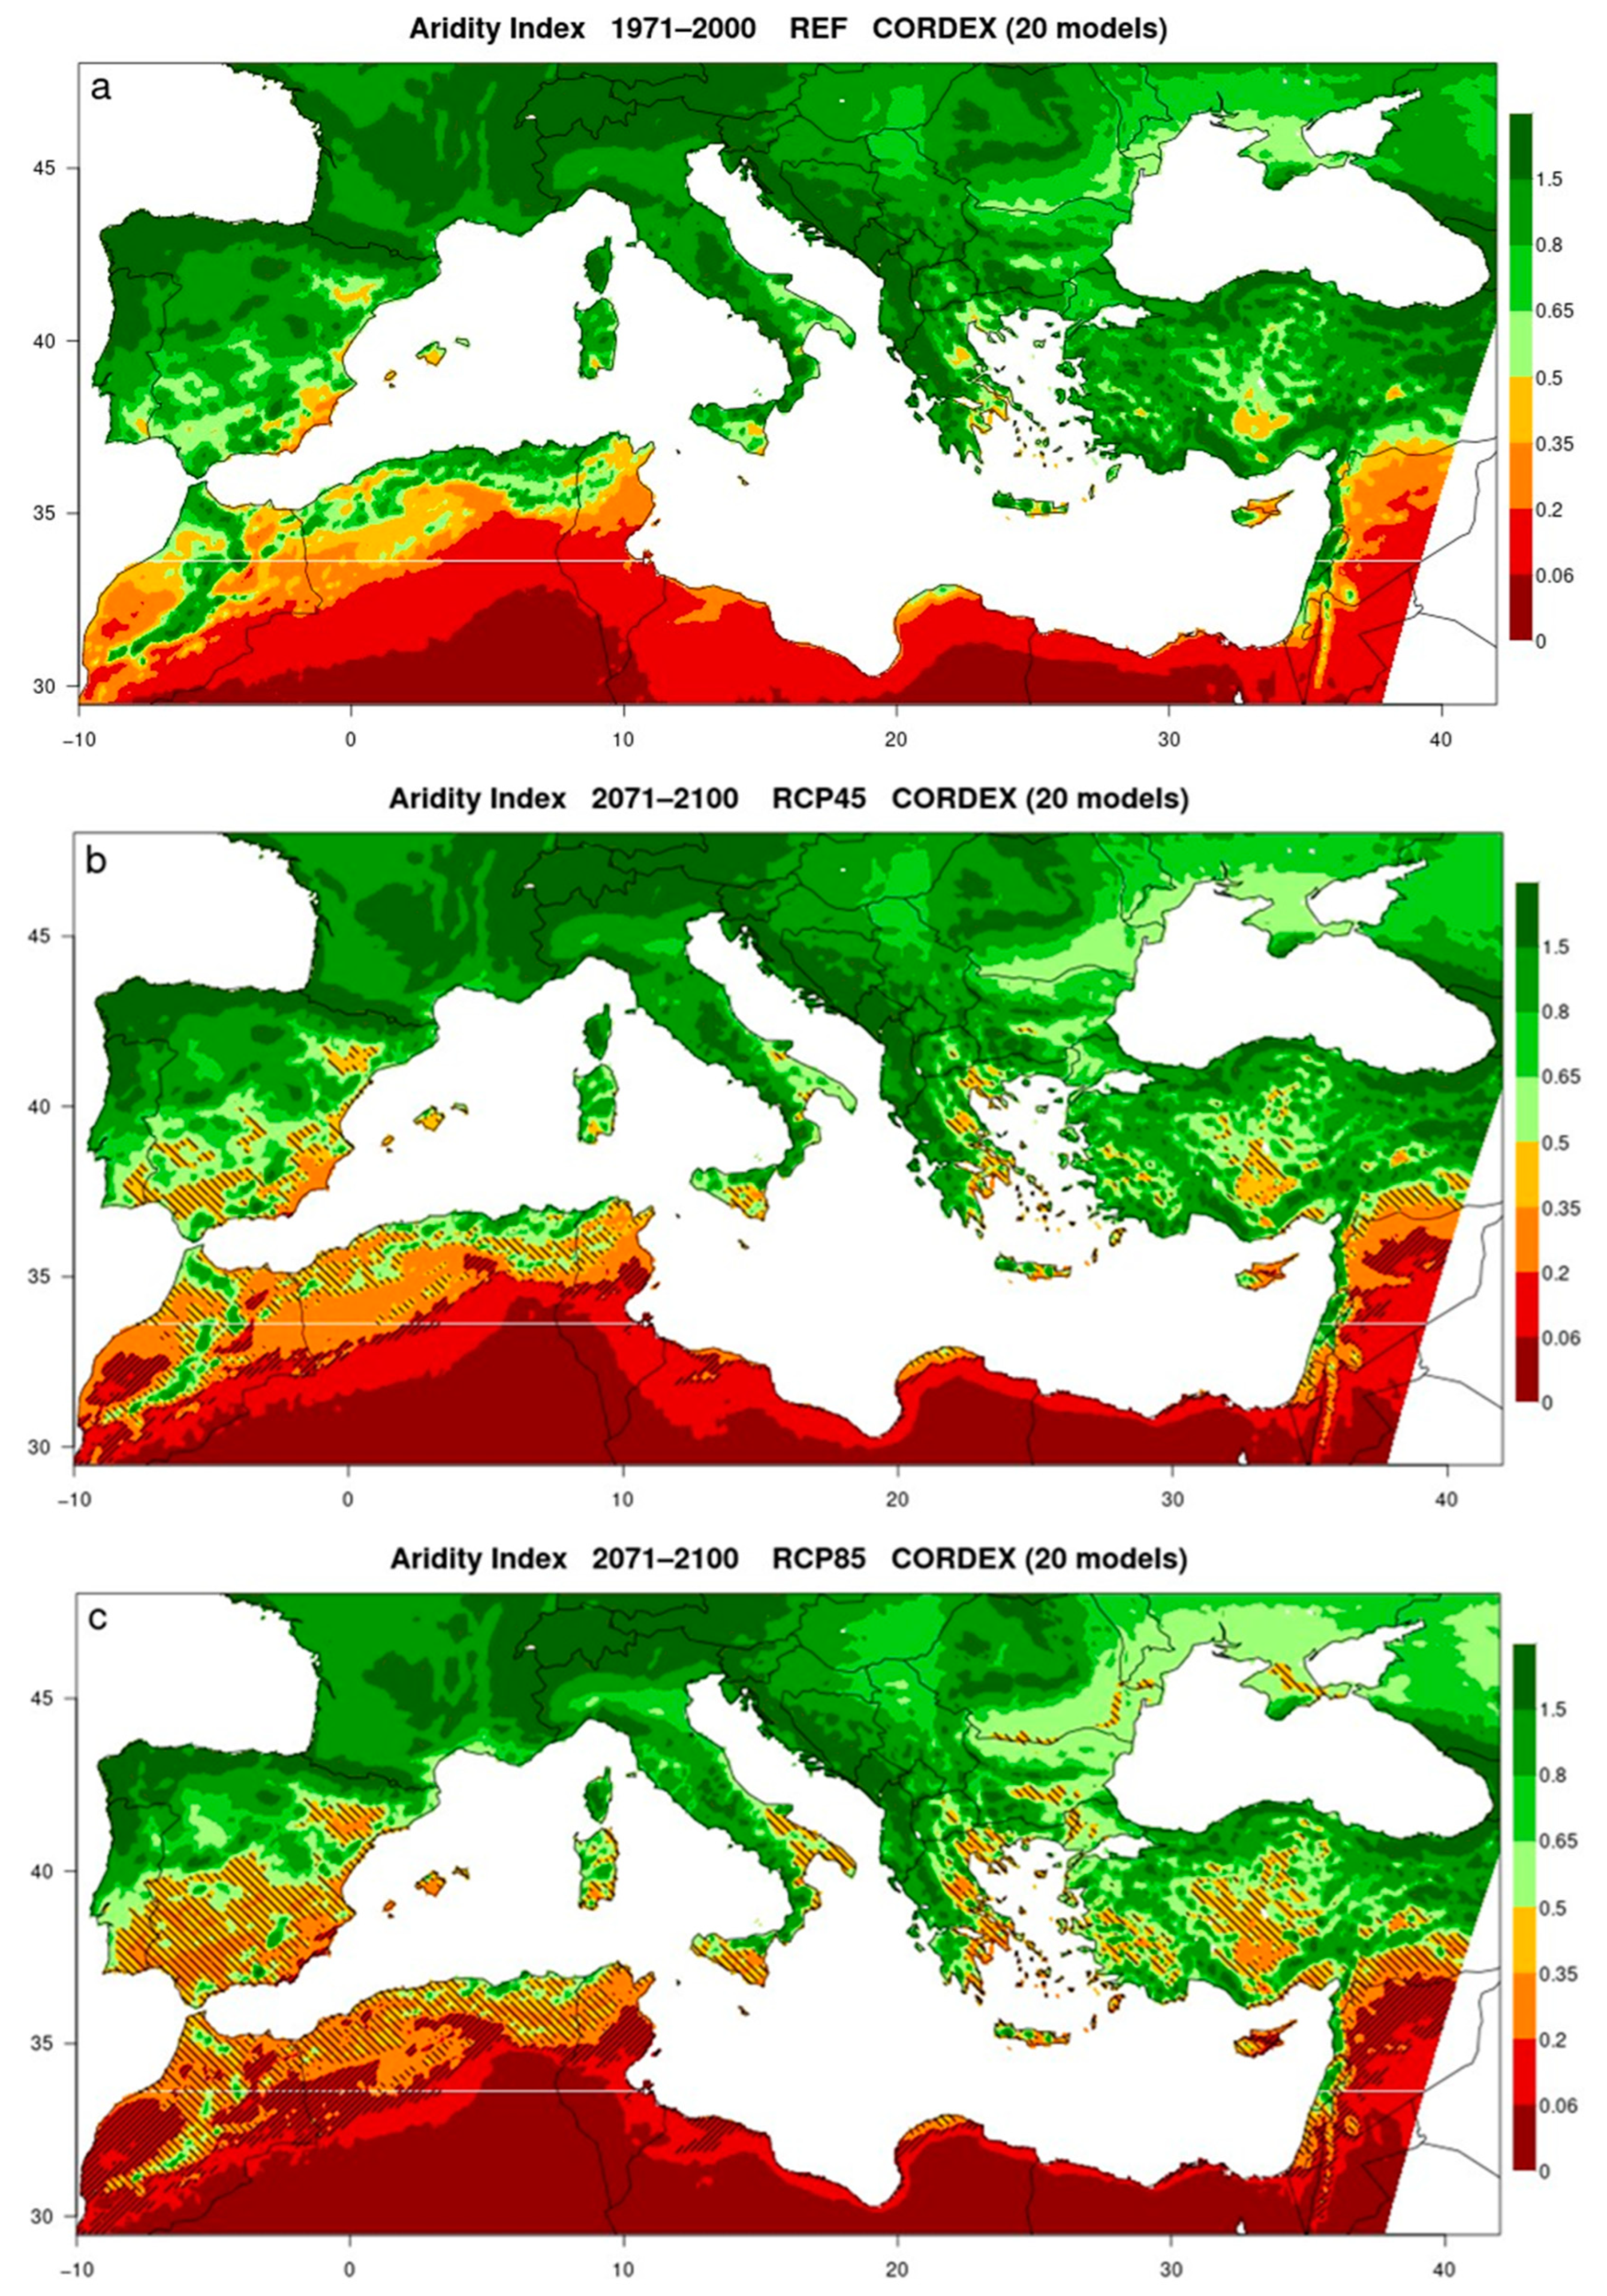
Figure 2 presents the geographical distribution of the Aridity Index in the Mediterranean region during the reference period and during 2071–2100 under both scenarios. In general, the AI is increasing and many areas shift into a semi-arid or arid regime. In Europe, only a few locations are semi-arid during the REF period. Most of them coincide with large plains and they are confined south of the 40° N parallel, the most notable exception being a part of the Ebro basin in northeastern Spain. Under the RCP4.5 scenario, a small arid area emerges in central Cyprus, some new semi-arid areas emerge and the existing ones expand. Semi-arid areas become a more prominent feature of southern Europe, particularly of southern Spain, south-central Turkey, eastern Greece and Sicily. Under the RCP8.5 scenario, the arid area in Cyprus expands further to occupy a significant fraction of the island and some new arid areas emerge along the coastline of southeastern Spain. Together with the semi-arid areas, they become a prominent feature of southern Europe, occupying most of southern Iberian peninsula, and of many islands, along with much of south-central Turkey, eastern Greece and southern Italy. Further, semi-arid areas emerge in Eastern Europe as far north as Crimea and southern Romania.
Much of North Africa is occupied by arid and semi-arid conditions already in the REF period, the Atlas mountains and some of the land between them and the coast being the most notable exception, as well as some small swaths of land along the coastline. Under the RCP4.5 scenario, much of that land shifts to semi-arid conditions, while the arid regions also expand to occupy formerly semi-arid areas. Under the RCP8.5 scenario, almost the entirety of Northern Africa is found under arid or semi-arid conditions.
Along the Levantine coast, only a small stripe of land along the coast has humid and sub-humid conditions during the REF period, as well as some small pieces of land along certain mountains. Under the RCP4.5 scenario, much of those lands shift to semi-arid conditions, mostly the isolated mountainous parts and the southernmost coastlines. Also, a significant fraction of the semi-arid areas shift to arid. The RCP8.5 scenario brings the strongest changes as in the other regions. In the near future period (2031–2060, not shown), the AI is very similar to that in the far future under the RCP4.5 scenario (Figure 2b).
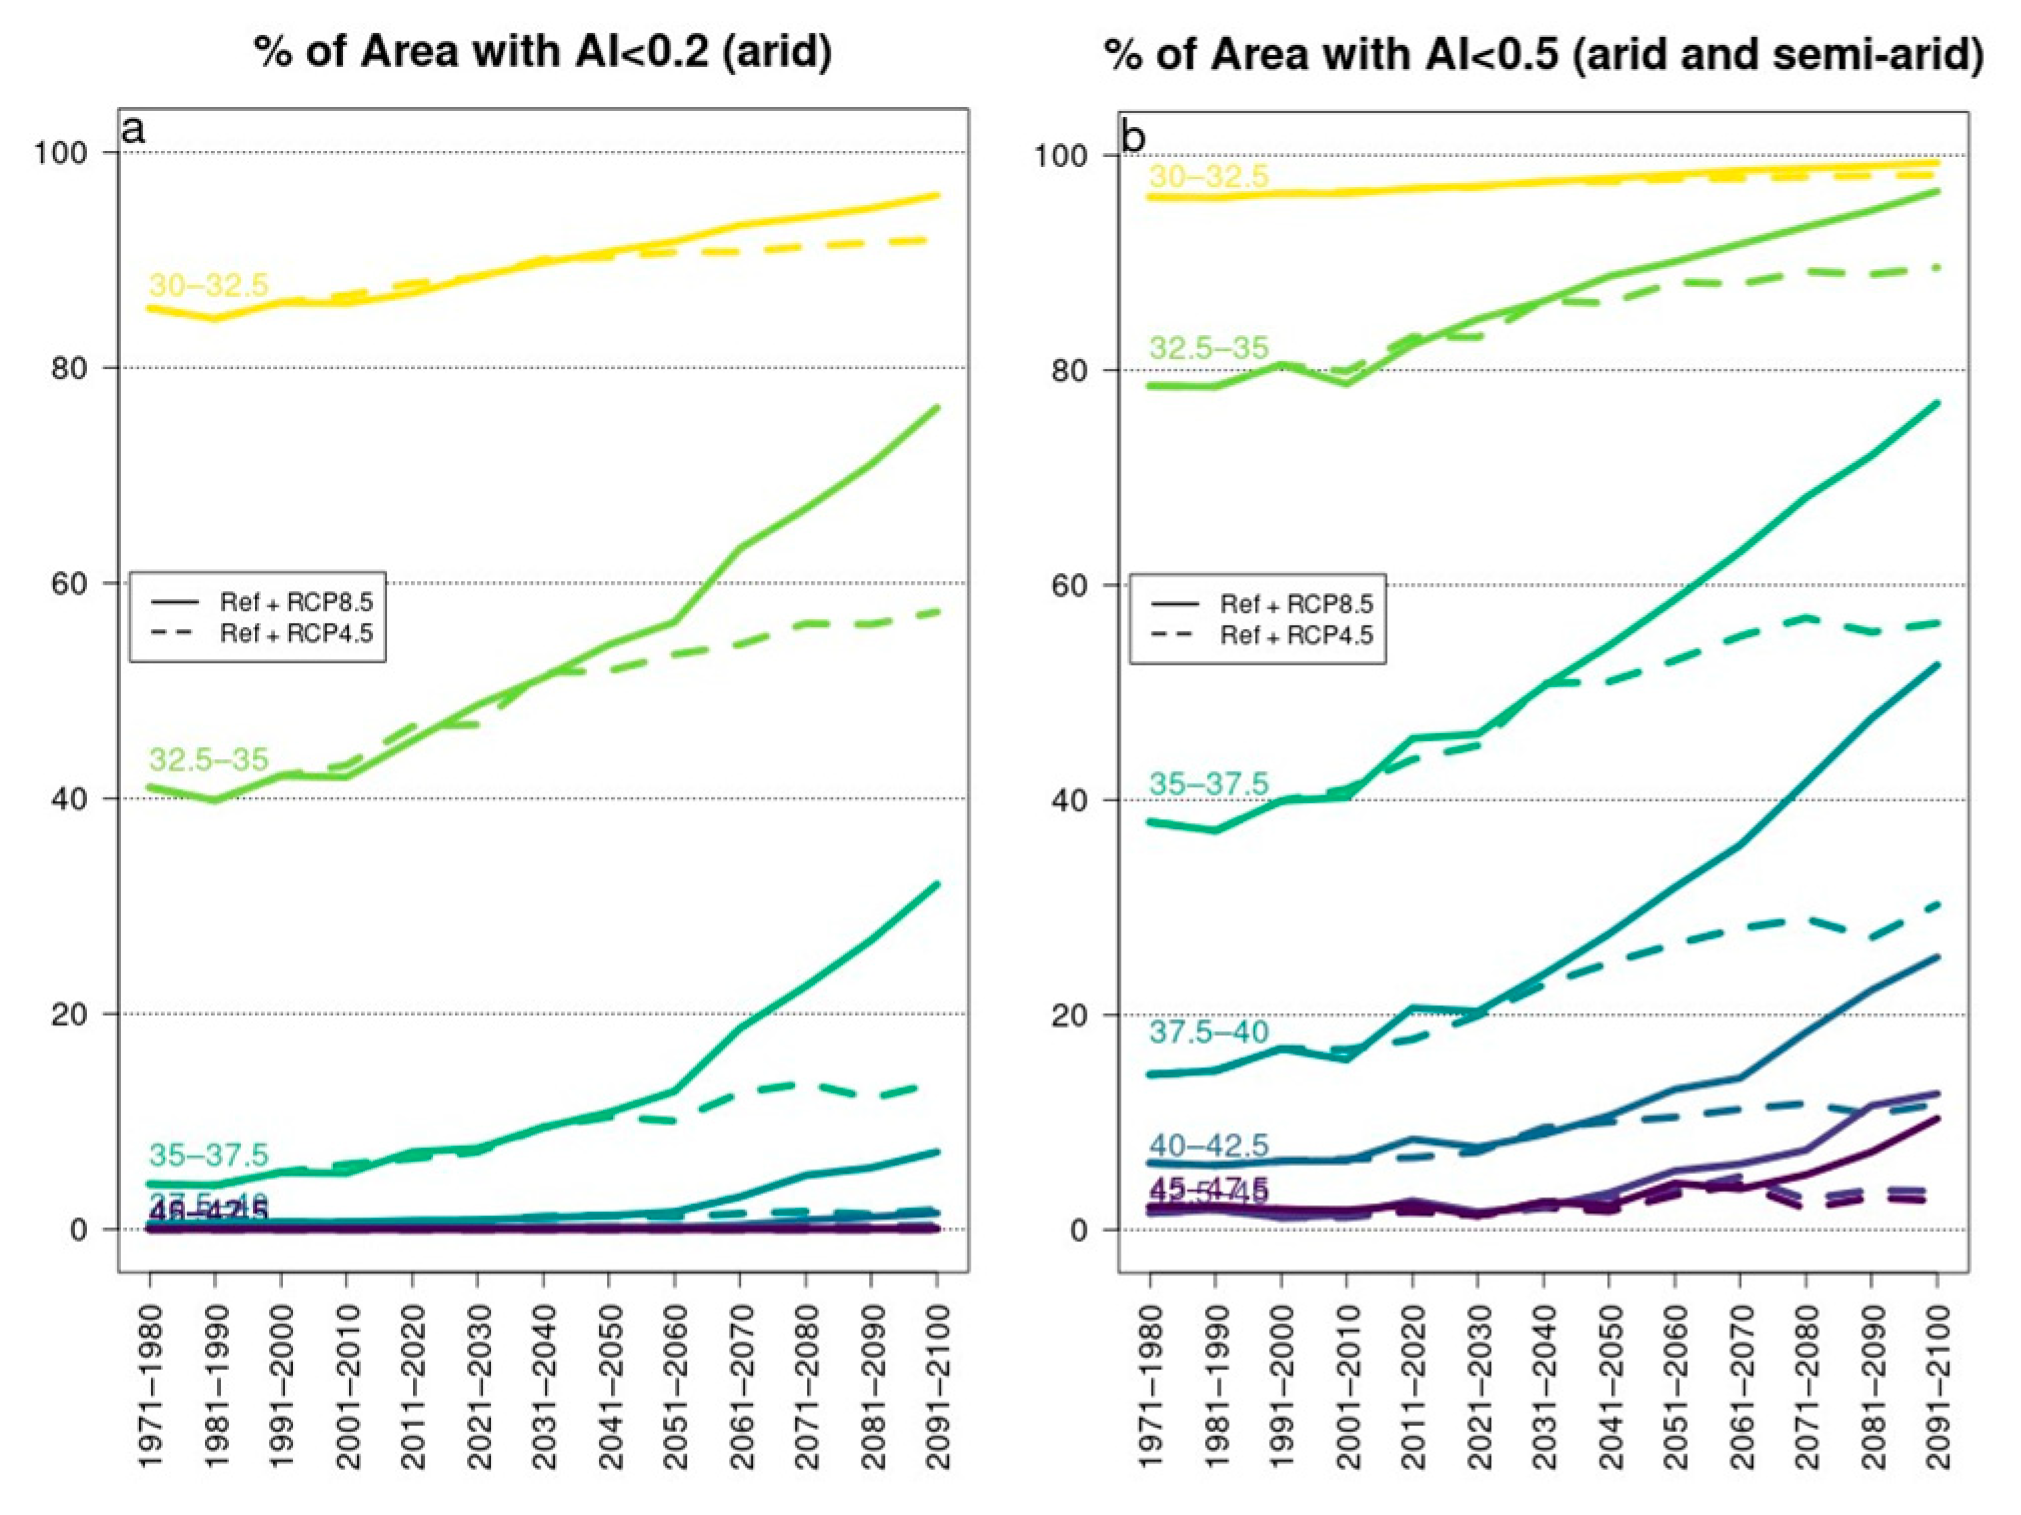
Figure 3 presents a timeseries of the fractional cover of arid and semi-arid conditions in the seven latitudinal zones between 30° N and 47.5° N. The study area ranges from the Sahara desert, where the entire zone is arid, to the humid European mid-latitudes, where 0% of the zone is arid or semi-arid. In those zones, little or no change is projected, but in the intermediate zones, large parts of land are projected to shift into an arid or semi-arid regime throughout the 21st century, as demonstrated by the increasing trend of the timeseries.
The timeseries up to the year 2005 correspond to the REF period and are common for both scenarios. After that, the two scenarios differentiate, although no significant differences occur until the year 2040. Until that year, an increase in the fraction of arid and semi-arid land is projected. After that year, under scenario RCP4.5, the increase continues, although slightly less pronounced, while under scenario RCP8.5 the increase is stronger or, in some cases, retains the same rate. The largest swaths of land entering a more arid regime correspond to the zones 32.5°–37.5° N for the arid regime and 35°–40° N for the semiarid regime.
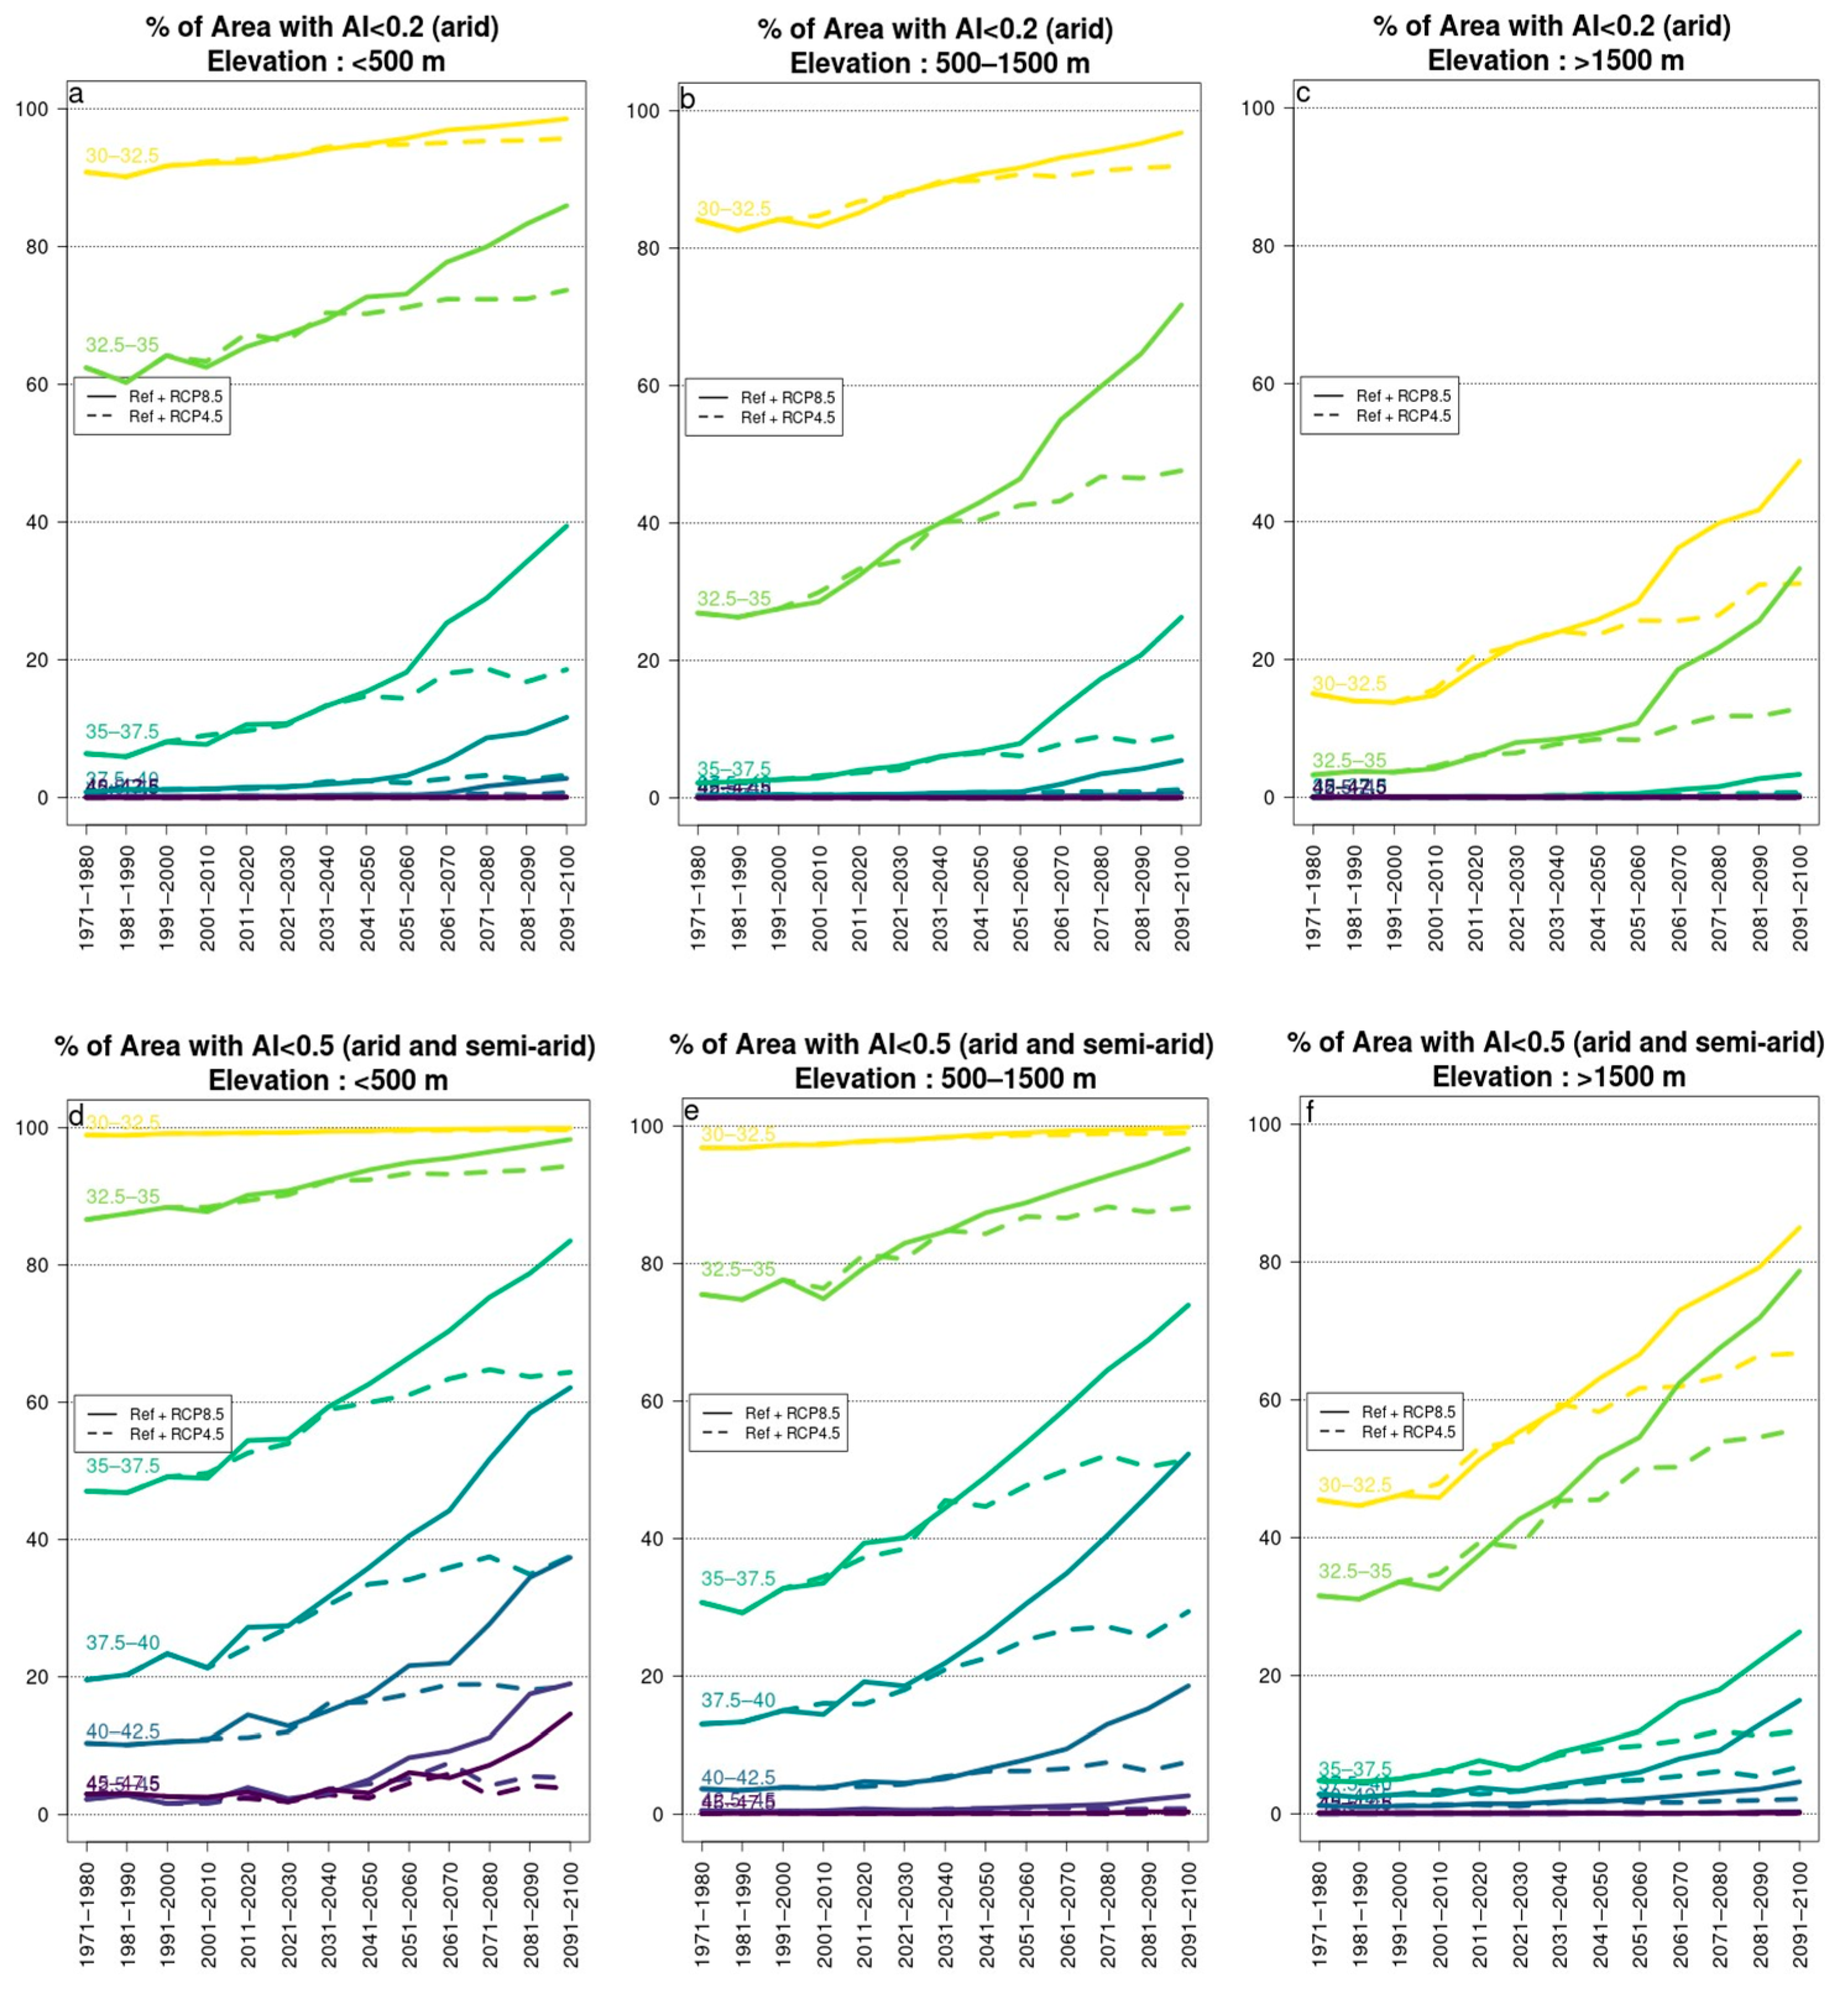
Figure 4 is similar to Figure 3, except that each latitudinal zone is further divided into three elevation classes, namely under 500 m, from 500 to 1500 m and higher than 1500 m. Higher elevation produces different timeseries in a similar way as more northern latitudes do. Although no exact relation can be drawn, the middle elevations (Figure 4b,e) behave similarly to the low elevations (Figure 4a,d) if they were about half a latitudinal zone poleward and the high elevations (Figure 4c,f) behave similarly to the low elevations if they were two latitudinal zones poleward.
The increase in semi-arid land fractions in Europe is significant under the RCP8.5 scenario. Even in the two zones north of 42.5° N, it is projected to reach more than 15% in the low elevations (Figure 4d) by the end of the century. In the next two zones to the south (37.5°–42.5° N), which lie entirely in Europe, the increase is approximately from 15% to 30% and 50% under the RCP4.5 and RCP8.5 scenarios, respectively. In the same latitudinal zone, the change is also significant in the middle elevations (Figure 4e), albeit a little smaller. Also in Europe, in the zone 37.5°–40° N in low lands, the fraction of arid land (Figure 4a) becomes relevant as it reaches about 10% by the end of the century under the RCP8.5 scenario.
The next latitudinal zone (35°–37.5° N) lies partly in Africa. Averaging the low and middle elevations, semi-arid and arid lands (Figure 4d,e) increase from about 40% in the REF period to 55% and 80% under the RCP4.5 and RCP8.5 scenarios, respectively. In the same zones and elevations, the increase in arid land fractions (Figure 4a,b) is also significant, as it is projected to increase from about 5% to 15% and more than 30% in RCP4.5 and RCP8.5, respectively. The effect of these changes may cause a profound adverse effect to agriculture in these areas. Further south, the semi-arid and arid lands are already a dominant feature, but their fraction is projected to increase further, making agricultural lands yet more scarce, especially under the RCP8.5 scenario.
In the high elevations, the fraction of semi-arid lands (Figure 4f) is very small north of 40 N. Between 35° N and 40° N, it is projected to increase to about 15% under the RCP4.5 and 30% under the RCP8.5 scenario from less than 5% during the REF period. Further south, in the 30°–35° N, semi-arid and arid areas are projected to increase from about 40% to 60% or 80% under the RCP4.5 and RCP8.5 scenarios, respectively, with about half of that being arid lands (Figure 4c), although arid lands during the REF period amount to only about 10% of the area. These changes may deteriorate the replenishing of the underground waters, thus causing an important decrease in the water supply of the neighboring areas. As seen in Figure 1, this zone comprises mainly of the Atlas mountains in north-west Africa, which is already heavily dependent on the usage of underground water. The combined effect of the increased aridity in all the altitudes in the region may cause devastating consequences for water availability and the agricultural sector.

4. Discussion and Conclusions

The changes in the Aridity Index of the lands in the Mediterranean region in the period 1971–2100 is studied using the results of an ensemble of 20 regional simulations based on several global simulations. Overall, the Index is projected to decrease strongly, causing water to become a much more scarce and valuable commodity and degrading large parts of the land into a semi-arid or arid regime in all latitudinal zones of the study area. The problem will be most pronounced in the regions closest to the desert, which points to the need for adaptation in the form of proactive measures for the better management of water resources.
The results exhibit a strong dependence on the greenhouse gas concentrations scenario, pointing to the importance of climate change mitigation as well. Our results are in agreement with the poleward shift of climatic zones discussed by numerous researchers (e.g., [6] and references therein).
Further work will include the usage of more state-of-the-art methodology [4]. The usage of input from more models and more greenhouse gas scenarios will also be considered. Finally, in our future work, effort will be given to focus more on arid conditions in the warm period.

Author Contributions

Conceptualization, K.D. and J.K.; methodology, K.D. and J.K.; formal analysis, K.D., J.K., S.S., A.P., T.S., P.N. and C.Z.; writing—original draft preparation, K.D., J.K., S.S., A.P., T.S., P.N. and C.Z.; visualization, K.D. and J.K. All authors have read and agreed to the published version of the manuscript.

Funding

This research received no external funding.

Institutional Review Board Statement

Not applicable.

Informed Consent Statement

Not applicable.

Data Availability Statement

Data available on request.

Conflicts of Interest

The authors declare no conflict of interest.

Abbreviations

The following abbreviations are used in this manuscript:
AIAridity Index
FFFar-future period (2031–2060)
NFNear-future period (2071–2100)
PET Potential evapotranspiration
REFReference period (1971–2000)

References

  1. Diffenbaugh, N.S.; Giorgi, F. Climate change hotspots in the CMIP5 global climate model ensemble. Clim. Chang. 2012, 114, 813–822. [Google Scholar] [CrossRef]
  2. Lionello, P.; Scarascia, L. The relation between climate change in the Mediterranean region and global warming. Reg. Environ. Chang. 2018, 18, 1481–1493. [Google Scholar] [CrossRef]
  3. Kapsomenakis, J.; Douvis, C.; Poupkou, A.; Zerefos, S.; Solomos, S.; Stavraka, T.; Melis, N.S.; Kyriakidis, E.; Kremlis, G.; Zerefos, C. Climate change threats to cultural and natural heritage UNESCO sites in the Mediterranean. Environ. Dev. Sustain. 2022. [CrossRef]
  4. UNESCO. Map of the world distribution of arid regions: Explanatory note. In Programme on Man and the Biosphere (MAB); Technical Notes 7; UNESCO: Paris, France, 1979. [Google Scholar]
  5. Thornthwaite, C.W. An approach toward a rational classification of climate. Geogr. Rev. 1948, 38, 55–94. [Google Scholar] [CrossRef]
  6. Tamarin-Brodsky, T.; Kaspi, Y. Enhanced poleward propagation of storms under climate change. Nat. Geosci. 2017, 10, 908–913. [Google Scholar] [CrossRef]
Figure 1. Orography of DMI-HIRHAM5 in the Mediterranean region. The latitudinal zones of 30°–32.5° N, 32.5°–35° N, 35°–37.5° N, 37.5°–40° N, 40°–42.5° N, 42.5°–45° N and 45°–47.5° N are presented as horizontal lines. The buffer zone is denoted as a diagonal line.
Environsciproc 26 00171 g001
Figure 2. Maps of the Aridity Index in the Mediterranean region: (a) REF period (1971–2000). (b) FF period (2071–2100) under RCP4.5 scenario. (c) FF period (2071–2100) under RCP8.5 scenario. Areas that shift into semi-arid and arid conditions since the REF period are denoted with left and right slanting diagonal lines, respectively.
Environsciproc 26 00171 g002
Figure 3. Decadal timeseries of the fraction of the land of the seven latitudinal zones of the study area presented in Figure 1 that is: (a) arid and (b) arid or semi-arid. Time spans 1971–2100 under both RCP4.5 (dashed lines) and RCP8.5 (full lines) scenarios. The years 1971–2005 are part of the REF period and are common for both scenarios.
Environsciproc 26 00171 g003
Figure 4. Decadal timeseries of the fraction of the land of the seven latitudinal zones of the study area presented in Figure 1 that is: (a) arid and has elevation of up to 500 m, (b) 500–1500 m, (c) more than 1500 m, (d) semi-arid or arid and has elevation of up to 500 m, (e) 500–1500 m, (f) more than 1500 m. Time spans 1971–2100 under both RCP4.5 (dashed lines) and RCP8.5 (full lines) scenarios. The years 1971–2005 are part of the REF period and are common for both scenarios.
Environsciproc 26 00171 g004
Disclaimer/Publisher’s Note: The statements, opinions and data contained in all publications are solely those of the individual author(s) and contributor(s) and not of MDPI and/or the editor(s). MDPI and/or the editor(s) disclaim responsibility for any injury to people or property resulting from any ideas, methods, instructions or products referred to in the content.

