Proceeding Paper

Microclimate Changes Due to the Operation of Energy Infrastructures †

by
Κonstantinos Kalkanis
1,*,
Νikolaos M. Manousakis
1,
Κonstantinos Pachigiannakis
1 and
Constantinos S. Psomopoulos
1,2,*
1
Electrical and Electronics Engineering Department, School of Engineering, University of West Attica, Campus 2 Thivon 250, Aigaleo, 12241 Attica, Greece
2
Earth Engineering Center, Columbia University, 500 West 120th St., New York, NY 10027, USA
*
Authors to whom correspondence should be addressed.
Presented at the 16th International Conference on Meteorology, Climatology and Atmospheric Physics—COMECAP 2023, Athens, Greece, 25–29 September 2023.
Environ. Sci. Proc. 2023, 26(1), 129; https://doi.org/10.3390/environsciproc2023026129
Published: 29 August 2023

Abstract

:
The changes in the local microclimate from the installations of renewable energy systems and thermal units for the production of electrical power, as well as the statistical analysis of the data recorded from various official data sources are presented in this paper. In this context, bibliographic data were recorded, such as temperature and rainfall data in the vicinity of units for the production of electrical power from renewable energy systems and power plants. The data were collected from various databases and an assessment of the impact of different types of power plants on the local climate was conducted. The different types of energy sources are thoroughly categorized. Furthermore, climate data of the wider location of selected energy production plants were analyzed before, during and / or after the end of their operation. Finally, an analysis will be carried out and conclusions will be drawn regarding the climate change endured in the said locations.

1. Introduction

Emissions of air pollutants from anthropogenic factors have increased greatly due to industrial activities and are currently at an all-time high. The effects of these increased CO2 concentrations, along with other harmful pollutants have been detected throughout the climate system and are highly likely to be the dominant cause of the global warming seen in recent decades. Anthropogenic emissions of gaseous pollutants compared to the pre-industrial era have led to a large increase in the concentrations of carbon dioxide (CO2), methane (CH4) and nitrous oxide (N2O) in the atmosphere. The increase in all these gaseous pollutants has led to the well-known greenhouse effect.

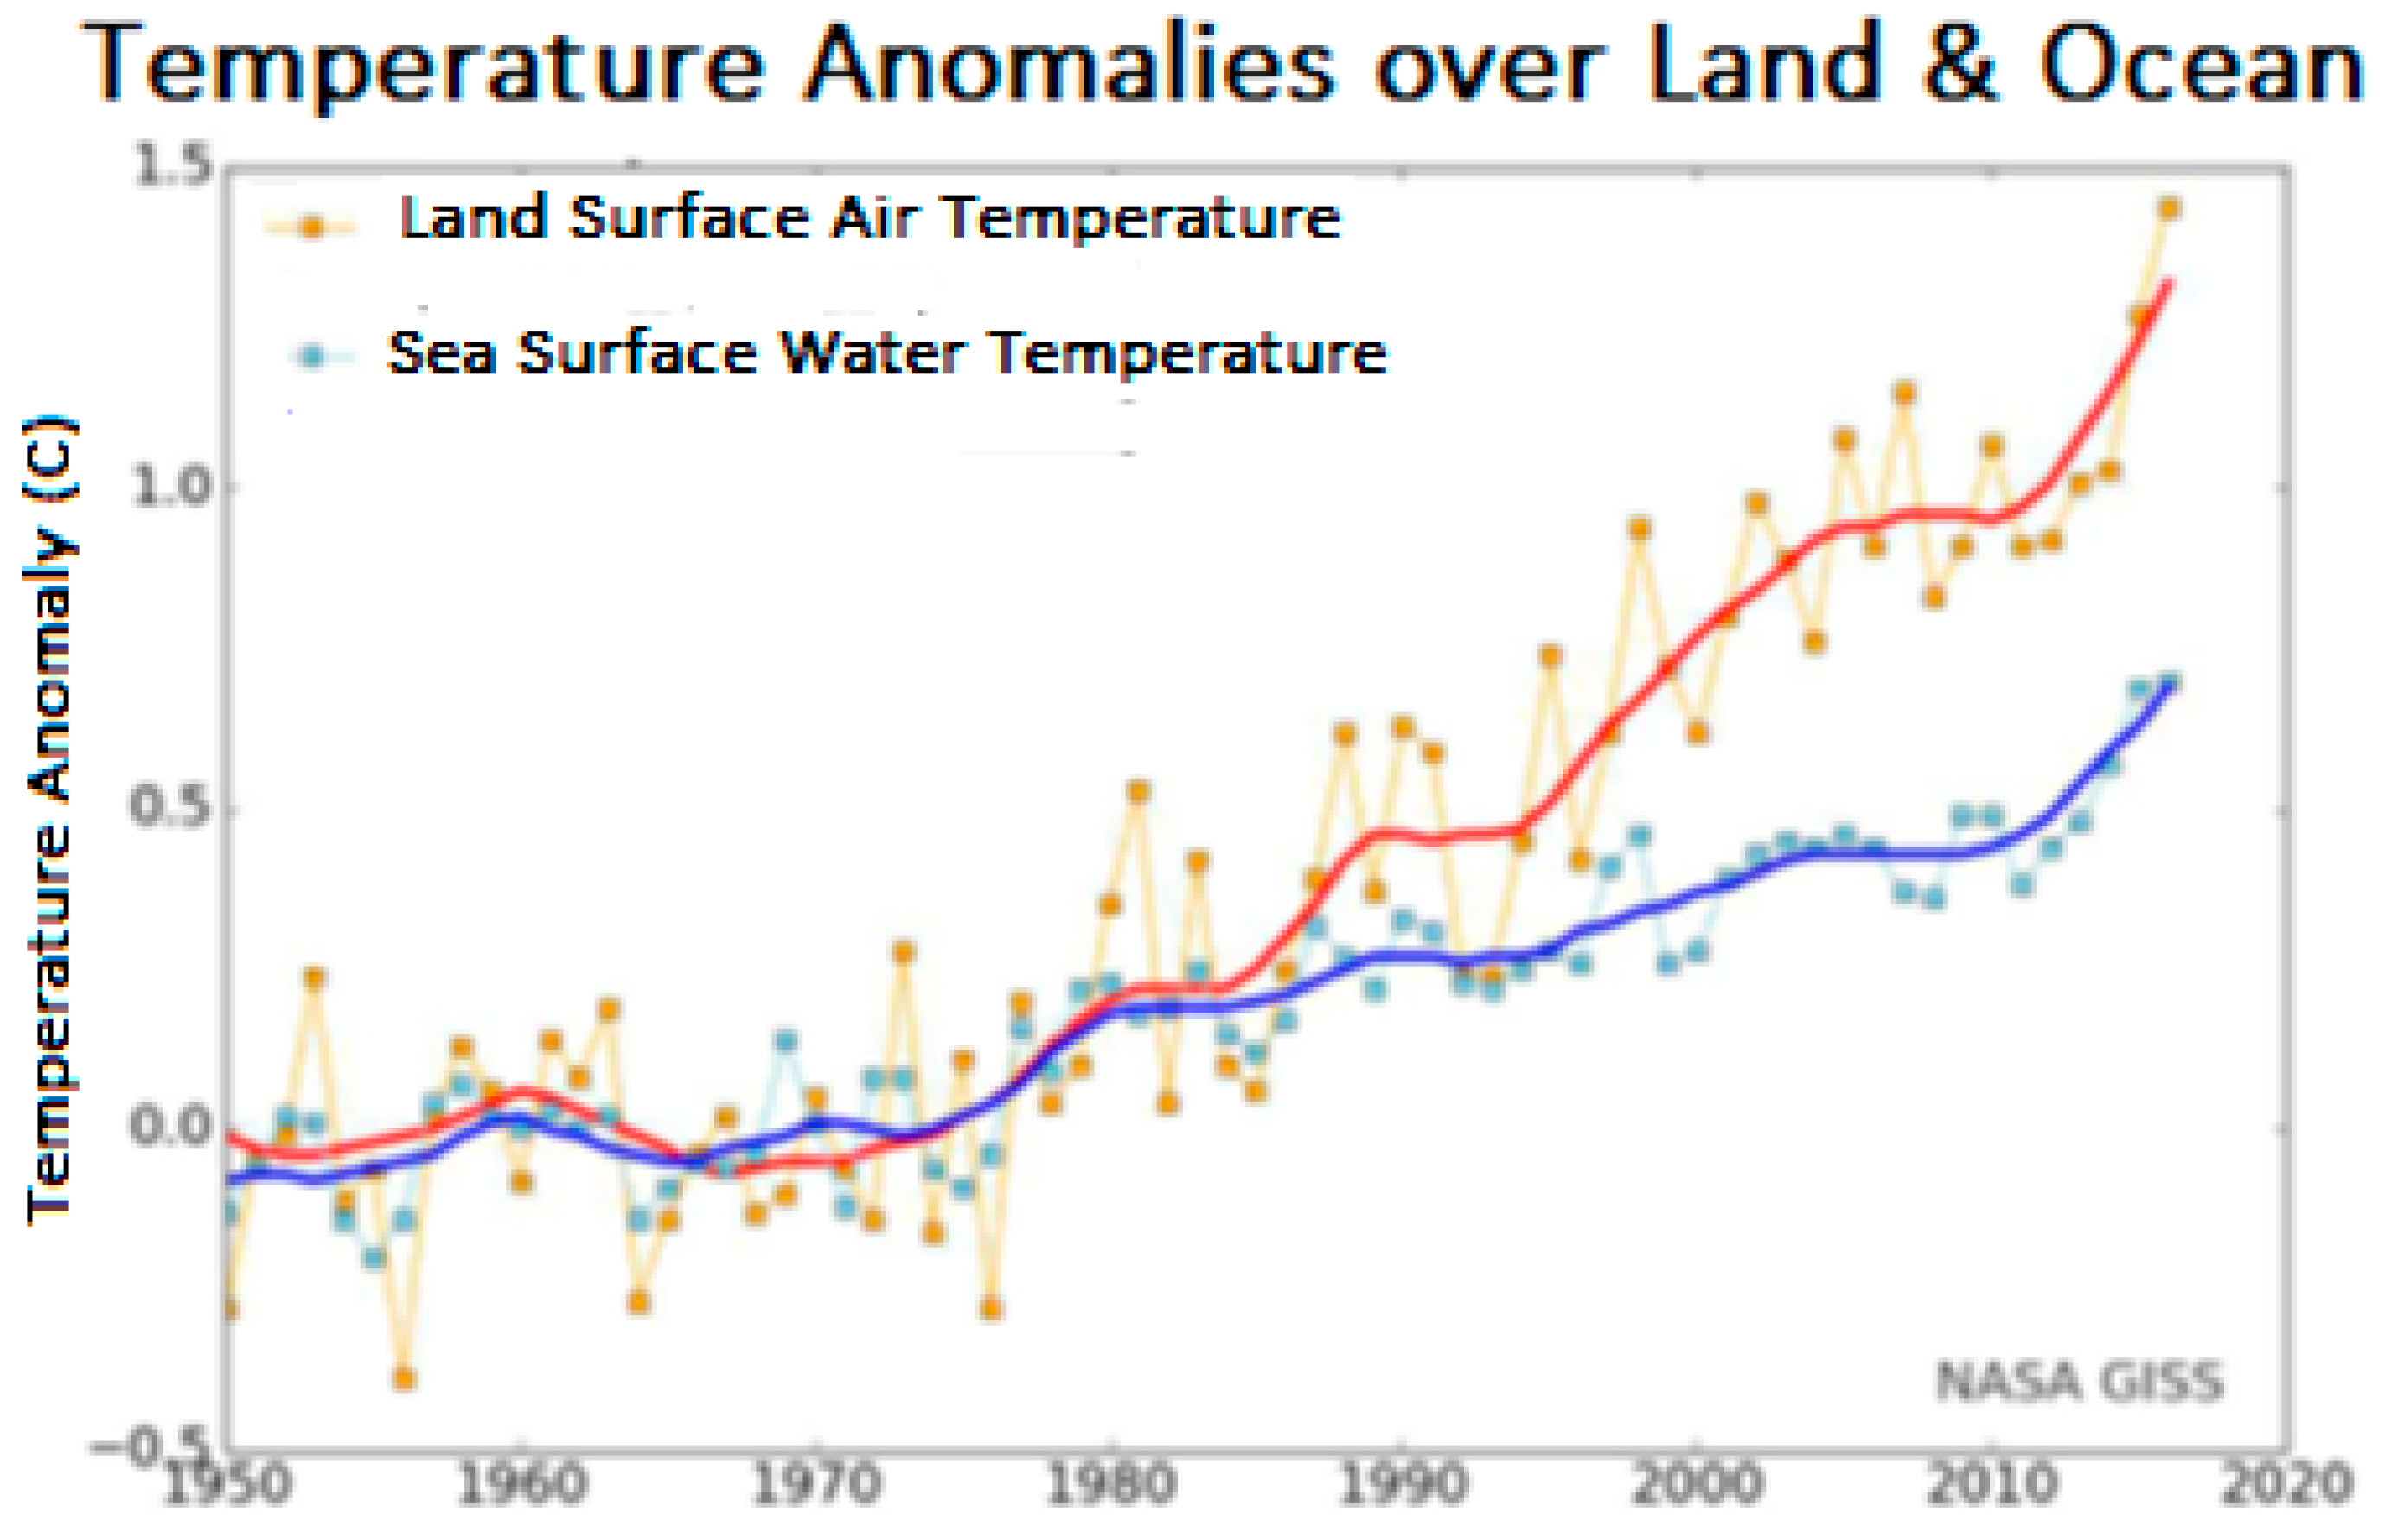
1.1. Effects of Climate Change

Today, the human influence on the climate system is very large, with recent anthropogenic greenhouse gas emissions being the highest they have ever been. Relatively more recent climate changes are more intense and have far-reaching effects on human and natural systems. From the exploitation and use of fossil and liquid fuels (such as lignite, oil, gasoline, etc.) huge amounts of CO2 and other greenhouse gases are emitted into the atmosphere that absorb the infrared radiation emitted by the Earth and trap the heat with resulting in an increase in the temperature of the planet. According to measurements by the Climate Change Group of the University of East Anglia [1], the average temperature of the planet has increased by 0.6 °C in the last century, which means the biggest increase in temperature in the last thousand years. The IPPC forecast for this century is a rise in average temperature of 1.1 to 6.4 °C (Figure 1). Of course, the variations are large: some areas warm less and others more. As land warms faster than water, because it absorbs more heat, in the Northern Hemisphere we have a greater increase in temperature.

1.2. Future Effects of Climate Change

Climate change will amplify existing risks and create new ones, increasing the likelihood of severe and irreversible impacts on people, species and ecosystems. The risks will not be the same in all regions and will generally be greater for disadvantaged individuals and communities in countries with low levels of development, such as developing countries. Continued high emissions of gaseous pollutants have been found to lead to negative effects mainly on biodiversity, ecosystem and economic development. As the consequences mount, so too will the cost to livelihoods and food and human security. In addition, climate change is expected to increase the intensity or frequency of extreme weather events, such as storms, floods, droughts and heat waves. Around 90% of all natural disasters in Europe since 1980 were directly or indirectly linked to climate [2]. Average weather events and associated disasters in Europe between 1998 and 2007 increased by around 65% compared to the 1980s average.
Furthermore, global warming is projected to increase global food production as long as temperatures remain within the range of 1.5–3.5 °C above pre-industrial temperatures (0.7 °–2.7 °C above than the average global temperature today) [3]. However, in some parts of Southern Europe the growing season is becoming shorter [4].

2. Study of Climate Indicator Trends in Areas with Energy Production Units

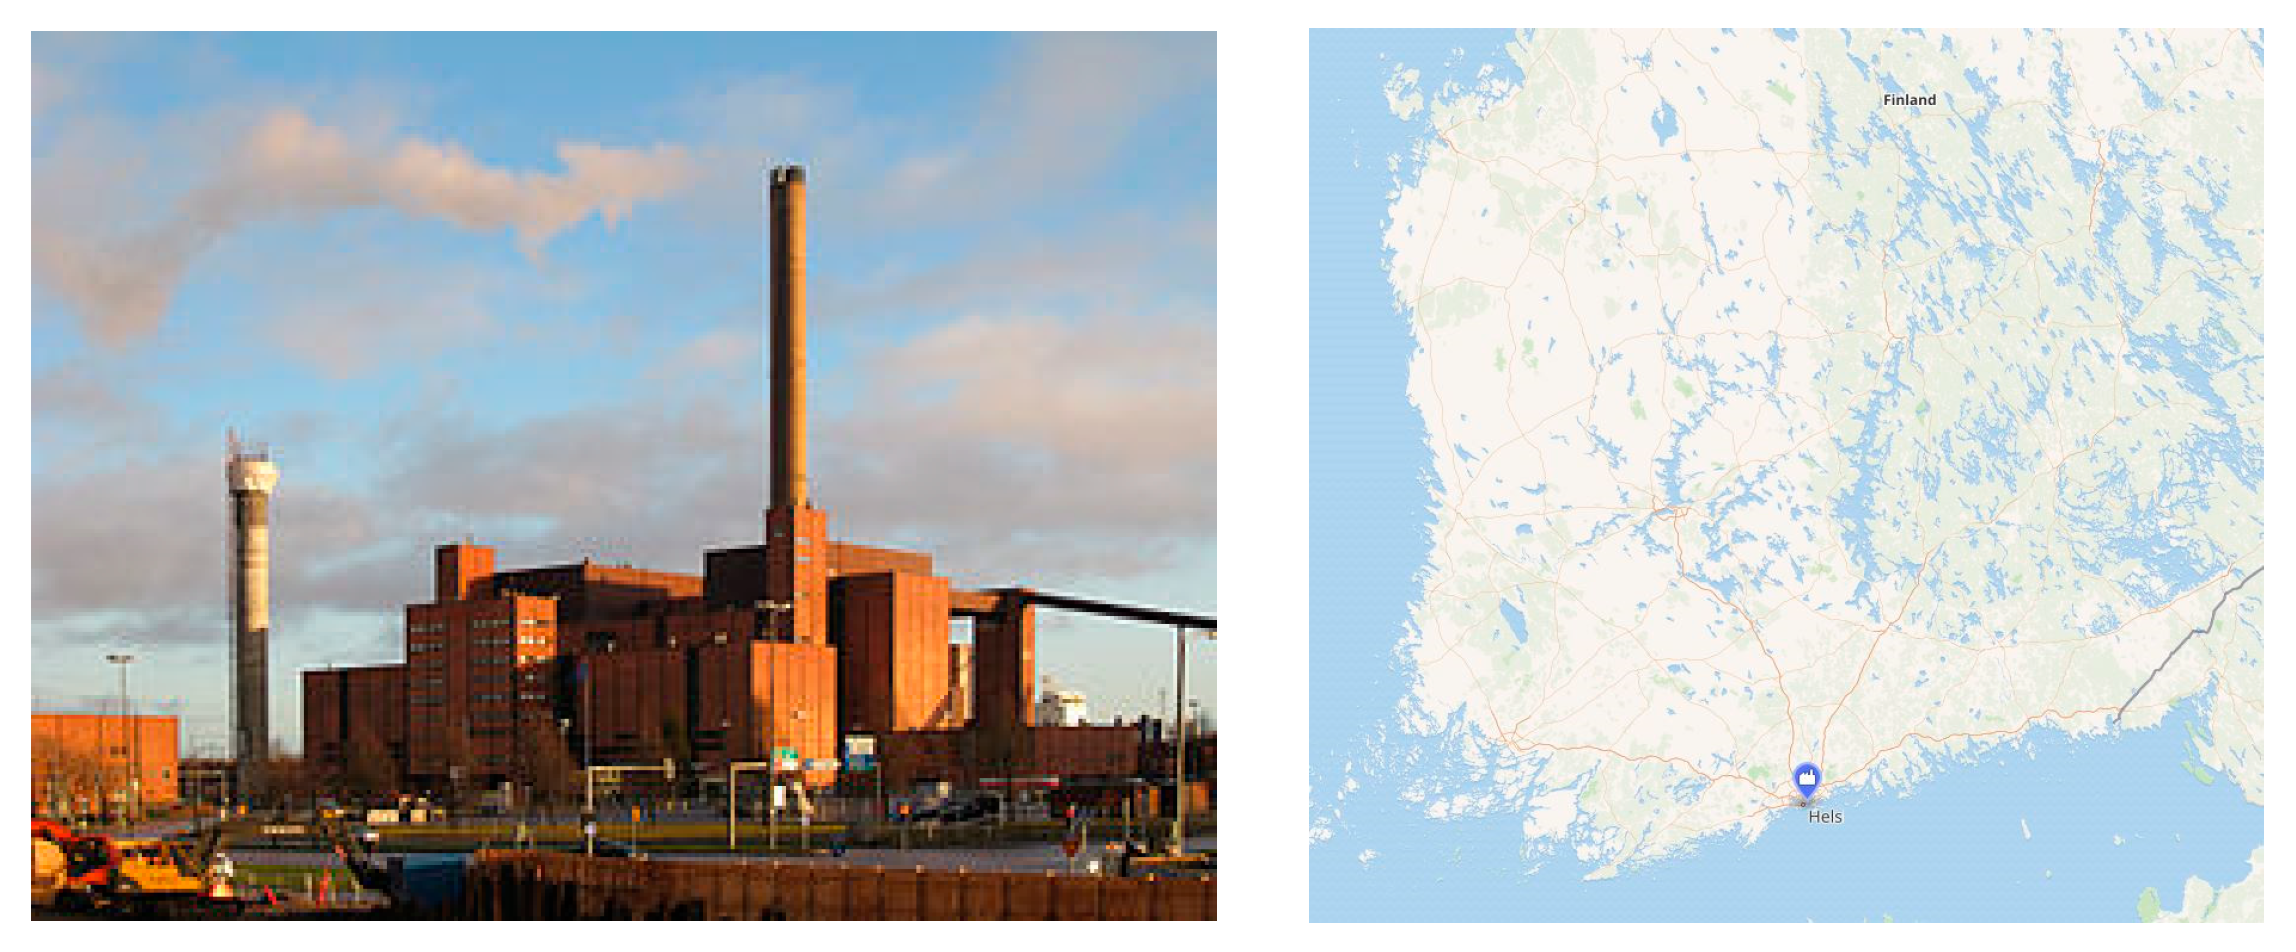
2.1. Hanasaari Power Plant/Finland

The Hanasaari A power plant was built in 1960–1967. Hanasaari B Power Station, built next to Hanasaari A, was commissioned in 1974. Hanasaari A was decommissioned in 2000 and decommissioned in 2008. Hanasaari B is a coal-fired cogeneration plant that produces electricity and heat. The power of the plant is 220 MW of electricity and it is equipped with two furnaces. The exact location of the unit is in Hanasaari, Sornaniner district in Helsinki and has the following map coordinates: 60°10.9′ N 24°58.0′ E, and the installation location is shown in Figure 2. Below (Figure 3 and Figure 4) are the average annual temperatures, highest annual temperatures and precipitation found from analyses carried out by the world bank “https://climateknowledgeportal.worldbank.org/country/finland (accessed on 24 March 2023)” on climate change for Finland for years 1901–2021. Finland experiences higher average temperatures due to warm air movements from the Atlantic Ocean (Gulf Stream). The average yearly temperature in the southwestern region of Finland is 5.5 °C, with a gradual decrease towards the northeast. Finland experiences rapid weather changes and unpredictable precipitation patterns. The average yearly precipitation in southern and central Finland ranges from 600 to 750 mm, with the exception of coastal areas. Northern Finland’s annual precipitation ranges from 450 to 650 mm.

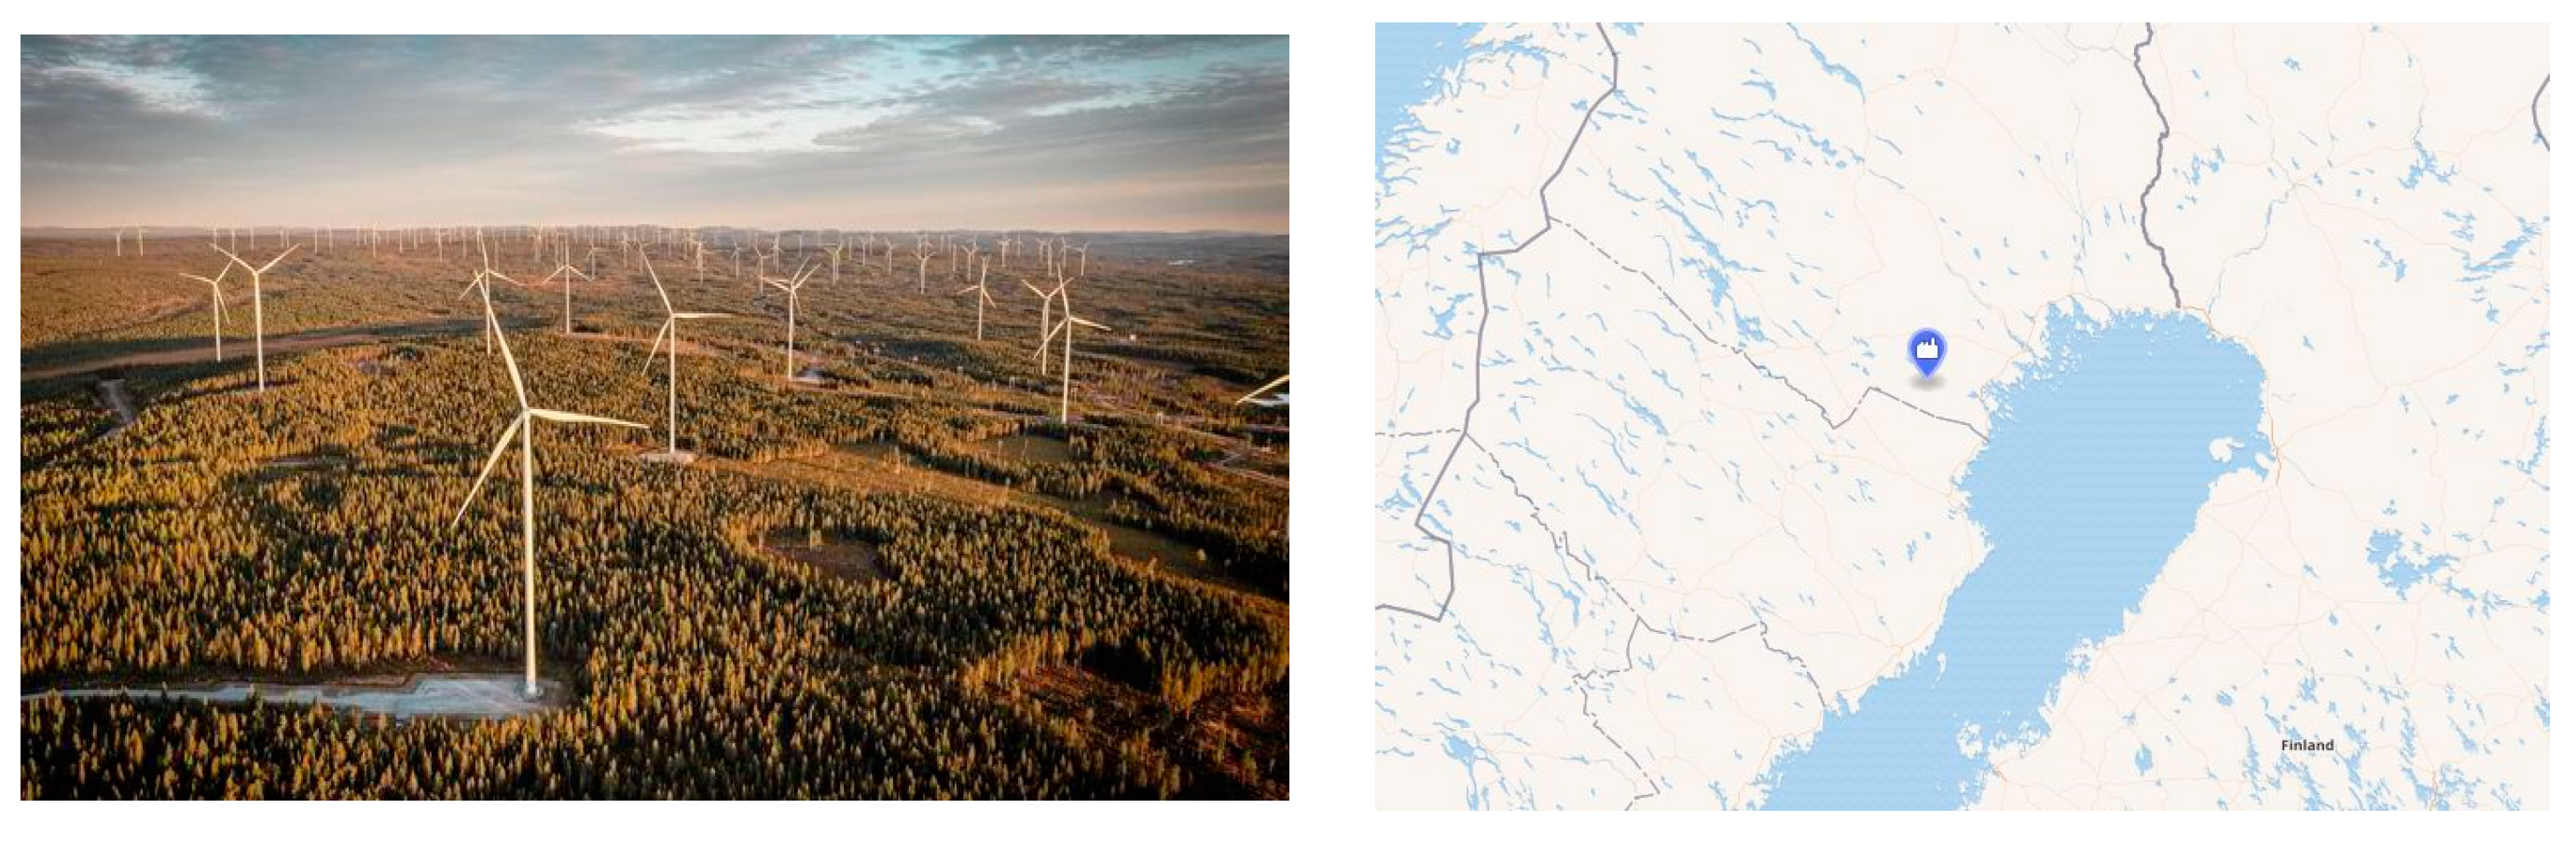
2.2. Markbygden Wind Farm/Sweden

The Markbygden windfarm is a series of interconnected wind farms in the Markbygden area west of Piteå, Norrbotten county, in northern Sweden. The project is expected to be completed by 2024 and could have a capacity of up to 4000 megawatts (MW), comprising up to 1101 wind turbines. The Markbygden wind farm is already the largest wind farm in Europe, on track to be one of the largest onshore wind farms in the world. Its construction began in 2008 and is divided into three phases. The first phase became operational in 2014. The exact location of the windfarm is in the Markbygden area west of Piteå, Norrbotten county in northern Sweden and has the following map coordinates 65°25′ N 20°40′ E, and the installation location is shown in Figure 5.
Figure 6 and Figure 7 present the average annual temperatures, highest annual temperatures and precipitation found from analyses carried out by the world bank “https://climateknowledgeportal.worldbank.org/country/sweden (accessed on 20 March 2023)” on climate change for Sweden for the years 1901–2021. These data refer to Norrbotten County, Sweden, where the above units are located. Generally, Sweden experiences moderate winters due to its proximity to the North Atlantic and prevailing south-westerly to westerly winds. However, the northernmost region of the country has a sub-Arctic climate characterized by long, cold and snowy winters. The mean daily temperature in July was highest in south-eastern Sweden at +17 °C, while it was slightly above 10 °C in the northern region. Low-pressure systems produce precipitation throughout the year, with the highest amount occurring during the summer and autumn seasons. Western Sweden receives the highest amount of precipitation due to the prevalence of low-pressure systems originating from the west or southwest.

2.3. Rønland Offshore Wind Farm/Denmark

Rønland Offshore Wind Farm is an offshore wind farm in the westernmost part of Limfjorden, Denmark. Commissioned in 2003, it consists of four 2 MW Vestas wind turbines and four 2.3 MW wind turbines from Bonus/Siemens. The exact location of Ronland wind farm is in the westernmost part of Limfjorden, Denmark, and it has the following coordinates on the map: 56°39′46″ N 8°13′10″ E, and the installation location is shown in (Figure 8). Below (Figure 9 and Figure 10) are the average annual temperatures, highest annual temperatures and precipitation found from analyses carried out by the world bank “https://climateknowledgeportal.worldbank.org/country/denmark (accessed on 19 March 2023)” on climate change for Denmark for years 1901–2021. These data concern the Nordjeland region of Denmark where the W/F is located. Denmark has a temperate climate with uniform precipitation throughout the year. The average yearly temperature and precipitation are 8.3 °C and 746 mm, respectively. The mean annual temperature fluctuates annually between 6 °C to 10 °C, with an average of 8.3 °C (1981–2010) and 8.9 °C (2006–2015).

3. Conclusions

The data required regarding the microclimate of each area were difficult to collect as well as the detailed historical data. There are some services that have different historical climate data for specific areas but with the corresponding payment.
After extensive research, it was possible to find data from the World Bank portal regarding climate change. The data are for average annual temperatures, average highest annual temperatures, average lowest temperatures and precipitation from analyses carried out for the years 1901–2021 according to [5,6,7]. The above data concern the wider area of each facility and not the local climate data (microclimate) which were very difficult to collect. Nevertheless, the data of the wider area where the energy production units are located were recorded because the effects are more intense in the local microclimate but can also be extended to the climate of the wider area. By studying the available climate data collected and recorded in previous chapters for the selected areas of energy production facilities (thermal or RES) we are led to the following conclusions:
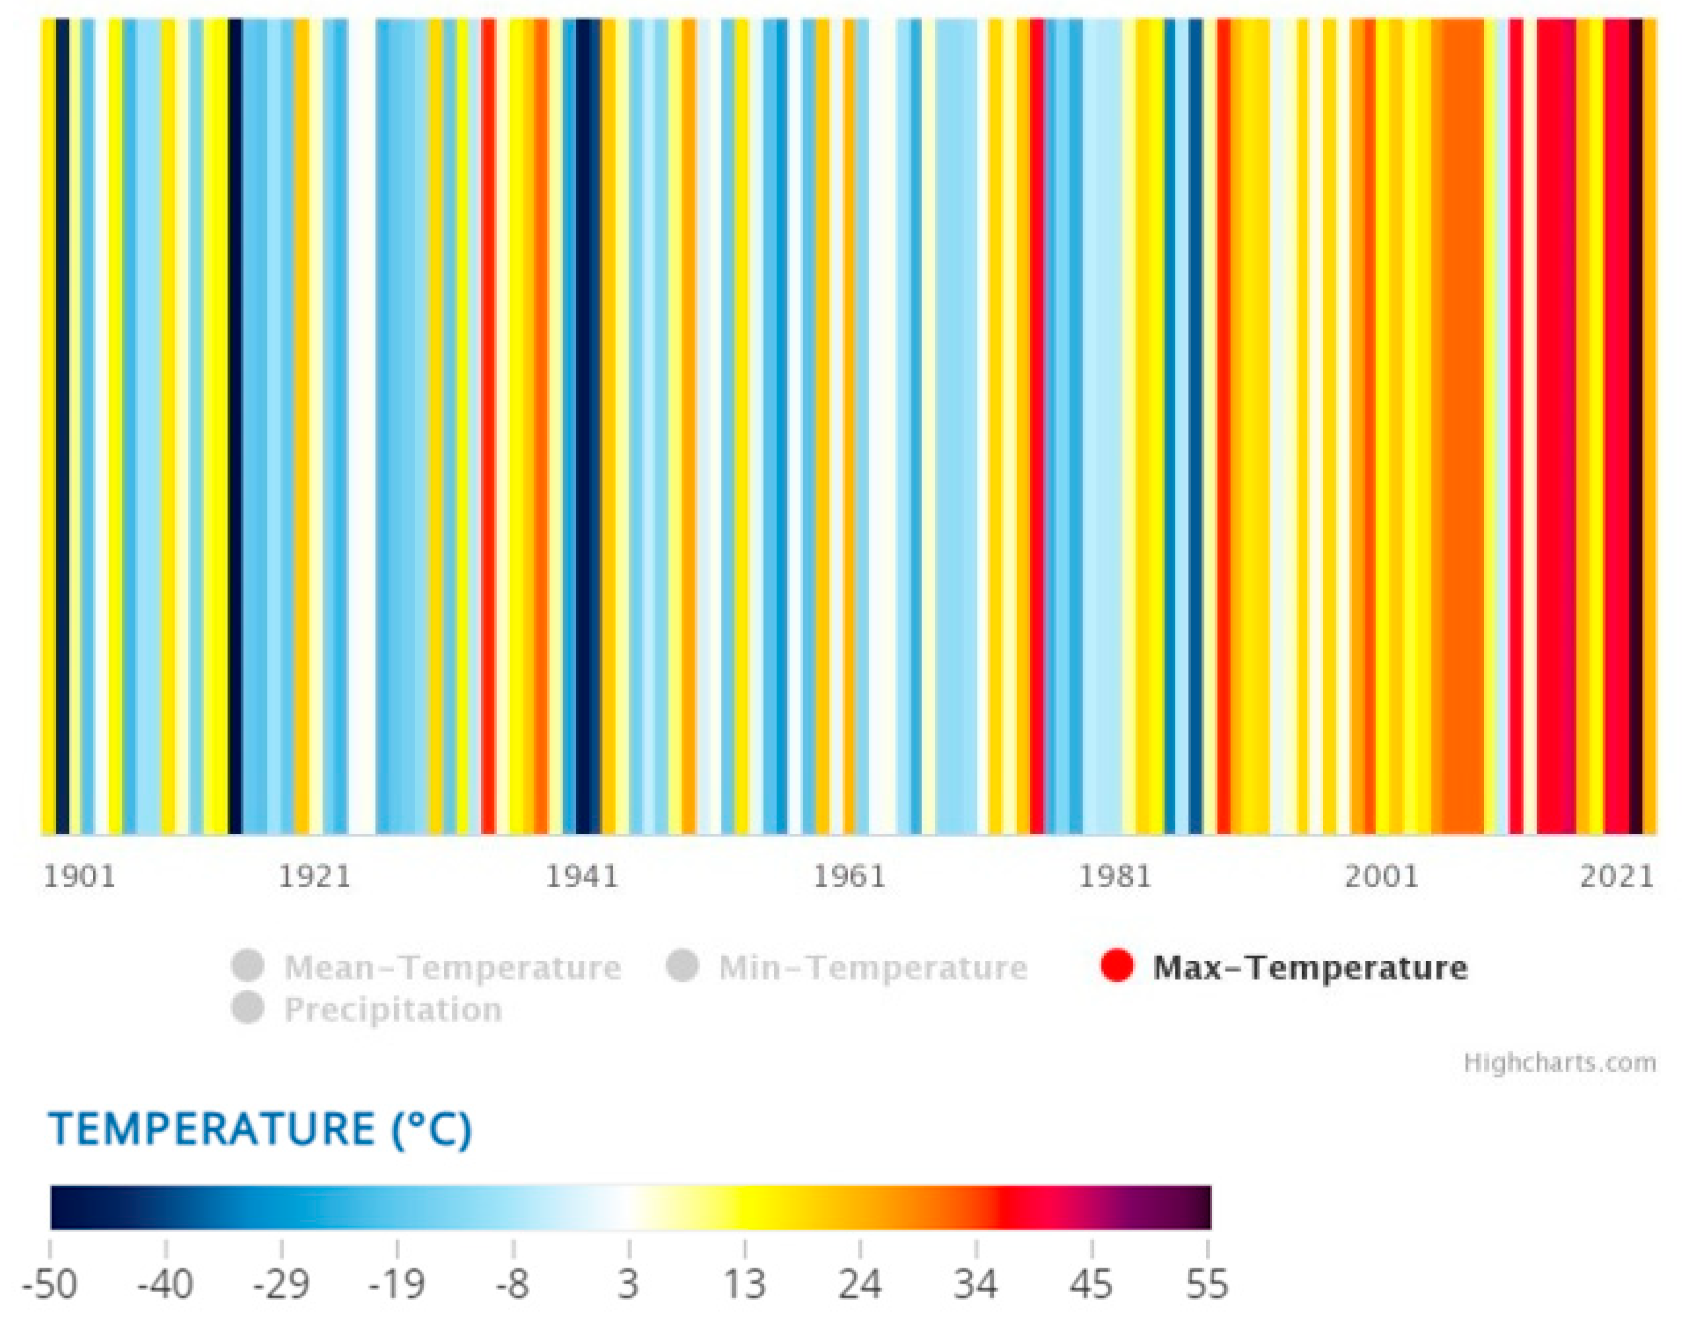
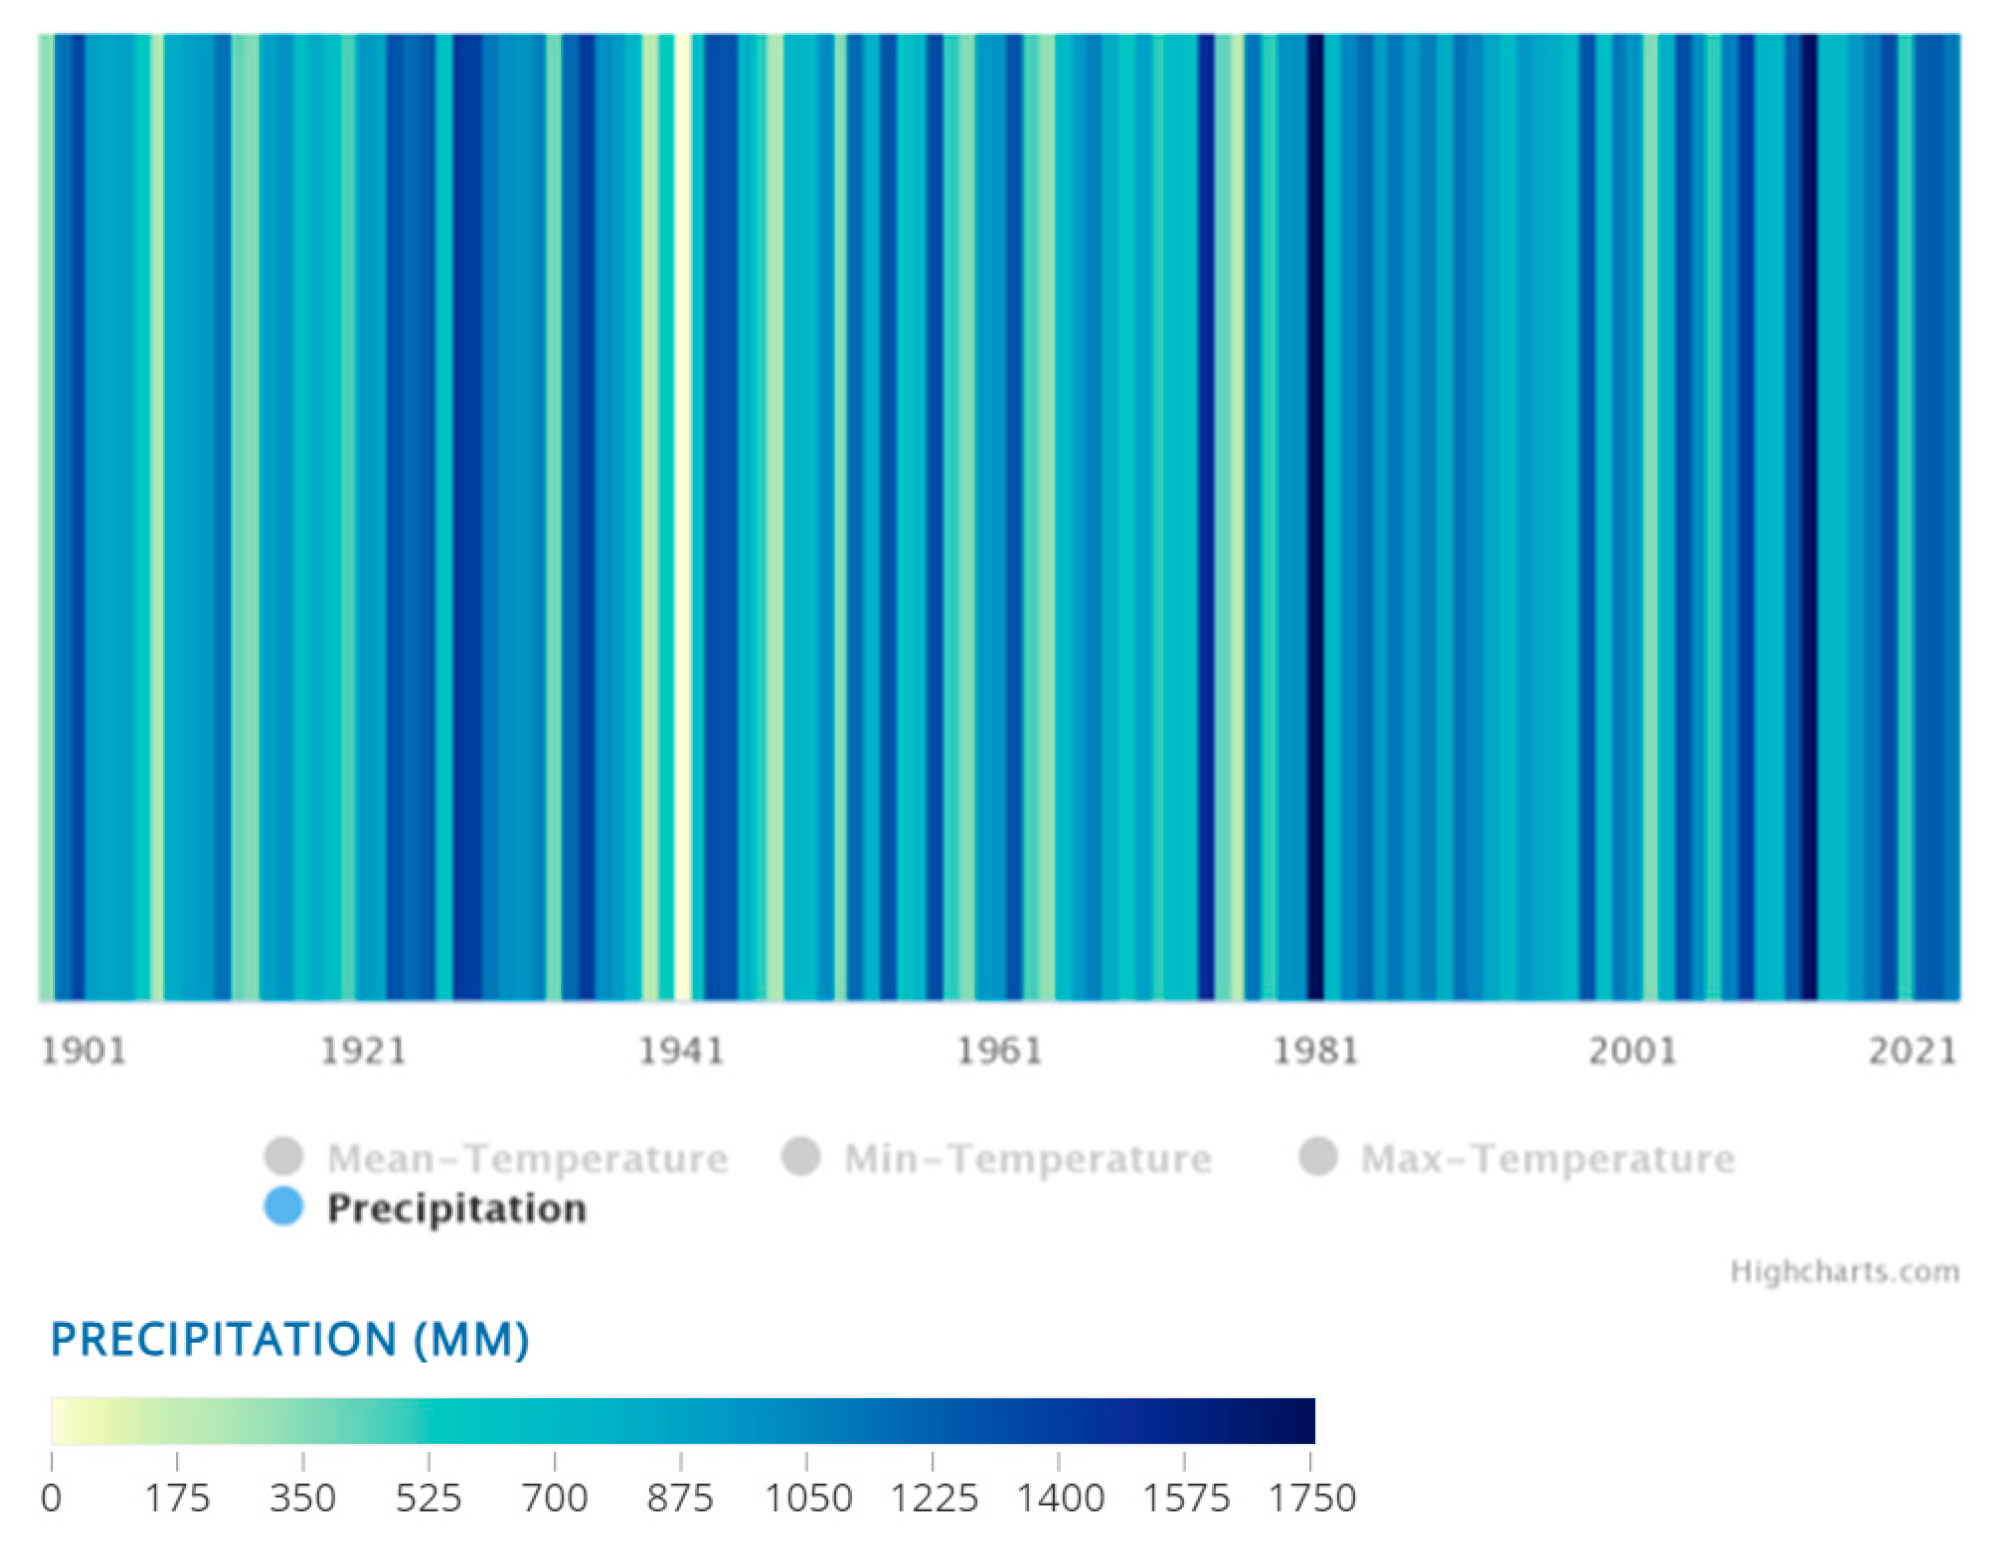
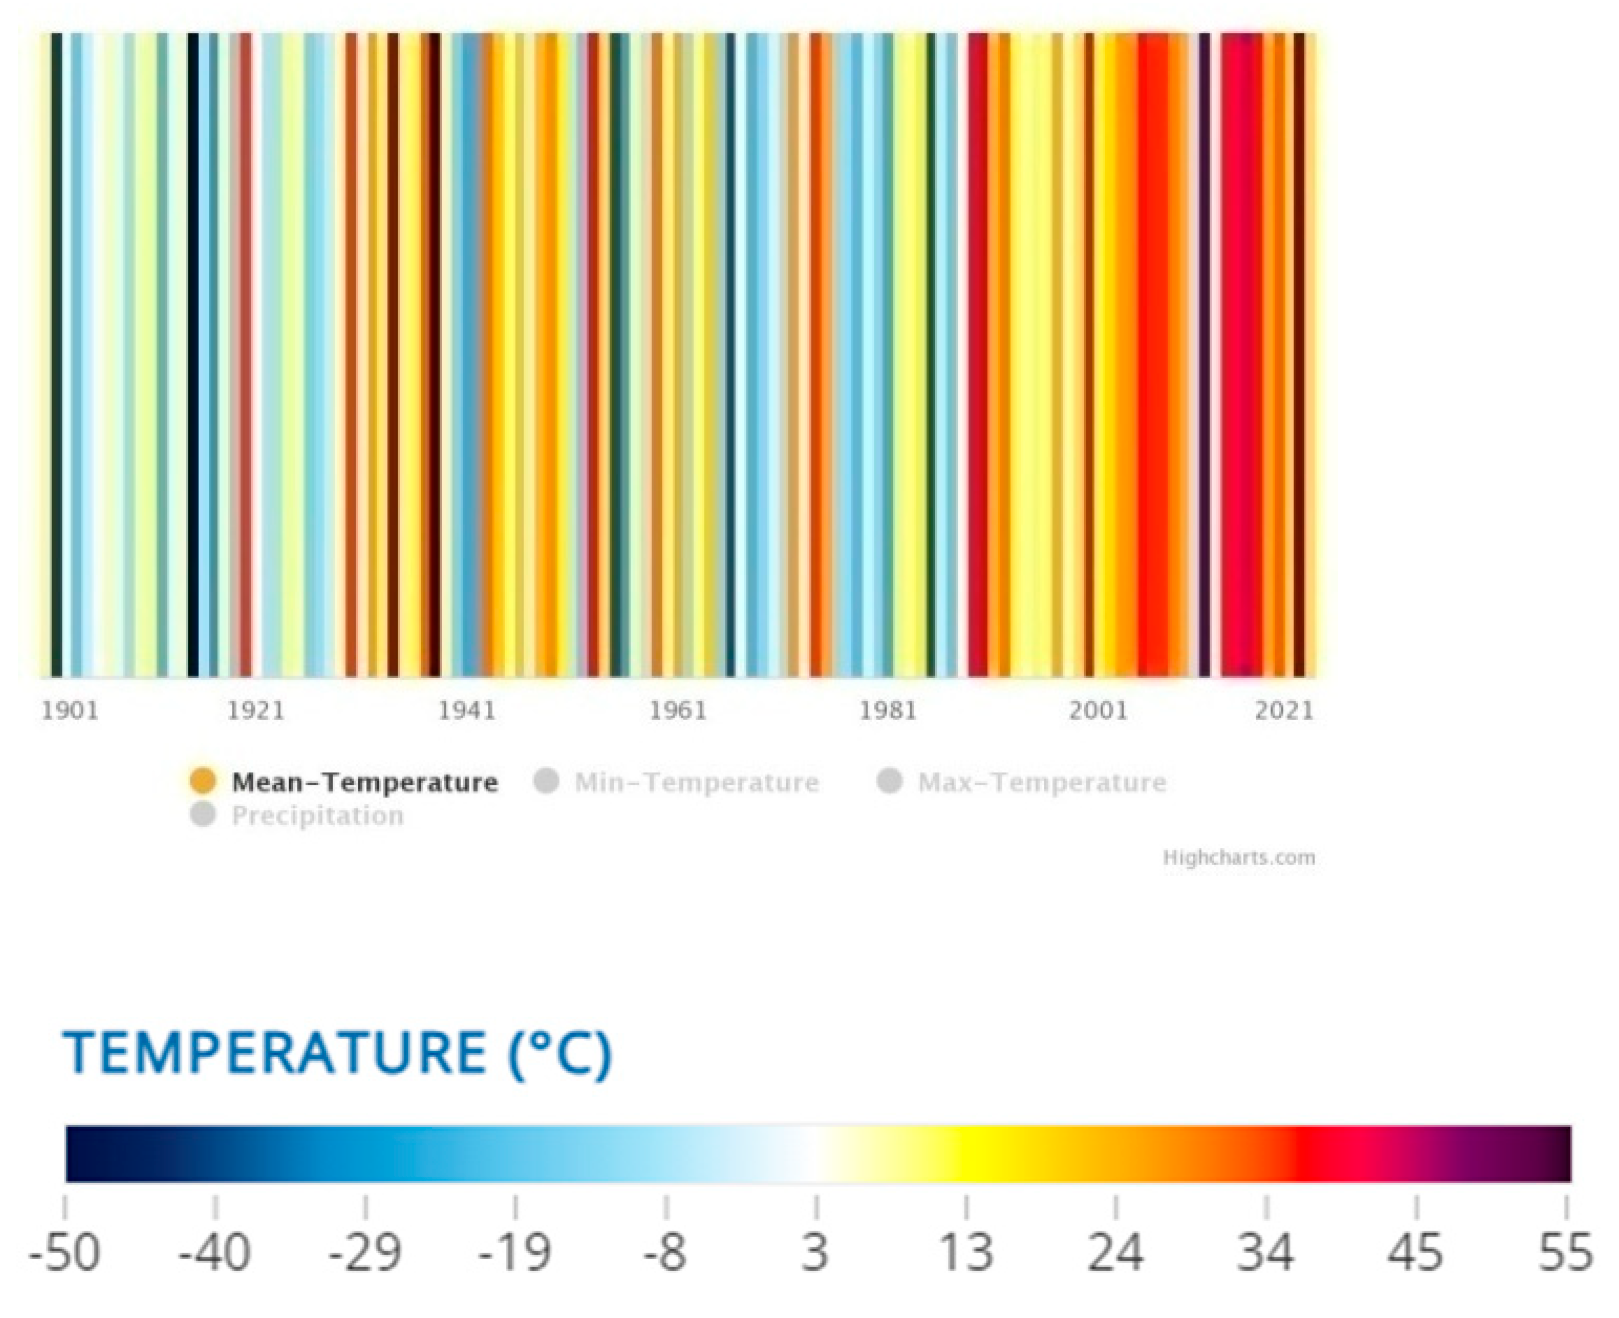
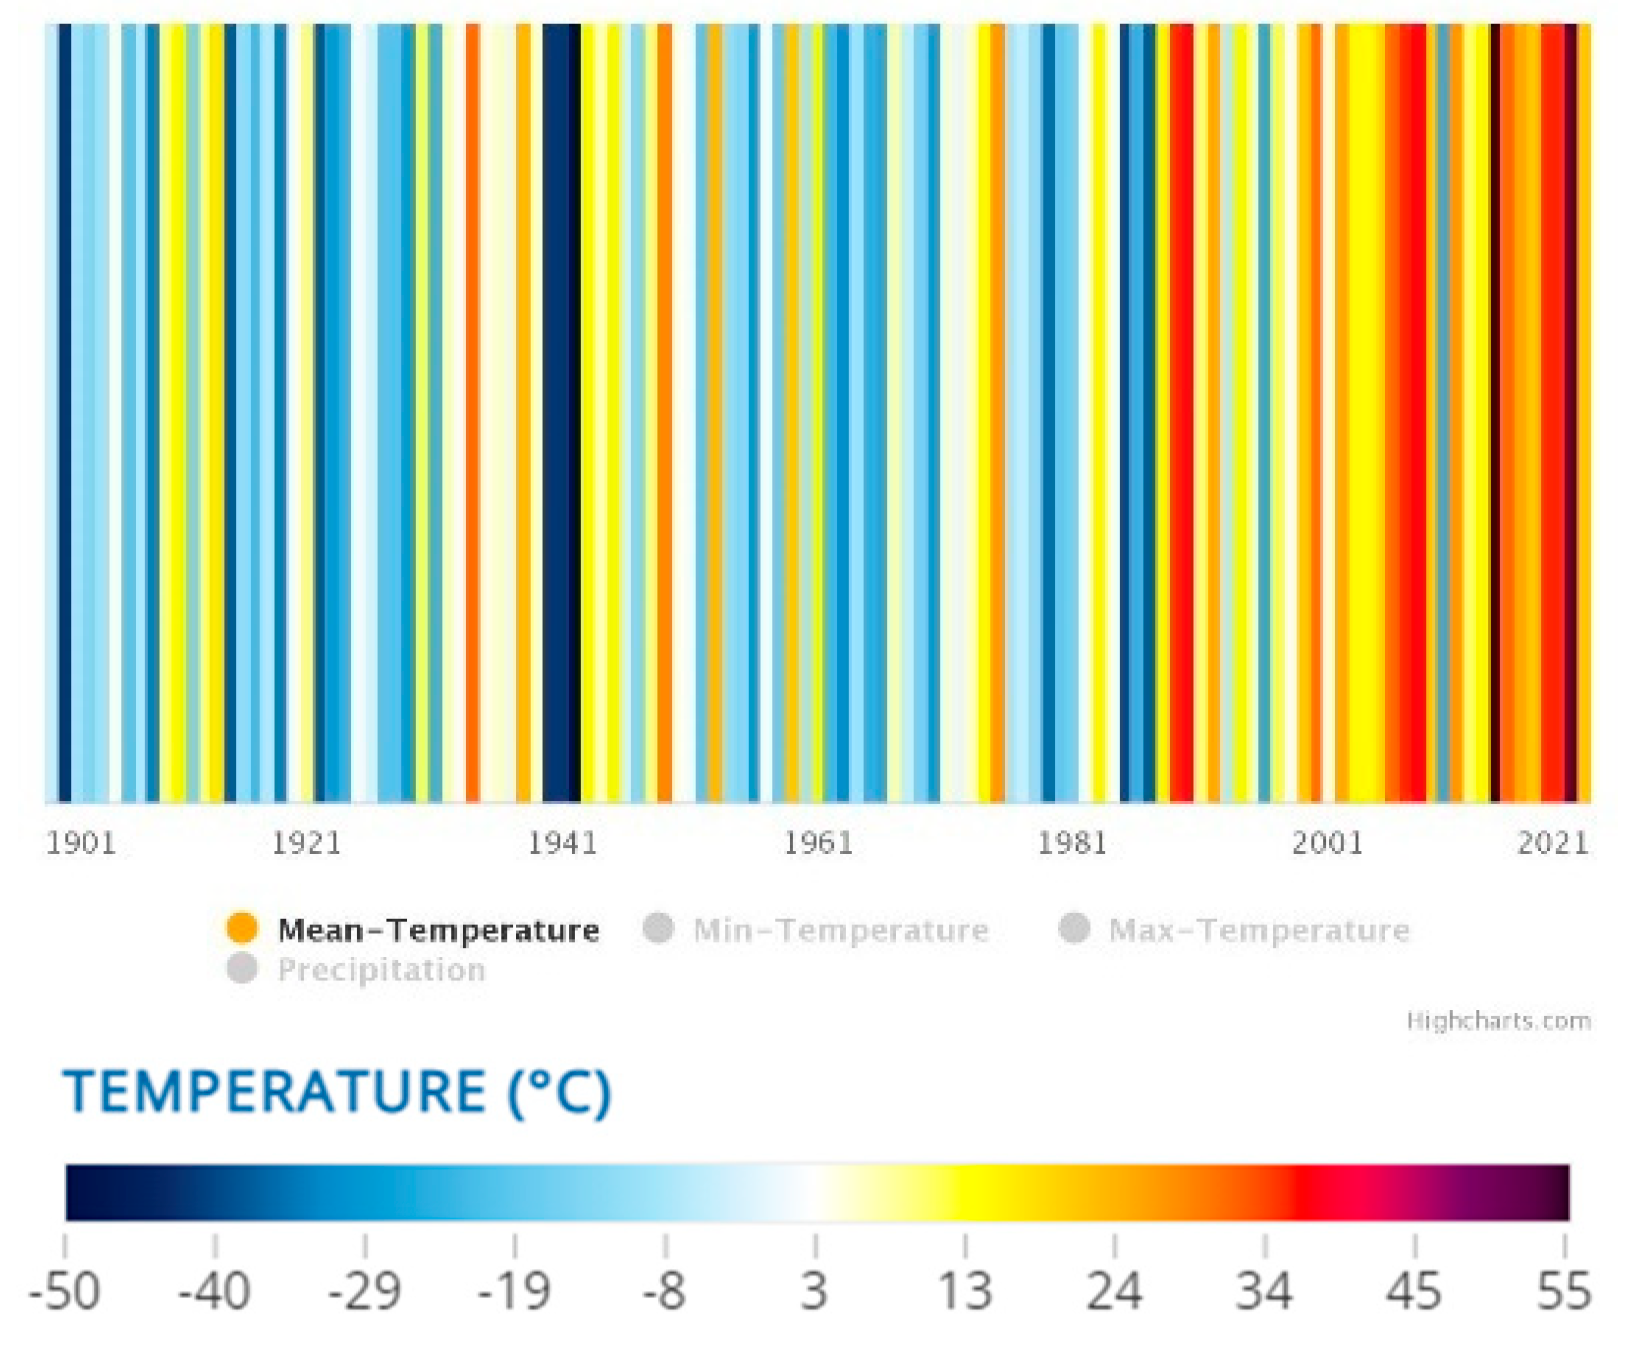
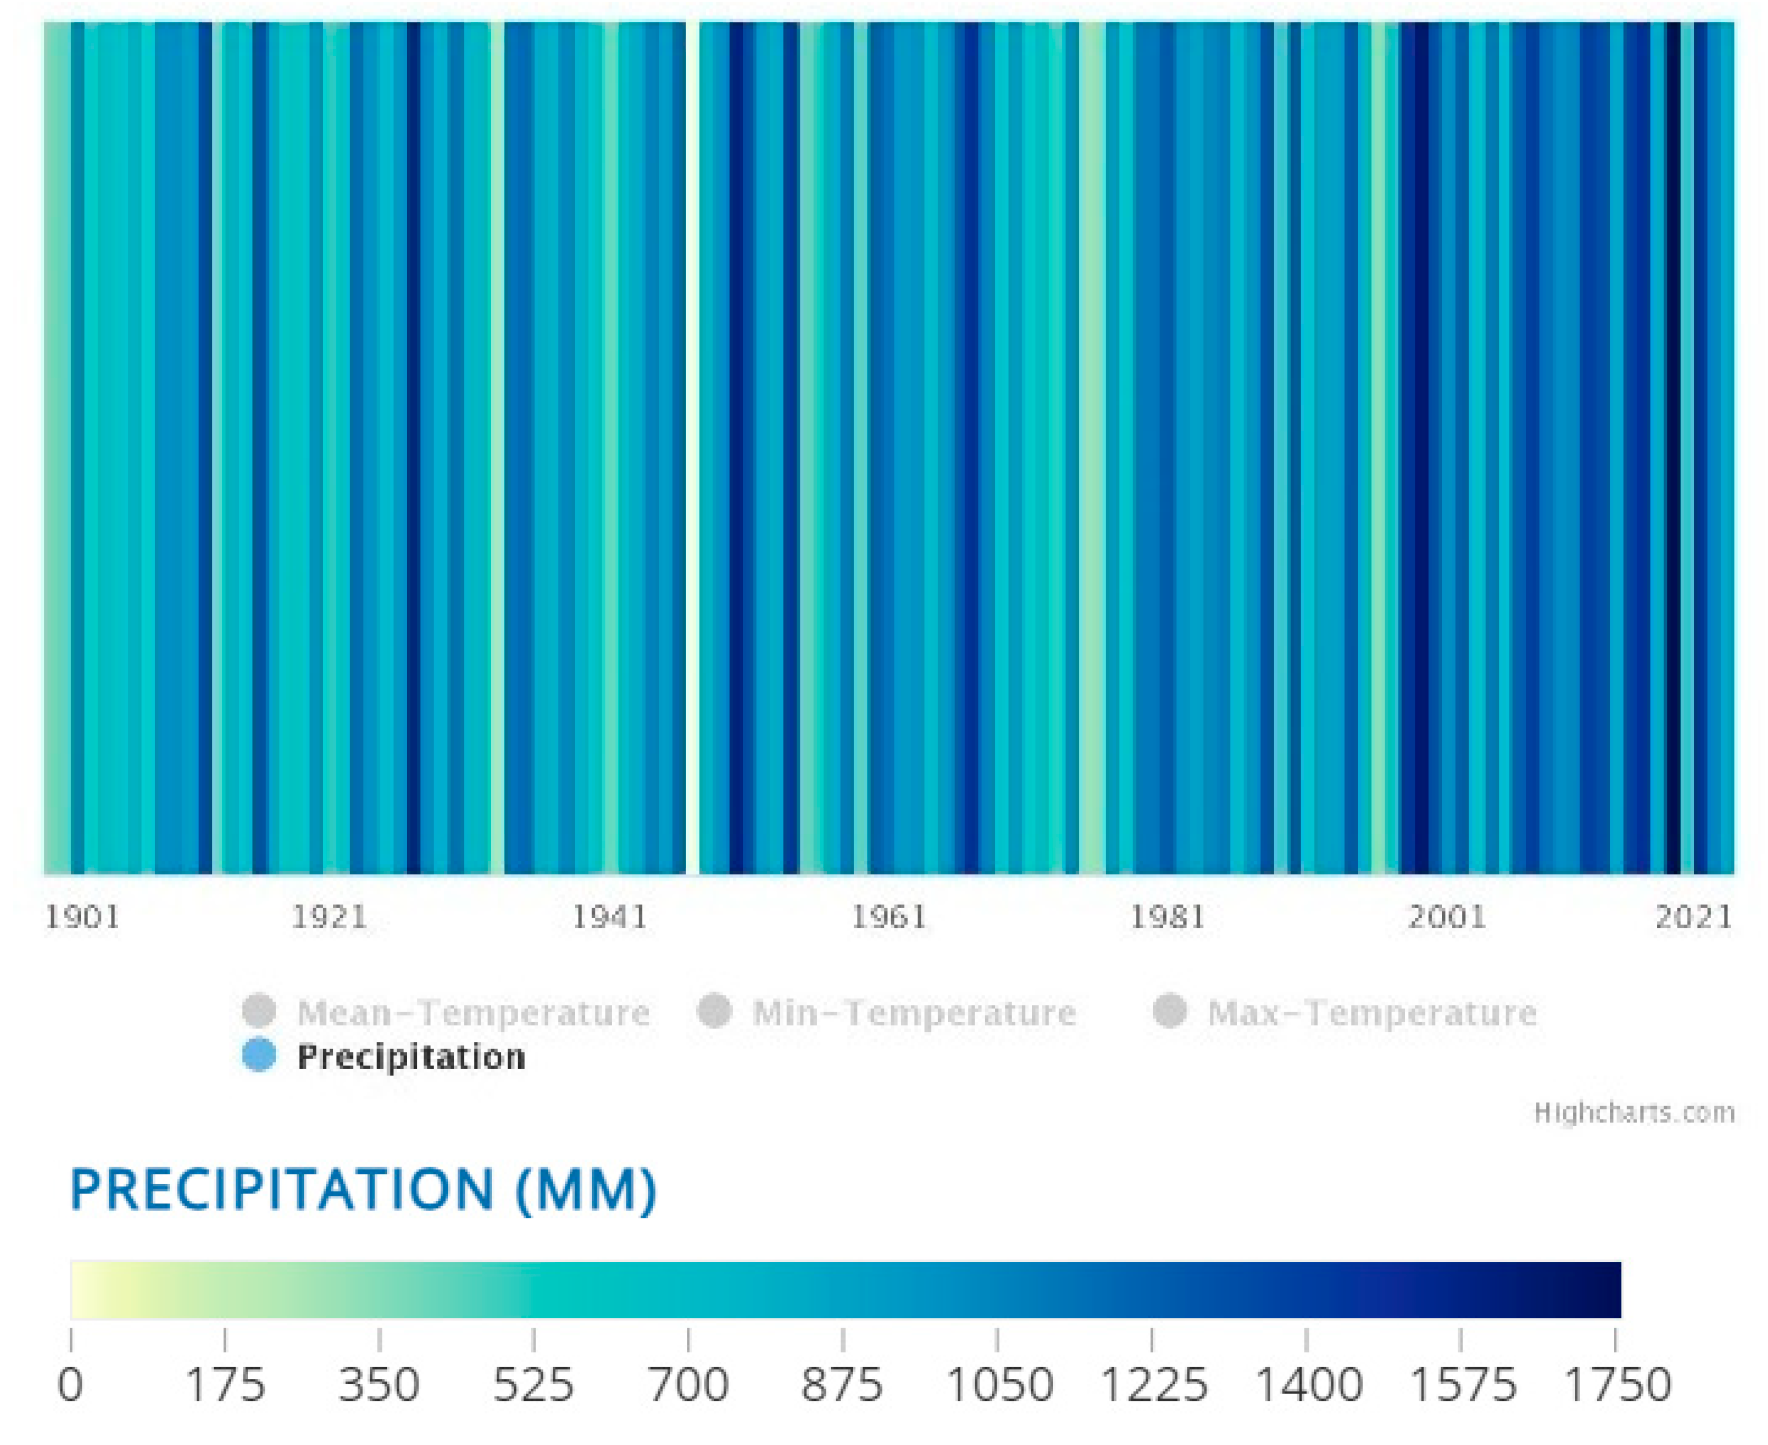
  • In areas where thermal energy production units have been installed, it is observed that their operation contributed to an increase in the average annual and maximum annual temperature of the wider area. This increase appears to be more pronounced when there is more than one thermal power generation unit in the same installation area. Regarding the rainfall, no precise conclusion can be reached because in some areas it seems that their operation has not affected the average amount of precipitation in the annual rainfall and in some others, it seems that over time it has shown a decrease.
  • In areas where hydroelectric energy production units have been installed, it is observed that their operation contributed to the increase in the average height of the annual rainfall of the wider area. At the same time, a small increase in the average annual and maximum annual temperature of the wider installation area is also observed. Of course, this increase could be due to other industrial activities and not to the operation of the hydroelectric plants.
  • No precise conclusion can be drawn for the wind farms because their installation has started in the last decade and no specific and correct conclusions can be drawn about the effects on the microclimate of the area from their installation and operation. What could be expressed is that because for the construction and operation of a wind farm it is necessary to open roads and squares as well as storage areas, this results in the deforestation of trees on the mountain or even an entire slope. Thus, studying the climate data collected for the specific areas, it could be considered that these facilities in turn contribute and to a very small extent to the increase in the temperatures of the local microclimate.
  • For the PV parks, no specific installation was recorded in the above chapters because the parks examined were of very small capacity (<50 MW) and it was also not possible to find climate data at a local level. Nevertheless, in various studies (‘PEC.AN.’) the air temperature differences in the center of a planned photovoltaic plant (power 50 MWp) for the entire duration of 24 h are expected to be negligible and not to exceed 0.25 °C, while the soil temperature in the center of the planned solar park does not change at all. In addition, PV parks require large areas and their installation causes shadows on the natural vegetation, which may lead to an increase in humidity in the local microclimate.
In summary, almost all the climate indicators examined in areas where thermal production units were installed show positive trends towards warmer environmental conditions with an increase in hot days, and in general there are greater impacts on the environment than RES where they are clean technologies and do not produce gaseous pollutants that enhance the greenhouse effect.

Author Contributions

Conceptualization, K.K. and N.M.M.; methodology, K.K., N.M.M. and C.S.P.; validation, K.K., N.M.M., K.P. and C.S.P.; investigation, K.K., N.M.M., K.P. and C.S.P.; resources, K.K., N.M.M. and C.S.P.; writing—original draft preparation, K.K., N.M.M., K.P. and C.S.P.; writing—review and editing, K.K., N.M.M. and C.S.P.; supervision, K.K., N.M.M. and C.S.P. All authors have read and agreed to the published version of the manuscript.

Funding

This research received no external funding.

Institutional Review Board Statement

Not applicable.

Informed Consent Statement

Not applicable.

Data Availability Statement

No data available.

Conflicts of Interest

The authors declare no conflict of interest.

References

  1. Arnell, N.W.; Lowe, J.A.; Challinor, A.J.; Osborn, T.J. Global and Regional Impacts of Climate Change at Different Levels of Global Temperature Increase. Clim. Chang. 2019, 155, 377–391. [Google Scholar] [CrossRef]
  2. Available online: https://unfccc.int/documents/622338?gclid=EAIaIQobChMIvJPI7be5_wIVDQiLCh2eRA-FEAAYAiAAEgIb_PD_BwE (accessed on 1 April 2023).
  3. Wheeler, S.; Zuo, A.; Bjornlund, H. Farmers’ Climate Change Beliefs and Adaptation Strategies for a Water Scarce Future in Australia. Glob. Environ. Chang. 2013, 23, 537–547. [Google Scholar] [CrossRef]
  4. Trnka, M.; Rötter, R.P.; Ruiz-Ramos, M.; Kersebaum, K.C.; Olesen, J.E.; Žalud, Z.; Semenov, M.A. Adverse Weather Conditions for European Wheat Production Will Become More Frequent with Climate Change. Nat. Clim. Chang. 2014, 4, 637–643. [Google Scholar] [CrossRef]
  5. Available online: https://unfccc.int/topics/science/workstreams/cooperation-with-the-ipcc/the-fifth-assessment-report-of-the-ipcc?gclid=EAIaIQobChMI_IGwq7i5_wIVlQCLCh00Nw2REAAYAiAAEgKrr_D_BwE (accessed on 5 March 2023).
  6. Booth, C.A.; Hammond, F.N.; Lamond, J.; Proverbs, D.G. Solutions for Climate Change Challenges in the Built Environment; Innovation in the Built Environment Series; Wiley-Blackwell: Hoboken, NJ, USA, 2012; ISBN 978-1-4051-9507-2. [Google Scholar]
  7. Collins, W.; Colman, R.; Haywood, J.; Manning, M.R.; Mote, P. The Physical Science behind Climate Change. Sci. Am. 2007, 297, 64–73. [Google Scholar] [CrossRef] [PubMed]
Figure 1. Temperature change from 1950 to 2020 according to NASA estimates (2017).
Environsciproc 26 00129 g001
Figure 2. Hanasaari Power Plant—Finland.
Environsciproc 26 00129 g002
Figure 3. Southern Finland station installation area climate data. Observed annual max temperature (1901–2021).
Environsciproc 26 00129 g003
Figure 4. Southern Finland station installation area climate data. Observed annual precipitation (1901–2021).
Environsciproc 26 00129 g004
Figure 5. Markbygden Wind farm—Sweden.
Environsciproc 26 00129 g005
Figure 6. Norrbotten County station installation area climate data. Observed annual max temperature (1901–2021).
Environsciproc 26 00129 g006
Figure 7. Norrbotten County station installation area climate data. Observed annual precipitation (1901–2021).
Environsciproc 26 00129 g007
Figure 8. Rønland Wind Farm—Denmark.
Environsciproc 26 00129 g008
Figure 9. Nordjeland station installation area climate data. Observed annual max temperature (1901–2021).
Environsciproc 26 00129 g009
Figure 10. Nordjeland station installation area climate data. Observed annual precipitation (1901–2021).
Environsciproc 26 00129 g010
Disclaimer/Publisher’s Note: The statements, opinions and data contained in all publications are solely those of the individual author(s) and contributor(s) and not of MDPI and/or the editor(s). MDPI and/or the editor(s) disclaim responsibility for any injury to people or property resulting from any ideas, methods, instructions or products referred to in the content.

