Abstract
The Agricultural Policy Environmental eXtender (APEX) model is used to study how different agricultural practices, such as fertilizing, irrigation, and tillage, would affect water quality and runoff in the Lake Karla watershed (Central Greece). The model was calibrated for the potential evapotranspiration with satisfactory results for the period 1980–2008 and for the yields of the main crops grown in the region (cotton, maize, and wheat) from 1980–2015.
1. Introduction
The challenges that the agricultural sector must deal with are multidimensional and large. On the one hand, the increase in production is intended to cover the nutritional needs of the rapidly growing population. On the other hand, limiting the use of water, fertilizers, and pesticides to protect the sustainability of agroecosystems while protecting the natural environment from problems, such as nutrient losses with nitrogen losses, is often used as a typical example. In recent years, the difficulties created by these challenges have been aggravated by the projected climate change [1,2,3,4]. Scientists apply simulation models to examine all the aforementioned challenges [4]. Simulation models are an approach to represent quantitative knowledge about the system of interest and how the different components of that system interact. Agroecosystem models can help agronomists to understand crop growth, predict crop yields, and assess management for better water and nutrients used. Climate data, soil, and information about the management of the agroecosystem are used to inform these models. Such agroecosystem tools can normally simulate many periods, locations, management styles, and scenarios and can provide useful information to agricultural science and farming, exploring the changing aspects between the atmosphere, plants, soil, and water, assisting in crop agronomy, pest management, plant breeding, natural resources management, and evaluating the effect of climate change [5]. In this article, we present the activities that are currently carried out for an ongoing project where the agricultural policy environmental extender (APEX) model is applied in a rural region in Central Greece to assess crop production and water and nitrogen losses under current and future weather conditions.
2. Methodology
The APEX model has been implemented for the aquifer of the Karla Basin. APEX was developed to help evaluate different land management strategies regarding their environmental impact, erosion, cost, and possible water supplies. APEX simulates the nitrogen and the water process, the crop yield, at the field, farm, or watershed levels, subdividing the simulated area into several units with homogeneous soil, weather, land use, and topography commonly defined subareas [6,7]. The Karla watershed is an area with intense agricultural activity [8]. Figure 1 presents the land uses and crop classification for the Karla aquifer, as displayed within the ArcAPEX interface. After the delineation process, ArcAPEX separated the study area into 34 homogeneous subareas. The model was set to simulate 46 years in total, with the first 10 years used as a spin-up period and not considered in the calibration process. For the calibration, cumulative monthly data from 1961 to 2009 were used for the potential evapotranspiration (PET), while the crop yield of the main crops was calibrated considering the period 1980–2015.
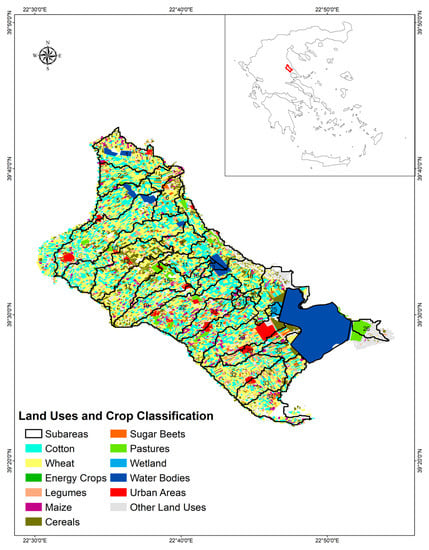
Figure 1.
The study area.
Two statistical criteria were used to evaluate the results obtained for PET. The Nash–Sutcliffe model efficiency (Ef) in Equation (1) and the coefficient of determination (R2) in Equation (2) indicate how well the model describes adaptation in the observed and estimated data:
where is the mean observed value, Ym is the estimated value by the model, and Yo is the observed at time t. Ef ranges from 1 (best result) to minus infinite.
where x and y are the observed and the estimated values by the model, and are the mean observed and estimated values by the model, respectively. R2 ranges from 1 (best result) to 0 (worst result).
3. Results
The APEX model was initially calibrated considering the PET. During the calibration process, four methods for the PET estimation were examined using the Hargreaves approach resulting as the best method. The results for Ef and R2 are presented in Table 1. Figure 2 shows the scatter plot where the observed and simulated values of PET are compared. As reported in Table 1, the model was able to provide a good estimate of PET, resulting in an Ef value of 0.85 and R2 of 0.90.

Table 1.
Statistical Criteria Results.
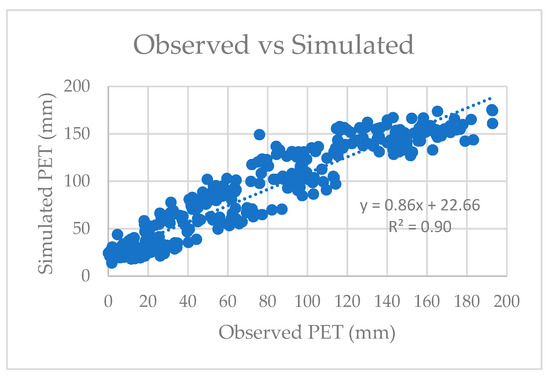
Figure 2.
Comparison of the observed and simulated PET.
The work continued with the calibration of yields of the main crops grown in the study area (cotton, maize, and winter wheat). It is worth noting that the calibration of crop yields was based on the average crop yield of winter wheat, cotton, and maize provided by the Greek Ministry of Rural Development and Food [9]. Due to the fact that APEX reports the yield as dry weight, the reported yield data has been adjusted for moisture content. We considered a moisture content between 6.5% to 8% for cotton [10] and 14% for maize and wheat. After adjusting the average observed crop yield for the moisture content, the target crop yield for calibration was 2.6–3.2 Mg ha−1 for cotton, 8.6–17.2 Mg ha−1 for maize, and 2.0–3.0 Mg ha−1 for wheat. Having only one average reported yield available, it was not possible to conduct a statistical assessment of the performance in simulating crop yield. Figure 3, Figure 4 and Figure 5 show the simulated crop yield for all the simulated years after the calibration process for wheat, cotton, and maize, respectively. The values reported are the average of the yield simulated by the APEX model in all the areas where each crop is cultivated within the watershed.
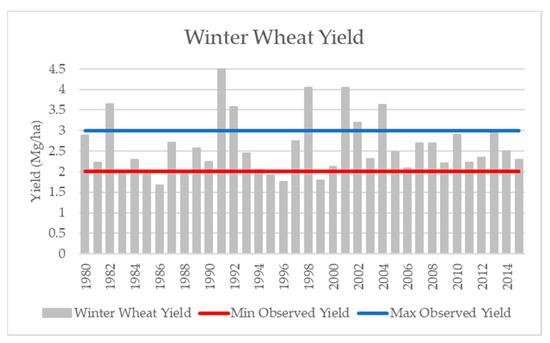
Figure 3.
Simulated wheat yield; minimum and maximum average reported yield.
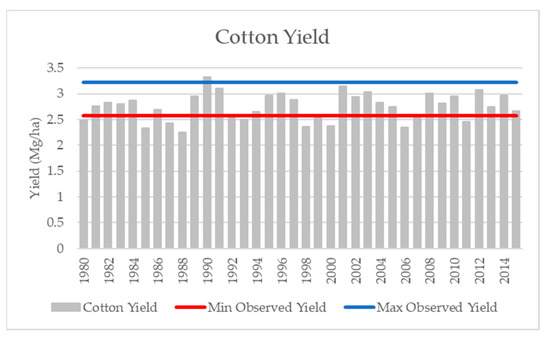
Figure 4.
Simulated cotton yield; minimum and maximum average reported yield.
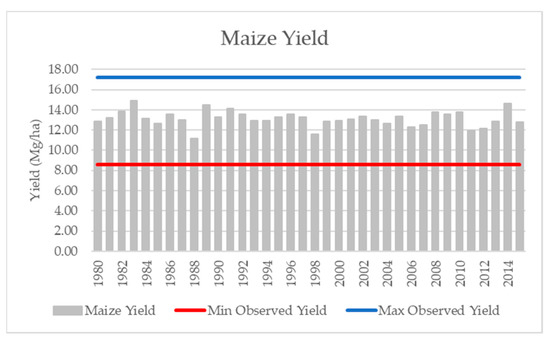
Figure 5.
Simulated maize yield; minimum and maximum average reported yield.
After the calibration process, the model was able to provide good results in simulating crop yield. The average simulated yield for wheat was 2.6 Mg ha−1, which was in the range of the average reported yield. In some years, the yield was overestimated, probably due to an overestimation of the crop-available water that, in turn, produced no water stress and a very high crop yield. We will continue to analyze this aspect to improve the quality of the results for this crop. The average simulated yield for cotton was 2.75 Mg ha−1, which is within the range of the average reported yield with some years where the simulated yield is below the minimum or above the maximum average reported yield. Results for maize were better, with an average simulated yield of 13.1 Mg ha−1 and yielded within the reported range for all examined years.
To calibrate crop yields, parameters that regulate the simulation of soil water content (soil water lower limits and soil evaporation) and the effect of water stress and high temperature on the harvest index were adjusted. Further, the harvest index for maize was revised to consider the higher harvest index of the new maize hybrids, which were obtained thanks to plant breeding and genetic improvement.
The calibration process will be continued considering the runoff and nitrate leaching. In the final step, the APEX model will be used to study the impacts of climate change scenarios on the agroecosystems of the Karla watershed.
4. Discussion
At the beginning of this research, we were able to design the Karla watershed within the APEX model. The first step was based on the automatic delineation of the watershed using the ArcAPEX interface. After this initial step, the input files generated by the interface required some modification to better represent features of the watershed that were not correctly captured by the ArcAPEX interface, such as the presence of a reservoir in the lower part of the watershed. After setting up all the input data required by the model, we started the calibration procedure. Beginning with the calibration of the PET, which we consider as the starting point to have a good simulation of the water balance, we were able to obtain good results with R2 of 0.9 and Ef of 0.85. The good results obtained for the PET are followed by satisfactory results in the simulation of the yields of the three main crops cultivated in the studied area. The APEX model was able to produce reasonable results for maize, cotton, and wheat yields with some overestimation that required analysis for the later harvest. The calibration process will be completed by including the analysis of runoff and nitrate leaching, and the model will be used to assess how climate change will affect crop production and water and nutrient losses.
5. Conclusions
This modeling study will allow us to better understand if the APEX model could be considered a useful tool for studying agroecosystems in Mediterranean climates. Obtaining good results in the calibration and validation process will allow us to use the APEX model to assess the impact of land management and climate change in the Karla watershed.
Author Contributions
Conceptualization, G.A.T.; methodology, G.A.T. and L.D.; modeling activity, G.A.T. and L.D.; climate data analysis J.T.; writing—original draft preparation, G.A.T.; writing—review and editing, L.D.; N.M.; A.L., and N.D.; visualization, G.A.T. and L.D.; supervision N.M., A.L., and N.D. All authors have read and agreed to the published version of the manuscript.
Funding
This research received no external funding.
Institutional Review Board Statement
Not applicable.
Informed Consent Statement
Not applicable.
Data Availability Statement
Not applicable.
Acknowledgments
The important contribution of Konstantina’s Konovesis and Athanasios Lois from the Organization for Payments and Control of Community Aids, Payments and Guarantees (OPEKEPE), as well as Georgia Pappas and Ioannis Chrysiadou from the Ministry of Rural Development and Food for the provision of the crop data of the study area.
Conflicts of Interest
The authors declare no conflict of interest.
References
- Velten, S.; Leventon, J.; Jager, N.; Newig, J. What is sustainable agriculture? A systematic review. Sustainability 2015, 7, 7833–7865. [Google Scholar] [CrossRef]
- Prandecki, K.; Wrzaszcz, W.; Zieliński, M. Environmental and climate challenges to agriculture in Poland in the context of objectives adopted in the European green deal strategy. Sustainability 2021, 13, 10318. [Google Scholar] [CrossRef]
- Jordan, N.; Gutknecht, J.; Bybee-Finley, K.A.; Hunter, M.; Krupnik, T.J.; Pittelkow, C.M.; Prasad, P.V.V.; Snapp, S. To meet grand challenges, agricultural scientists must engage in the politics of constructive collective action. Crop Sci. 2021, 61, 24–31. [Google Scholar] [CrossRef] [PubMed]
- Silva, J.V.; Giller, K.E. Grand challenges for the 21st century: What crop models can and can’t (yet) do. J. Agric. Sci. 2020, 158, 794–805. [Google Scholar] [CrossRef]
- Asseng, S.; Zhu, Y.; Basso, B.; Wilson, T.; Cammarano, D. Simulation Modeling: Applications in cropping systems. In Encyclopedia of Agriculture and Food Systems; Van Alfen, N.K., Ed.; Academic Press: London, UK, 2014; Volume 4, pp. 102–113. [Google Scholar]
- Steglich, E.M.; Osorio, J.; Doro, L.; Jeong, J.; Williams, J.W. Agricultural Policy/Environmental eXtender Model User Manual Version 1501. Blackland Research and Extension Center, Temple. 2018. Available online: https://epicapex.tamu.edu/manuals-and-publications/7 (accessed on 17 February 2023).
- Taylor, R.A.; Jeong, J.; White, M.; Arnold, J.G. Code modernization and modularization of APEX and SWAT watershed simulation models. Int. J. Agric. Biol. Eng. 2015, 8, 81–94. [Google Scholar]
- Sidiropoulos, P.; Tziatzios, G.; Vasiliades, L.; Mylopoulos, N.; Loukas, A. Groundwater nitrate contamination integrated modeling for climate and water resources scenarios: The case of Lake Karla over-exploited aquifer. Water 2019, 11, 1201. [Google Scholar] [CrossRef]
- Tavoularis, K. Average Crop Yields in Greece; Ministry of Agricultural Development and Food Agricultural Policy and Documentation Directorate Department of Agricultural Statistics: Athens, Greece, 2012.
- Available online: https://agresearchmag.ars.usda.gov/ar/archive/2002/may/cotton0502.pdf (accessed on 17 February 2023).
Disclaimer/Publisher’s Note: The statements, opinions and data contained in all publications are solely those of the individual author(s) and contributor(s) and not of MDPI and/or the editor(s). MDPI and/or the editor(s) disclaim responsibility for any injury to people or property resulting from any ideas, methods, instructions or products referred to in the content. |
© 2023 by the authors. Licensee MDPI, Basel, Switzerland. This article is an open access article distributed under the terms and conditions of the Creative Commons Attribution (CC BY) license (https://creativecommons.org/licenses/by/4.0/).