Abstract
Soil erosion affects agricultural and environmental sustainability and needs to be addressed. The Cagayan de Oro River Basin (CDORB), one of the major river basins in the Philippines, provides economic, social, and environmental services to the city and municipalities inside the basin. More than 70% of the area of the river basin is devoted to various forms of agricultural production. Land cover critically influences erosion dynamics as vegetation reduces rainfall impact, enhances infiltration, and limits sediment transport. This study employs the Hydrologic Engineering Center–Hydrologic Modeling System (HEC-HMS) integrated with the Modified Universal Soil Loss Equation (MUSLE) to evaluate soil erosion under different rainfall return periods (5, 10, 25, 50, 100 years) and four land cover scenarios: No Reforestation Intervention (NI), Maximum Forest Cover (MF), Slope-Based Land Use (SB), and Reforestation on Public Domain (PD). Model results showed that soil loss increased with rainfall intensity, with NI yielding the highest average erosion of 1443 t ha−1. Conservation scenarios reduced erosion by up to 53% compared to NI. Among the conservation scenarios, MF, SB, and PD yielded average erosion of 21, 716, and 1304 t ha−1, respectively. While the MF scenario had the least soil loss, no space was assigned for economic production. On the other hand, the SB approach offered the best balance, halving erosion across all rainfall return periods, but at the same time has sufficient space available for economic production. These findings demonstrate the scientific value of integrating HEC-HMS and MUSLE for event-based erosion modeling and highlight how comparing multiple land-cover scenarios can inform data-driven land use planning and policy formulation for sustainable watershed management.
1. Introduction
Soil erosion is one of the Philippines’ worst environmental problems affecting the country’s agricultural and environmental sustainability []. The country’s steep topography, frequent rainfall events, and anthropogenic activities provide the conditions for massive accelerated soil erosion. Approximately 20 million Filipinos live in the upland communities where food insecurity, improper land management practices, and forest denudation exacerbate soil erosion [,]. During the First National Soil Health Summit held in the Philippines in 2023, it was reported that the country is losing 457 M tons of quality soil annually due to erosion []. Recent empirical investigations have also reported significant soil degradation and erosion risks across different land use types, including forested, agroforestry, and watershed areas throughout the Philippines [,].
In 2011, Tropical Storm Washi (local name: Sendong) made landfall over major cities in Northern Mindanao, Philippines. It dealt tremendous damage, causing the displacement of 228,576 people, which represents almost 40% of the total city population. 5801 houses were totally destroyed, and 12,635 were partially damaged, only in Cagayan de Oro City []. According to a study conducted by [], the deposition of soil on the basin caused by the typhoon Washi increased its thickness, ranges from 0.20 m to 1.30 m in various locations. The rainfall intensity of Typhoon Washi was approximated with a rainfall return period of 50-years []. Rainfall intensities play a critical role in understanding soil erosion dynamics in relation to high intensity events because infiltration that exceeds its capacity results to faster surface run-off, resulting in accelerated soil loss [,,]. With climate change expected to increase high rainfall intensity events [], there is a need to understand how different rainfall intensities influence soil erosion on a watershed scale.
The usage of modeling software and processes has been widely used in assessing Land Use Land Cover (LULC) projections, hydrology, and soil erosion of a watershed. Such modeling programs were developed to take advantage of available data such as satellite images, existing soil databases, river discharge sensors, and many more. Programs such as Hydrologic Engineering Center-Hydrologic Modeling System (HEC-HMS) [], Soil Water and Assessment Tool (SWAT) [], Water Erosion Prediction Project (WEPP) [], and other modeling software were applied globally in their application to soil erosion. Recent advances in Earth Observation (EO), open-access geospatial datasets, and cloud computing platforms such as Google Earth Engine (GEE) have transformed erosion modeling and RUSLE parameterization, enabling large-scale, near–real-time analyses using high-resolution satellite and climate data [,,]. These technologies have enhanced the precision, scalability, and reproducibility of soil erosion assessments, reflecting a major trend in modern geospatial environmental modeling. In the Philippines, several studies have been conducted by applying these modeling tools. A study in a watershed in the province of Marinduque used GIS and Revised Universal Soil Loss Equation (RUSLE) to calculate the erosion []. In addition, a similar study was applied in the entire province of Bukidnon using GIS and RUSLE []. Also, the Universal Soil Loss Equation, from which RUSLE and MUSLE (Modified Universal Soil Loss Equation) were derived, was utilized on corn producing areas in Zamboanga, Philippines []. While USLE (Universal Soil Loss Equation) and RUSLE are designed for estimating long-term average soil loss, MUSLE improves on these models by using storm runoff volume and peak discharge instead of rainfall erosivity, allowing it to predict event-based sediment yield []. This makes MUSLE more suitable for studies investigating the effect of rainfall intensity on soil erosion. Several applications of MUSLE worldwide have demonstrated its effectiveness in simulating storm-event soil erosion under varying rainfall conditions [,,,,]. Among these models, HEC-HMS incorporates the MUSLE within its hydrologic framework. In addition, HEC-HMS is a flexible, widely recognized model that has been successfully applied in both data-rich and data-scarce environments [,,,], making it highly suitable for Philippine watersheds where long-term erosion datasets are limited. Its capability to integrate land cover, rainfall intensity, and conservation practices within a single modeling platform provides a stronger basis for evidence-based watershed management compared to using empirical models alone [,]. Despite these advances, no study has yet examined how the interaction of varying land cover scenarios and rainfall return periods influences soil erosion in the Cagayan de Oro River Basin (CDORB). By addressing this gap, the present study advances the understanding of event-based erosion processes in river basins and demonstrates how conservation planning can significantly mitigate erosion risks. The findings provide a scientific basis for improving watershed management policies and guide stakeholders in developing targeted soil conservation and land management strategies.
The CDORB is one of the country’s major river basins, with a total area of more than 137,383.90 hectares. The river basin is of great economic and ecological importance for the people of the area. Swathes of farms and agricultural plantations dominate the basin, which provides livelihood opportunities to thousands of residents. Due to unsustainable land use and illicit logging, the region’s hilly environment and numerous river systems draw a variety of agribusiness enterprises, increasing land consumption and depleting the forest cover []. This study evaluated soil erosion to advance the understanding of its dynamics in the Cagayan de Oro River Basin by integrating land cover, rainfall intensity, and conservation measures within the HEC-HMS. Specifically, the study was conducted to: (1) investigate how different land cover and rainfall scenarios influence soil erosion processes at the watershed scale, (2) evaluate the role of conservation initiatives in mitigating erosion, and (3) compare the relative effectiveness of three conservation strategies to provide evidence-based insights for sustainable watershed management. By quantifying soil erosion under different rainfall intensities and land cover scenarios, this study will help identify erosion-prone subbasins and critical source areas where conservation interventions should be prioritized. The comparison of conservation strategies will provide evidence for selecting the most cost-effective and impactful measures, such as reforestation, contour farming, or buffer strips, under varying climatic conditions. These insights can directly inform watershed zoning, land use planning, and climate adaptation policies for the Cagayan de Oro River Basin, supporting decision-makers in implementing targeted and science-based management actions.
2. Materials and Methods
2.1. Study Area
The CDORB is one of the major river basins in the Philippines. It provides economic, social, and environmental services to the city and municipalities inside the basin. More than 70% of the river basin is devoted to various forms of agricultural production such as sugarcane, coconut, pineapple, and banana plantations, cereals (rice, corn, sorghum), orchards, and tree plantations. Farms consist of various sizes, from smallholder farms, corporate farms, and slash-and-burn plots []. They also include pasture areas for livestock production. CDORB lies between 124°0′39″ and 125°21′39″ Latitude and 7°32′20″ and 8°56′39″ Longitude. The climate description of the Philippine Atmospheric, Geophysical and Astronomical Services Administration (PAGASA) is considered Type III (short dry seasons and longer wet season), with mean annual rainfall ranging from ~2000 to 2500 mm yr−1 []. Rainfall is strongly seasonal, with most precipitation occurring from May to October during the southwest monsoon, and extreme rainfall events associated with tropical cyclones (e.g., Tropical Storm Washi in 2011). Much of the basin lies within upland Bukidnon, where steep slopes (>18%) and rugged terrain intensify runoff and sediment yield. The municipalities inside the basin are: Baungon, Libona, and Talakag in Bukidnon, Cagayan de Oro City in Misamis Oriental, and a small portion of Iligan City (Figure 1).
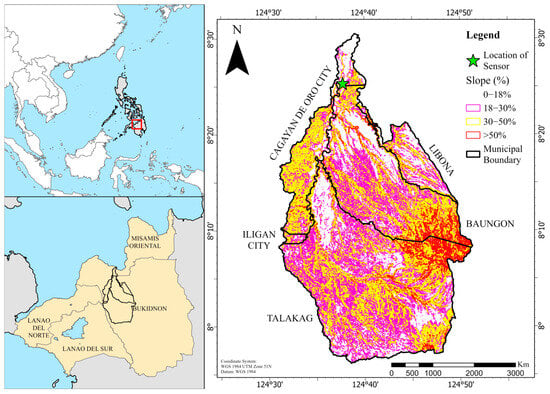
Figure 1.
The outlined location of the CDORB and the map of the Philippines (inset) indicating the CDORB.
The highest elevation within the CDORB can be found at the peaks of Mt. Kalatungan and Mt. Kitanglad at 2824 masl and 2899 masl, respectively. The steep slopes are predominant in the upland area in the south and southeastern portion of the basin, where the majority of the river’s headwaters are located. They can also be found in the ridges of sub-basins, where they serve as topographic divides between sub-catchments. Gentler slopes prevail along the coast and on the flat portions of several elevated terraces around the basin.
2.2. Data Inputs for the Model
The soil erosion model was generated using HEC-HMS (version 4.10). Hourly precipitation data were obtained from the Satellite Rainfall Monitoring of the Department of Science and Technology–Philippine Institute of Volcanology and Seismology (DOST–PHIVOLCS) [], while discharge data were derived from a locally developed monitoring sensor deployed under an institutional research initiative and later turned over to the Department of Environment and Natural Resources (DENR)–Cagayan de Oro. For the determination of total suspended solids (TSS), water samples were collected at the watershed’s discharge point, where the river discharge sensor was also installed. Sampling was conducted 30–50 cm below the water surface, targeting areas with higher flow velocity to ensure uniform distribution of suspended particles. Samples were collected hourly for a total of 48 h. Each 200–500 mL water sample was filtered using pre-weighed filter paper, oven-dried at 105 °C overnight, and then placed in a desiccator to cool to room temperature before weighing on an analytical balance. TSS concentrations were determined based on the recorded weights. Finally, the soil erosion model used in this study was MUSLE, which is also embedded in the HEC-HMS software.
The HEC-HMS was used for simulating runoff models based on a combination of the SCS-CN (Soil Conservation Service-Curve Number) model. The SCS-CN model is described as:
where Pe = accumulated precipitation excess at time t; P = accumulated rainfall depth at time t; Ia = the initial abstraction (initial loss); and S = potential maximum retention, a measure of the ability of a watershed to abstract and retain storm precipitation. The model estimates precipitation excess as a function of cumulative precipitation, soil cover, land use, and antecedent moisture [].
The transform method used in the study was the Clark Unit Hydrograph. It is a synthetic unit hydrograph method where precipitation was transformed into a translation hydrograph. The parameters used for this model were time of concentration and storage coefficient. Time of concentration was described as the amount of time of water to flow from one location to another within the watershed. The storage coefficient accounts for the storage effects []. The recession baseflow method was used to estimate the normal pattern of flow in a watershed when the flow in the channel recedes exponentially after a rainfall event. The parameters used in this method were the recession constant and the ratio to peak constant, where it varies from 0 to 1. As for the routing method, Muskingum–Cunge was applied in this study. This method assumes the initial inflow is equal to the initial outflow of the channels. The channels’ geometry and Manning’s roughness coefficient are the main parameters required in the application of the Muskingum–Cunge method.
2.2.1. HEC-HMS Model-MUSLE
The MUSLE, or Modified Universal Soil Loss Equation [], is a mathematical model derived and modified from the original Universal Soil Loss Equation (USLE) to calculate soil erosion. Land use, topography, soil erodibility, and climate conditions were factors to estimate the amount of erosion in a certain area. The difference between MUSLE and USLE was that MUSLE uses surface runoff, which was derived from the hydrological modeling, instead of precipitation, and other components of the original formula remained the same []. The equation of MUSLE is explained below:
where Sed is the Sediment Yield per event (metric tons), Qsurf is Surface Runoff Volume (m3), and qpeak is Peak Runoff Rate (m3/s). K is the Soil Erodibility Factor, LS is the Topographic Factor (slope length and steepness factor), C is the Cover and Management Factor, P is the Erosion Control Practices.
2.2.2. LS Factor
LS stands for the topographic factor, which considers the slope length and steepness. It accounts for the effect of the landscape on erosion, with steeper slopes and longer flow paths generally leading to higher erosion rates. In this study, Interferometric Synthetic Aperture Radar-Digital Elevation Model (IFSAR-DEM) with a resolution of 5 m × 5 m was used to determine the LS Factor and was processed in ArcGIS. The IFSAR-DEM was obtained from the Department of Environment and Natural Resources–National Mapping and Resource Information Authority (DENR–NAMRIA) as part of its national topographic mapping program []. The raw data were processed to be depressionless, and the slope and flow accumulation values (derived using the D8 algorithm in the ArcGIS Flow Accumulation tool) obtained from the processed DEM were used within the GIS raster calculator to compute the LS using the following equation:
where FA is the flow accumulation, α is the slope gradient in degrees, and cellsize is the DEM resolution. This MUSLE Equation has commonly been used in modeling applications to calculate LS, with favorable results. This equation was adapted from a nearby watershed in Bukidnon, Philippines [].
2.2.3. K Factor
K is the soil erodibility factor, which quantifies the susceptibility of the soil to erosion. It is usually regarded as the amount of soil loss per unit erosive force []. It accounts for factors such as soil texture, organic matter content, and structure. Due to limited data on soil physical and chemical properties and the limited resources to generate those data, a texture-based estimation approach was used to derive the K-factor (Table 1). This method, though simplified, has been widely applied in data-limited basins to represent spatial variability in soil erodibility. More comprehensive approaches, such as those incorporated in USLE-K, RUSLE2-K, EPIC-K, and Dg-K algorithms [], require input variables that were unavailable for the present study. Soil texture data collected across the watershed (Figure 2) were interpolated using ordinary kriging to produce a continuous soil texture map, which has been widely applied in soil property mapping studies [,]. The locally derived interpolation captures site-specific variability more accurately than global datasets like SoilGrids, which often generalize local heterogeneity. A total of 35 soil sampling points were used for kriging interpolation, providing adequate spatial coverage; however, minor uncertainty may still result from variations in sample spacing and terrain complexity. Although a kriging variance map was not produced due to data and processing limitations, the interpolation was designed to capture local spatial variability effectively.

Table 1.
K Factor values used for the simulation of soil erosion in the CDORB.
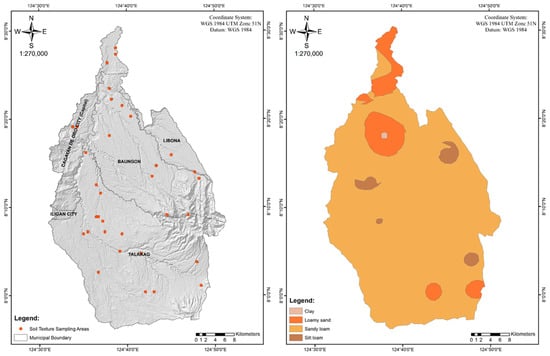
Figure 2.
Sampling sites for attaining soil texture in CDORB and the soil texture map.
2.2.4. C Factor
C represents the cover and management factor, which considers the land cover and land use practices in the area. It evaluates the impact of factors like vegetation cover, crop management, and conservation practices on erosion. The 2022 Land Cover map of the watershed was used to determine the C Factor. The C-factor values used in the study were derived from other studies within the Philippines and outside the country (Table 2). Since HEC-HMS uses a subwatershed approach for the MUSLE method, the dominant land cover for each subwatershed was applied in this study.
Table 2.
Land cover classes and its equivalent C factor.
2.2.5. P Factor
The P factor, also known as the support practice factor, reflects the effectiveness of soil conservation measures and erosion control practices implemented in the area. This factor accounts for the effectiveness of soil conservation practices and measures implemented to control erosion. The value of the P-factor ranges from 0 to 1, where values closer to 0 indicate good conservation practices while values approaching 1 indicate poor to no erosion control practices []. For this study, there were no supporting documents or published studies stating that any conservation measures were applied within the CDORB, though some may have been applied in different areas, but could not be determined spatially. A similar approach was adopted by [] in a neighboring watershed of Bukidnon province using RUSLE, where insufficient information on conservation practices also led to the assignment of a P-factor value of 1. Accordingly, a value of 1 for P-factor was implemented throughout the watershed.
2.2.6. Other Parameters for MUSLE
The threshold factor that was applied in this study was 1 m3/s. A threshold factor is that the peak flow, less than the erosion threshold, will result in no erosion. If peak flow is greater than the erosion threshold, then there will be erosion. The exponent is used to spread sediment laid throughout a time-series sedigraph, which was 0.5 in this study. The gradation curve is the distribution of the soil into grain classes or the soil particle size distribution in a given watershed.
The technique for determining the streamflow sediment carrying capacity for non-cohesive sediments depends on the watershed’s transport potential. The method that was used was the Wilcock and Crow method []. In addition, the fall velocity method used in this study was van Rijn method [] where the fall velocity method calculates the time required and settling distance of the deposition of sediment in a watershed. As for sediment routing, the volume ratio method was utilized in this study. The volume ratio method links sediment transport to flow transport in the reach using a conceptual approach. These procedures were adapted from the framework described in [], which was applied to watershed-scale sediment modeling.
2.2.7. Model Evaluation Statistics
In order to assess the overall model, the performance indicators described in [] were applied in this study using the following statistics: Root Mean Squared Error Ratio (RSR), Nash Sutcliffe Equation (NSE), Percent Bias (PBIAS), and Coefficient of Determination (R2). Root mean square error ratio (RSR) is a metric that assesses the relative error of a model’s predictions compared to the observed data. It is used to account for the magnitude of errors in relation to the magnitude of the observed data. RSR values range from 0 to ∞, with lower values indicating better model performance. The NSE is a widely used metric for assessing the goodness-of-fit of a hydrological model. It measures the relative magnitude of the residual variance compared to the observed data variance. NSE values range from −∞ to 1, where 1 indicates a perfect match between model predictions and observations, and values close to 0 or negative values indicate poor model performance. PBIAS is a measure of the average percentage difference between the model’s predictions and the observed data. It provides information about the overall bias (underestimation or overestimation) of the model. R2 is a statistical metric that quantifies the proportion of the variance in the observed data explained by the model. It ranges from 0 to 1, with 1 indicating that the model explains all the variance in the data, and lower values indicating less explanatory power. R2 was computed directly by the HEC-HMS model software from the linear relationship between observed and simulated values.
In this study, calibration was conducted by manually adjusting model parameters to approximate the catchment’s physical characteristics and match simulated soil erosion outputs with observed data. This approach was adopted due to the limited availability of long-term soil erosion records, which prevented the application of independent validation. While only calibration was performed, Table 1 shows the quantitative goodness of fit results, which yielded an acceptable statistical fit when compared to observed data. The description of the performance rating was obtained from []. Table 3 below shows that the soil erosion model has an overall good evaluation in assessing soil erosion in the CDORB.
Table 3.
Performance ratings using NSE—Nash Sutcliffe Equation, R2—Coefficient of Determination, PBIAS—Percent Bias, RSR—Root mean square error ratio for the simulated soil erosion inside CDORB.
Following the calibration process, the single calibrated model was applied to simulate and compare soil erosion under scenarios representing NO conservation initiatives and WITH conservation initiatives across different land cover and rainfall conditions. The following rainfall and land cover scenarios are mentioned below in detail (Figure 3).
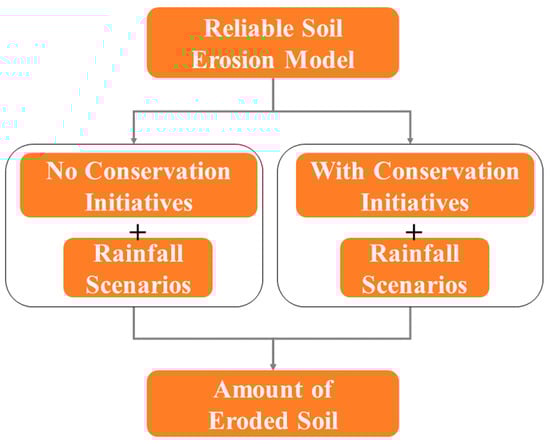
Figure 3.
Process flow of the study.
2.3. Rainfall Return Period Scenarios
The model requires meteorological data that includes precipitation data. In this study, Rainfall Intensity Duration Frequency (RIDF) was used for the flood simulations and is based on data from PAGASA. The rainfall intensity duration frequency (RIDF) curves are graphical representations of the probability that a given average rainfall intensity will occur within a given period []. The RIDF developed by PAGASA for the Cagayan de Oro synoptic station is based on approximately 54 years of quality-controlled rainfall records, representing the full available dataset for the area. Rainfall Return Periods of 5, 10, 25, 50 and 100 years were applied.
2.4. Land Cover Scenarios
Several land cover scenarios were applied using GIS to achieve various soil erosion scenarios. These land cover scenarios were: No Intervention and With Intervention (Maximum Forest Cover, Slope-Based Land Use, and Reforestation on Public Domain). Each of these land cover scenarios was described in Figure 4 and Table 4.
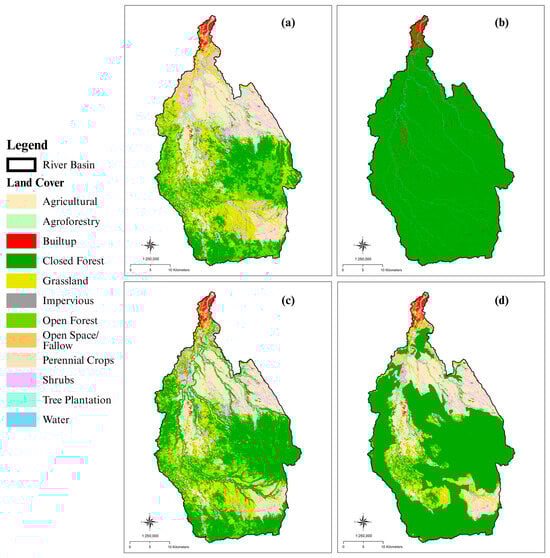
Figure 4.
CDORB land cover scenarios: (a) No Reforestation Intervention; (b) Maximum Forest Cover; (c) Slope-Based Land use approach; (d) Reforestation on Public Domain.
Table 4.
Land cover classes and its corresponding area (ha) of the different land cover scenarios.
2.4.1. Without Conservation Initiatives (No Reforestation Intervention or Business as Usual Land Cover)
This is a land cover scenario where it is a business-as-usual approach. No Reforestation Intervention (NI) land cover scenario assumes that there is no attempt to reforest and protect the watershed. For this scenario, the 2022 land use/land cover (LULC) map of the Cagayan de Oro River Basin was utilized, as it provides the most recent spatial representation of land cover conditions and accurately reflects the current land use conditions in the watershed. The 2022 LULC map was generated from Sentinel-2 Level-2A imagery with a spatial resolution of 10 m, obtained from the Copernicus Data Space Ecosystem of the European Space Agency (ESA) []. A supervised classification using the Maximum Likelihood Algorithm (MLA) was conducted in ArcGIS 10.8. The land cover classes were defined based on locally adapted land cover categories commonly used in Philippine land cover studies [,,] and government land cover maps (e.g., NAMRIA). Twelve classes were identified: agricultural areas, agroforestry, built-up areas, closed forest, open forest, grassland, shrubland, tree plantations, perennial crops, impervious surfaces, open space/fallow areas, and water bodies. The classification accuracy was evaluated using a confusion matrix derived from randomly distributed validation points verified through field observations across the study area. The assessment yielded an overall accuracy of 78.22% and a Kappa coefficient of 0.7620.
2.4.2. With Conservation Initiatives (Maximum Forest Cover, Slope-Based Land Use Approach and Reforestation on Public Domain)
Reforestation on Public Domain (PD)—This is a land cover scenario where the rainforestation extends to the timberland area and the river easements. This was achieved by changing the initial 2022 land cover to closed forest in all public domain lands classified by the Philippine government.
Maximum Forest Cover (MF)—For this land cover scenario, all the areas of the watershed are vegetated with close canopy forest except for built-up areas and bodies of water.
Slope-Based Land Use approach (SB)—The slope determines the kind of land use. Built-up and Agriculture were assigned to 0–18% slope, Agroforestry to 18–30% slope, Production Forest to 30–50% slope and Protection Forest to >50% slope.
During the simulation of the land cover scenarios, the CN and C-Factor for MUSLE were modified according to their respective land cover scenarios, while the basin characteristics and other MUSLE parameters, such as LS, K, and P factor, remained constant.
3. Results
Erosion Modeling on Different Land Cover and Rainfall Scenarios
The HEC-HMS software was utilized in this study using the embedded MUSLE model to calculate the amount of soil erosion in CDORB at various land cover and rainfall scenarios. Total soil erosion varied substantially across land cover scenarios and rainfall return periods (Table 5). The No Reforestation Intervention (NI) scenario yielded the highest soil loss, with values rising from 648 ton/ha at the 5-year return period to 2290 ton/ha at the 100-year event. In contrast, the Maximum Forest Cover (MF) scenario produced minimal erosion (<40 ton/ha across all return periods), reflecting the strong protective effect of dense forest cover. The Slope-Based land use approach (SB) and Reforestation on Public Domain (PD) scenarios showed intermediate responses, with erosion levels generally lower under SB than PD.
Table 5.
Total amount of soil erosion (ton/ha) from erosion modeling of the different Rainfall Return Period Scenarios (5, 10, 25, 50, 100 year) and different Land cover Scenarios (No Reforestation Intervention—NI, Maximum Forest Cover—MF, Slope-Based Land use approach—SB and Reforestation on Public Domain—PD).
Figure 5 shows the average soil erosion under different rainfall return periods for the four land cover scenarios. Across all scenarios, soil erosion increased consistently with higher rainfall intensity. The NI scenario produced the highest erosion rates at all return periods, ranging from 17 ton/ha at the 5-year event to 59 ton/ha at the 100-year event. In contrast, the MF scenario consistently resulted in the lowest erosion values (<1 ton/ha), indicating minimal soil loss even under extreme rainfall. The SB and PD scenarios showed intermediate erosion levels, with SB yielding lower values than PD across all return periods.
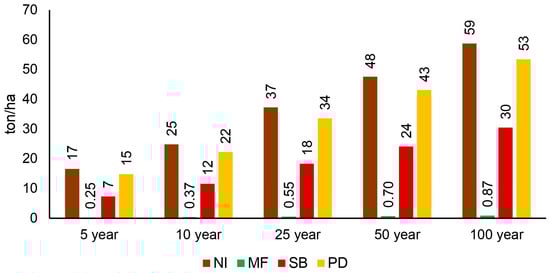
Figure 5.
Average soil erosion values (ton/ha) of different Rainfall Return Period Scenarios (5, 10, 25, 50, 100 year) and different Land cover Scenarios (No Reforestation Intervention—NI, Maximum Forest Cover—MF, Slope-Based Land use approach—SB, and Reforestation on Public Domain—PD).
When applying the soil erosion risk class developed by the Ecosystems Research and Development Bureau-Department of Environment and Natural Resources (ERDB-DENR) [], the NI was under the classification of Very High risk, followed by PD with High risk class, SB with Moderate risk class, and MF with Very Low risk class (Table 6). The With Conservation Initiatives had a lower risk class compared to the Without Conservation Initiatives across all rainfall scenarios.
Table 6.
Average soil erosion values (ton/ha) of different Rainfall Return Period Scenarios (5, 10, 25, 50, 100 year) and different Land cover Scenarios (No Reforestation Intervention—NI, Maximum Forest Cover—MF, Slope-Based Land use approach—SB and Reforestation on Public Domain—PD) and its corresponding soil erosion risk class [].
Table 7 presents the equivalent land cover distribution of CDORB based on Curve Number (CN) classification across four land management scenarios. The existing NI scenario shows a predominance of agricultural (33%) and open forest (32%) areas, both typically associated with relatively higher CN values due to greater runoff potential. Closed forests account for only 22% of the total land area, while minor classes such as shrubs, grasslands, and open spaces collectively represent less than 10%. In contrast, the three reforestation-based scenarios shift land cover toward lower CN categories associated with reduced runoff. The MF scenario converts 100% of the basin into closed forest, representing the lowest CN condition. The SB approach reallocates land according to terrain characteristics, reducing agriculture to 16% while increasing agroforestry (20%) and closed forest (44%). The PD scenario prioritizes the restoration of public lands, maintaining similar open forest extent as NI (32%) while increasing agroforestry (9%) and shrubland cover (10%). These variations illustrate the potential for each management approach to reallocate land cover in the watershed.
Table 7.
CDORB equivalent land cover and their total area (in ha) according to their CN values for No Reforestation Intervention (NI), Maximum Forest Cover (MF), Slope-Based Land use approach (SB) and Reforestation on Public Domain (PD) scenarios.
4. Discussion
4.1. Influence of Rainfall and Land Cover on Soil Erosion
Rainfall intensity and land cover are among the most dominant drivers of soil erosion in tropical watersheds. This study observed that soil erosion in the CDORB increases systematically with higher rainfall return periods and varies strongly across land cover types. Similar studies have shown that rainfall intensity dramatically affects soil erosion rates [,]. One contributor to high surface runoff during intense rainfall events is the limited infiltration capacity of the soil, which forces excess water to flow over the surface; moreover, the high kinetic energy of raindrops and the resulting flow shear stress enhance particle detachment, thus increasing erosion rates [,]. With climate change taking its effect, extreme rainfall events are expected, and significant soil erosion loss will occur [].
In addition to rainfall, land cover also plays a crucial role in influencing soil erosion patterns. Across all scenarios, the No Reforestation Intervention (NI) land cover consistently produced the highest erosion, while the Maximum Forest Cover (MF) scenario resulted in the lowest sediment yield. Forested areas mitigate soil erosion by intercepting rainfall through canopy cover, which reduces the kinetic energy of raindrops and limits soil detachment []. Moreover, the extensive root systems of trees enhance soil structure and promote higher infiltration rates, thereby stabilizing the soil and minimizing surface runoff [,]. In contrast, areas with sparse or no vegetation—such as agricultural lands, built-up zones, and open or barren areas—exhibit greater runoff and sediment transport due to limited ground cover and compacted soil surfaces [,]. Several studies have likewise identified these non-forested areas as major hotspots of soil erosion in several watersheds [,,]. These trends indicate that erosion processes in the basin are primarily driven by rainfall-induced runoff and by land cover differences.
4.2. Role and Performance of Cconservation Initiatives
Numerous studies have demonstrated that reforestation and vegetation restoration are among the most effective strategies for reducing soil erosion. A global study reported that land use change from forested to agricultural areas resulted in a significant increase in soil erosion over 12 years [], underscoring the importance of maintaining and restoring forest cover. In the CDORB, conservation initiatives led to a consistent reduction in soil loss, confirming the stabilizing role of vegetation in tropical watersheds.
The variation in soil erosion among the land cover scenarios can be attributed to differences in the CN values, which are strongly influenced by vegetation density and land use composition. Higher CN values correspond to greater surface runoff and reduced infiltration, while lower CN values indicate enhanced infiltration and lower runoff []. Land covers dominated by agricultural and open forest areas—such as in the NI scenario—tend to have higher CN values, which promote greater surface runoff and limit infiltration (Table 7). Conversely, the MF scenario, which consists entirely of closed forest, represents the lowest runoff potential due to its dense canopy and well-developed root systems that enhance infiltration and soil stability. Intermediate cases, such as the SB and PD scenarios, demonstrate that a strategic balance of forest, agroforestry, and agricultural lands can significantly reduce erosion risk while maintaining productive land uses.
Among the three conservation strategies, the MF scenario consistently produced the lowest erosion across all rainfall return periods, followed by SB and PD. While the MF scenario represents an idealized state with maximum vegetation cover, it may not be feasible in practice due to competing land use and socio-economic demands []. The PD scenario demonstrates moderate erosion reduction, emphasizing the benefits of targeted reforestation within public lands. While the PD scenario demonstrates measurable benefits, its success depends heavily on long-term management and community participation, which remain difficult to sustain at the policy implementation level. The Philippine government initiated the National Greening Program in 2011, where its goal is to reforest 1.5 million ha of degraded land, later expanding its target to 7.1 million ha by 2028 []. However, some constraints were observed during the implementation of this program where unclear land tenure hindered sustained maintenance and reforestation success []. The SB approach, however, emerged as a balanced and practical alternative, aligning with the findings of [], who observed that reforestation on steep slopes (>30%) effectively reduces soil erosion and accelerates vegetation recovery. This is mainly because root systems enhance the shear strength of slope soils, increasing slope stability and reducing soil displacement when exposed to rainfall [,]. In addition, several watershed-scale studies have likewise demonstrated significant reductions in soil erosion rates when reforestation is implemented on sloping terrains [,]. These findings emphasize that strategic reforestation on steep and erosion-prone slopes can substantially reduce soil loss while maintaining viable land uses. The slope-based approach represents a balanced and effective strategy that harmonizes watershed protection and production under real-world conditions.
4.3. Model Limitations
Despite its valuable contributions, this study has several limitations that should be addressed in future research. First, the generalized treatment of the support practice (P) factor could be refined by incorporating spatially explicit data on conservation practices, potentially derived from remote sensing and field observations. Such differentiation would allow for a more accurate representation of land management variability and improve the precision of erosion estimates. Second, integrating soil depth information into the calculation of the soil erodibility (K) factor could enhance the model’s ability to mimic actual watershed conditions, thereby improving the accuracy of predicted soil loss. Although a kriging variance (uncertainty) map was not produced in this study, the spatial interpolation was performed using a relatively dense local sampling network (35 samples within the study area), which captures local soil variability more effectively than global datasets such as SoilGrids. The kriging approach was selected to reflect site-specific conditions that may not be represented in coarser-resolution global products. Nonetheless, we recognize that the absence of an uncertainty map limits the quantitative assessment of spatial confidence, which should be addressed in future work. Furthermore, the scarcity of long-term in situ hydrological and sediment data constrained the validation of model outputs. Future work should explore the use of remote sensing products and downscaled Global Climate Model (GCM) data to complement existing datasets and strengthen model calibration and validation. Finally, the establishment or rehabilitation of additional hydro-meteorological and weather stations across the watershed and the broader region would provide higher-resolution, long-term datasets necessary for more robust modeling and future scenario assessments.
Additionally, the use of the Muskingum–Cunge routing method for channel flow routing introduces simplifications that may affect the representation of flow dynamics. The method assumes a uniform relationship between inflow and outflow and does not fully capture backwater effects or lateral inflows that may occur during extreme rainfall events. Nonetheless, it remains suitable for basin-scale hydrologic modeling under data-limited conditions. Future studies could consider more physically based routing methods or two-dimensional hydrodynamic models when detailed hydraulic data become available.
While these limitations exist, the model’s insights hold strong implications for policy and watershed management. The demonstrated effectiveness of the Slope-Based land use approach highlights the importance of integrating scientific evidence into policy-driven conservation planning. Tools such as the Integrated Watershed Management Plan (IWMP) and the Enhanced National Greening Program (ENGP) provide existing institutional frameworks through which slope-based reforestation and land use zoning could be operationalized. Embedding model-based recommendations within these programs could guide local government units (LGUs) and the Department of Environment and Natural Resources (DENR) in identifying priority reforestation zones, optimizing resource allocation, and aligning conservation efforts with socio-economic needs. This alignment between modeling outputs and policy instruments is essential to ensure the translation of scientific findings into actionable watershed management strategies.
5. Conclusions
This study employed the HEC-HMS model integrated with MUSLE to assess how land cover and rainfall return period scenarios influence soil erosion in the CDORB watershed. Results showed that soil loss increased with higher rainfall return periods, while the implementation of conservation initiatives reduced erosion by about 45–48% compared to the No Reforestation Intervention scenario. Among the interventions, the Maximum Forest Cover yielded the least soil erosion (21 t ha−1), followed by the Slope-Based Land Use approach (716 t ha−1) and Reforestation on Public Domain (1304 t ha−1) scenarios. Although Maximum Forest Cover achieved the lowest erosion, its large-scale application may not be feasible due to socio-economic and land use constraints. In contrast, the Slope-Based Land Use approach offers a more feasible and balanced strategy that mitigates soil loss while sustaining agricultural and livelihood areas. Overall, the study highlights the importance of vegetation structure and slope-sensitive land use planning in reducing erosion and provides a spatially informed basis for guiding reforestation and watershed rehabilitation policies within CDORB.
Author Contributions
Conceptualization, K.E.C.M. and P.D.S.; methodology, K.E.C.M. and P.D.S.; software, K.E.C.M. and E.E.M.A.; validation, P.D.S. and J.Q.G.; formal analysis, K.E.C.M.; writing—original draft preparation, K.E.C.M.; writing—review and editing, K.E.C.M., E.E.M.A., H.P.B., J.Q.G. and P.D.S.; visualization, K.E.C.M.; supervision, P.D.S. and H.P.B. All authors have read and agreed to the published version of the manuscript.
Funding
This research received financial support from the Department of Science and Technology—Accelerated Science and Technology Human Resource Development Program (DOST-ASTHRDP) as part of the author’s master’s degree scholarship, and Wetlands International to support field sampling activities.
Institutional Review Board Statement
Not applicable.
Data Availability Statement
Data are available upon request from the corresponding authors.
Acknowledgments
The authors would like to thank the Mindanao State University—Iligan Institute of Technology for allowing us to conduct laboratory experiments. The author thanks the reviewers for reading and reviewing this manuscript.
Conflicts of Interest
The authors declare no conflicts of interest.
Abbreviations
The following abbreviations are used in this manuscript:
| CDORB | Cagayan de Oro River Basin |
| CN | Curve Number |
| DOST-PHIVOLCS | Department of Science and Technology-Philippine Institute of Volcanology and Seismology |
| DENR-NAMRIA | Department of Environment and Natural Resources-National Mapping and Resource Information Authority |
| ERDB-DENR | Ecosystems Research and Development Bureau-Department of Environment and Natural Resources |
| GIS | Geographic Information System |
| HEC-HMS | Hydrologic Engineering Center-Hydrologic Modeling System |
| LULC | Land Use Land Cover |
| MUSLE | Modified Universal Soil Loss Equation |
| MF | Maximum Forest Cover |
| NI | No Reforestation Intervention |
| NSE | Nash Sutcliffe Equation |
| PAGASA | Philippine Atmospheric, Geophysical and Astronomical Services Administration |
| PBIAS | Percent Bias |
| PD | Reforestation on Public Domain |
| RIDF | Rainfall Intensity Duration Frequency |
| RUSLE | Revised Universal Soil Loss Equation |
| RRP | Rainfall Return Period |
| RSR | Root Mean Square Error Ratio |
| R2 | Coefficient of Determination |
| SB | Slope-Based Land Use Approach |
| SCS-CN | Soil Conservation Service-Curve Number |
| SWAT | Soil Water and Assessment Tool |
| TSS | Total Suspended Solids |
| USLE | Universal Soil Loss Equation |
| WEPP | Water Erosion Prediction Project |
References
- Olabisi, L.S. Uncovering the root causes of soil erosion in the Philippines. Soc. Nat. Resour. 2012, 25, 37–51. [Google Scholar] [CrossRef]
- Sajise, P.E. Forest policies in the Philippines: A Winding Trail Towards Participatory Sustainable Development. In A Step Towards Forest Conservation Strategy: Current Status on Forests in the Asia-Pacific Region, Interim Report; The Institute of Global Environmental Strategies (IGES): Tokyo, Japan, 1998. [Google Scholar]
- Pulhin, J.M.; Chokkalingam, U.; Peras, R.J.J.; Acosta, R.T.; Carandang, A.P.; Natividad, M.Q.; Lasco, E.D.; Razal, R.A. Historical overview. In One Century of Forest Rehabilitation in the Philippines; Center for International Forestry Research (CIFOR): Bogor, Indonesia, 2006; Volume 6. [Google Scholar]
- Presidential Communications Office. Available online: https://pco.gov.ph/presidential-speech/speech-by-president-ferdinand-r-marcos-jr-at-the-1st-national-soil-health-summit-securing-food-and-nutrition-through-healthy-soils/ (accessed on 6 May 2024).
- Dapin, I.G.; Ella, V.B. GIS-Based Soil Erosion Risk Assessment in the Watersheds of Bukidnon, Philippines Using the RUSLE Model. Sustainability 2023, 15, 3325. [Google Scholar] [CrossRef]
- Salvacion, A.R. Delineating soil erosion risk in Marinduque, Philippines using RUSLE. GeoJournal 2022, 87, 423–435. [Google Scholar] [CrossRef]
- Carrasco, S.; Ochiai, C.; Okazaki, K. Disaster induced resettlement: Multi-stakeholder interactions and decision making following Tropical Storm Washi in Cagayan de Oro, Philippines. Procedia Soc. Behav. Sci. 2016, 218, 35–49. [Google Scholar] [CrossRef]
- Sabido-Caingles, V.K.I.; Lorenzo, G.A. Geotechnical characterization of soil in Cagayan de Oro riverbank within Barangay Balulang and Macasandig after the flashflood incident brought by Typhoon Sendong. Mindanao J. Sci. Technol. 2015, 13, 131–151. [Google Scholar]
- Lo, D.S.; Taat, J.; Lapure, C.A.P.; Paduganan, A.A.O.; Lamparas, G.L.B.; Baculio, K.M. Flood inundation mapping along the proposed dike system of the Cagayan de Oro River: The Sendong scale flood. Int. J. Sustain. Dev. Plan. 2017, 12, 165–175. [Google Scholar] [CrossRef]
- Ziadat, F.M.; Taimeh, A.Y. Effect of rainfall intensity, slope, land use and antecedent soil moisture on soil erosion in an arid environment. Land Degrad. Dev. 2013, 24, 582–590. [Google Scholar] [CrossRef]
- Dunkerley, D.L. Rainfall intensity bursts and the erosion of soils: An analysis highlighting the need for high temporal resolution rainfall data for research under current and future climates. Earth Surf. Dyn. 2019, 7, 345–360. [Google Scholar] [CrossRef]
- Zhao, L.; Fang, Q.; Hou, R.; Wu, F. Effect of rainfall intensity and duration on soil erosion on slopes with different microrelief patterns. Geoderma 2021, 396, 115085. [Google Scholar] [CrossRef]
- IPCC. Climate Change 2021: The Physical Science Basis. Contribution of Working Group I to the Sixth Assessment Report of the Intergovernmental Panel on Climate Change; Masson-Delmotte, V., Zhai, P., Pirani, A., Connors, S.L., Péan, C., Berger, S., Caud, N., Chen, Y., Goldfarb, L., Gomis, M.I., et al., Eds.; Cambridge University Press: Cambridge, UK; New York, NY, USA, 2021. [Google Scholar] [CrossRef]
- Feldman, A.D. Hydrologic Modeling System HEC-HMS. In Technical Reference Manual; U.S. Army Corps of Engineers, Hydrologic Engineering Center, HEC: Davis, CA, USA, 2000. [Google Scholar]
- Arnold, J.G.; Srinivasan, R.; Muttiah, R.S.; Williams, J.R. Large area hydrologic modeling and assessment part I: Model development 1. JAWRA J. Am. Water Resour. Assoc. 1998, 34, 73–89. [Google Scholar] [CrossRef]
- Flanagan, D.C.; Nearing, M.A. USDA-Water Erosion Prediction Project: Hillslope profile and watershed model documentation. Nserl Rep. 1995, 10, 1–288. [Google Scholar]
- Gelete, T.B.; Pasala, P.; Abay, N.G.; Woldemariam, G.W.; Yasin, K.H.; Kebede, E.; Aliyi, I. Integrated machine learning and geospatial analysis enhanced gully erosion susceptibility modeling in the Erer watershed in Eastern Ethiopia. Front. Environ. Sci. 2024, 12, 1410741. [Google Scholar] [CrossRef]
- Alebachew, E.D.; Abiye, W.; Dengiz, O.; Turan, İ.D. Soil erosion estimation and risk assessment based on RUSLE in Google Earth Engine (GEE) in Turkiye. Ann. GIS 2025, 31, 123–141. [Google Scholar] [CrossRef]
- Stefanidis, S.P.; Proutsos, N.D.; Solomou, A.D.; Michopoulos, P.; Bourletsikas, A.; Tigkas, D.; Kader, S. Spatiotemporal monitoring of post-fire soil erosion rates using Earth observation (EO) data and cloud computing. Nat. Hazards 2025, 121, 2873–2894. [Google Scholar] [CrossRef]
- Garan, M.A.; Salang, E.D.; Galo, E.V.; Tabal, E.P. Soil erosion rate estimate using USLE of corn producing areas in Barangay Vitali, Zambonga City, Philippines. Int. J. Agric. Technol. 2021, 17, 2087–2096. [Google Scholar]
- Williams, J.R. Sediment yield prediction with universal equation using runoff energy factor (MUSLE). In Present and Prospective Technology for Predicting Sediment Yields and Sources, ARS-S-40; USDA Agricultural Research Service: Washington, DC, USA, 1975; pp. 244–252. [Google Scholar]
- Sadeghi, S.H.R.; Gholami, L.; Khaledi Darvishan, A.; Saeidi, P. A review of the application of the MUSLE model worldwide. Hydrol. Sci. J. 2014, 59, 365–375. [Google Scholar] [CrossRef]
- Berteni, F.; Dada, A.; Grossi, G. Application of the MUSLE model and potential effects of climate change in a small alpine catchment in northern Italy. Water 2021, 13, 2679. [Google Scholar] [CrossRef]
- Hao, R.; Huang, X.; Cai, Z.W.; Xiao, H.B.; Wang, J.; Shi, Z.H. Incorporating sediment connectivity index into MUSLE model to explore soil erosion and sediment yield relationships at event scale. J. Hydrol. 2022, 614, 128579. [Google Scholar] [CrossRef]
- Kaffas, K.; Papaioannou, G.; Varlas, G.; Al Sayah, M.J.; Papadopoulos, A.; Dimitriou, E.; Katsafados, P.; Righetti, M. Forecasting soil erosion and sediment yields during flash floods: The disastrous case of Mandra, Greece, 2017. Earth Surf. Process. Landf. 2022, 47, 1744–1760. [Google Scholar] [CrossRef]
- Shi, W.; Chen, T.; Yang, J.; Lou, Q.; Liu, M. An improved MUSLE model incorporating the estimated runoff and peak discharge predicted sediment yield at the watershed scale on the Chinese Loess Plateau. J. Hydrol. 2022, 614, 128598. [Google Scholar] [CrossRef]
- Aliye, M.A.; Aga, A.O.; Tadesse, T.; Yohannes, P. Evaluating the performance of HEC-HMS and SWAT hydrological models in simulating the rainfall-runoff process for data scarce region of Ethiopian Rift Valley Lake Basin. Open J. Mod. Hydrol. 2020, 10, 105. [Google Scholar] [CrossRef]
- Tibangayuka, N.; Mulungu, D.M.; Izdori, F. Evaluating the performance of HBV, HEC-HMS and ANN models in simulating streamflow for a data scarce high-humid tropical catchment in Tanzania. Hydrol. Sci. J. 2022, 67, 2191–2204. [Google Scholar] [CrossRef]
- Goodarzi, M.R.; Poorattar, M.J.; Vazirian, M. Evaluation of a weather forecasting model and HEC-HMS for flood forecasting: Case study of Talesh catchment. Appl. Water Sci. 2024, 14, 34. [Google Scholar] [CrossRef]
- Qi, K.; Al-Asadi, K.; Duan, J.G. Modeling runoff and sediment load using the HEC-HMS model in an arid watershed. J. Hydrol. Eng. 2024, 29, 05024005. [Google Scholar] [CrossRef]
- Supratman, M.; Kusuma, M.S.; Cahyono, M.; Kuntoro, A.A. Flood hazard assessment due to changes in land use and cover. Civ. Eng. J. 2024, 10, 3874–3891. [Google Scholar] [CrossRef]
- Mindanao Development Authority. Available online: https://now.minda.gov.ph/river-basin-organization-and-master-plans/rb-master-plans/ (accessed on 6 May 2024).
- CESM (Center for Environmental Studies and Management). Formulation of an Integrated River Basin Management and Development Master Plan for Cagayan de Oro River Basin. San Juan City, Philippines. 2014. Available online: https://now.minda.gov.ph/wp-content/uploads/2015/12/Volume-1_Executive-Summary.pdf (accessed on 24 March 2021).
- Villafuerte, M.Q. Rainfall climatology of the Philippines in high-resolution grids. Geogr. Rep. Tokyo Metrop. Univ. 2023, 58, 65–69. [Google Scholar]
- DOST-PHIVOLCS. Satellite Rainfall Monitoring System: Hourly Precipitation Dataset; Department of Science and Technology—Philippine Institute of Volcanology and Seismology: Quezon City, Philippines, 2023.
- US Army Corps of Engineers (USACE). HEC-HMS Hydrologic Modeling System: Technical Reference Manual; Hydrologic Engineering Center, Army Corps of Engineers: Davis, CA, USA, 2000.
- Scharffenberg, W.A.; Fleming, M.J. HEC-HMS Hydrologic Modeling System: User’s Manual (Version 3.0); Hydrologic Engineering Center, U.S. Army Corps of Engineers: Davis, CA, USA, 2006.
- National Mapping and Resource Information Authority (NAMRIA). IFSAR-Digital Elevation Model (5 m Resolution) for Northern Mindanao; Department of Environment and Natural Resources (DENR): Quezon City, Philippines, 2023.
- Wang, B.; Zheng, F.; Guan, Y. Improved USLE-K factor prediction: A case study on water erosion areas in China. Int. Soil Water Conserv. Res. 2016, 4, 168–176. [Google Scholar] [CrossRef]
- Yang, M.; Yang, Q.; Zhang, K.; Pang, G.; Huang, C. Global soil erodibility factor (K) mapping and algorithm applicability analysis. Catena 2024, 239, 107943. [Google Scholar] [CrossRef]
- Safari, Y.; Esfandiarpour Boroujeni, I.; Kamali, A.; Salehi, M.H.; Bagheri Bodaghabadi, M. Mapping of the soil texture using geostatistical method (a case study of the Shahrekord plain, central Iran). Arab. J. Geosci. 2013, 6, 3331–3339. [Google Scholar] [CrossRef]
- Mondejar, J.P.; Tongco, A.F. Estimating topsoil texture fractions by digital soil mapping—A response to the long outdated soil map in the Philippines. Sustain. Environ. Res. 2019, 29, 31. [Google Scholar] [CrossRef]
- Thammadi, S.P.D.; Pisini, S.K. Soil erosion mapping using remote sensing and GIS—A case study of Rewa River Watershed, Naitasiri Province, Fiji. IOP Conf. Ser. Earth Environ. Sci. 2022, 1084, 012050. [Google Scholar] [CrossRef]
- Benavidez, R. Understanding the Effect of Changing Land Use on Floods and Soil Erosion in the CAGAYAN de Oro Catchment. Ph.D. Thesis, Open Access Te Herenga Waka—Victoria University of Wellington, Wellington, New Zealand, 2018. [Google Scholar] [CrossRef]
- Hernandez, E.C.; Henderson, A.; Oliver, D.P. Effects of changing land use in the Pagsanjan–Lumban catchment on suspended sediment loads to Laguna de Bay, Philippines. Agric. Water Manag. 2012, 106, 8–16. [Google Scholar] [CrossRef]
- Gwapedza, D.; Hughes, D.A.; Slaughter, A.R.; Mantel, S.K. Temporal influences of vegetation cover (C) dynamism on MUSLE sediment yield estimates: NDVI evaluation. Water 2021, 13, 2707. [Google Scholar] [CrossRef]
- Panagos, P.; Borrelli, P.; Meusburger, K.; Alewell, C.; Lugato, E.; Montanarella, L. Estimating the soil erosion cover-management factor at the European scale. Land Use Policy 2015, 48, 38–50. [Google Scholar] [CrossRef]
- Gomes, L.; Simões, S.J.; Dalla Nora, E.L.; de Sousa-Neto, E.R.; Forti, M.C.; Ometto, J.P.H. Agricultural expansion in the Brazilian Cerrado: Increased soil and nutrient losses and decreased agricultural productivity. Land 2019, 8, 12. [Google Scholar] [CrossRef]
- Adornado, H.A.; Yoshida, M.; Apolinares, H.A. Erosion vulnerability assessment in REINA, Quezon Province, Philippines with raster-based tool built within GIS environment. Agric. Inf. Res. 2009, 18, 24–31. [Google Scholar] [CrossRef]
- Rellini, I.; Scopesi, C.; Olivari, S.; Firpo, M.; Maerker, M. Assessment of soil erosion risk in a typical Mediterranean environment using a high resolution RUSLE approach (Portofino promontory, NW-Italy). J. Maps 2019, 15, 356–362. [Google Scholar] [CrossRef]
- Wilcock, P.R.; Crowe, J.C. Surface-based transport model for mixed-size sediment. J. Hydraul. Eng. 2003, 129, 120–128. [Google Scholar] [CrossRef]
- Van Rijn, L.C. Sediment transport, part III: Bed forms and alluvial roughness. J. Hydraul. Eng. 1984, 110, 1733–1754. [Google Scholar] [CrossRef]
- Nair, D.; Evans, K.G.; Bellairs, S.M. Sediment modelling of a catchment to determine medium-term erosional trends. Land 2023, 12, 1785. [Google Scholar] [CrossRef]
- Moriasi, D.N.; Arnold, J.G.; Van Liew, M.W.; Bingner, R.L.; Harmel, R.D.; Veith, T.L. Model evaluation guidelines for systematic quantification of accuracy in watershed simulations. Trans. ASABE 2007, 50, 885–900. [Google Scholar] [CrossRef]
- Dupont, B.; Allen, D.L. Revision of the Rainfall-Intensity Duration Curves for the Commonwealth of Kentucky; University of Kentucky Transportation Center: Lexington, KY, USA, 1999; pp. 1–47, KTC-00-18. [Google Scholar]
- European Space Agency (ESA). Sentinel-2 Level-2A Imagery. Copernicus Open Access Hub. 2023. Available online: https://dataspace.copernicus.eu/ (accessed on 6 May 2023).
- Abino, A.C.; Kim, S.Y.; Jang, M.N.; Lee, Y.J.; Chung, J.S. Assessing land use and land cover of the Marikina sub-watershed, Philippines. For. Sci. Technol. 2015, 11, 65–75. [Google Scholar] [CrossRef]
- Soriano, M.; Hilvano, N.; Garcia, R.; Hao, A.J.; Alegre, A.; Tiburan, C., Jr. Land use/land cover change detection and urban sprawl analysis in the Mount Makiling Forest Reserve watersheds and buffer zone, Philippines. Environments 2019, 6, 9. [Google Scholar] [CrossRef]
- Olfato-Parojinog, A.; Sobremonte-Maglipon, P.A.; Limbo-Dizon, J.E.; Almadrones-Reyes, K.J.; Dagamac, N.H.A. Land use/land cover changes (LULCC) using remote sensing analyses in Rizal, Philippines. GeoJournal 2023, 88, 6105–6118. [Google Scholar] [CrossRef]
- Department of Environment Natural Resources—Biodiversity Management Bureau. Manual on Vulnerability of Watersheds; Ecosystems Research and Development Bureau, Department of Environment Natural Resources: Quezon City, Philippines, 2011; pp. 25–26. [Google Scholar]
- Holz, D.J.; Williard, K.W.J.; Edwards, P.J.; Schoonover, J.E. Soil erosion in humid regions: A review. J. Contemp. Water Res. Educ. 2015, 154, 48–59. [Google Scholar] [CrossRef]
- Liu, J.; Liang, Y.; Gao, G.; Dunkerley, D.; Fu, B. Quantifying the effects of rainfall intensity fluctuation on runoff and soil loss: From indicators to models. J. Hydrol. 2022, 607, 127494. [Google Scholar] [CrossRef]
- Yang, Y.; Zhang, S.; Yuan, W.; Li, Z.; Deng, X.; Wang, L. Mechanisms of soil aggregate stability influencing slope erosion in North China. Hydrology 2023, 12, 267. [Google Scholar] [CrossRef]
- Liu, J.; Du, F.; Cheng, X.; Qi, X.; Wang, N.; Shen, N.; Wang, Z. Impacts of rainfall characteristics and slope on splash detachment and transport of loess soil. Land 2024, 13, 189. [Google Scholar] [CrossRef]
- Zhao, Y.; Zhu, D.; Wu, Z.; Cao, Z. Extreme rainfall erosivity: Research advances and future perspectives. Sci. Total Environ. 2024, 917, 170425. [Google Scholar] [CrossRef]
- Li, G.; Wan, L.; Cui, M.; Wu, B.; Zhou, J. Influence of canopy interception and rainfall kinetic energy on soil erosion under forests. Forests 2019, 10, 509. [Google Scholar] [CrossRef]
- Yu, B.; Xie, C.; Cai, S.; Chen, Y.; Lv, Y.; Mo, Z.; Yang, Z. Effects of tree root density on soil total porosity and non-capillary porosity using a ground-penetrating tree radar unit in Shanghai, China. Sustainability 2018, 10, 4640. [Google Scholar] [CrossRef]
- Zhang, D.; Wang, Z.; Guo, Q.; Lian, J.; Chen, L. Increase and spatial variation in soil infiltration rates associated with fibrous and tap tree roots. Water 2019, 11, 1700. [Google Scholar] [CrossRef]
- Nut, N.; Mihara, M.; Jeong, J.; Ngo, B.; Sigua, G.; Prasad, P.V.; Reyes, M.R. Land use and land cover changes and its impact on soil erosion in Stung Sangkae catchment of Cambodia. Sustainability 2021, 13, 9276. [Google Scholar] [CrossRef]
- Shrestha, S.; Cui, S.; Xu, L.; Wang, L.; Manandhar, B.; Ding, S. Impact of land use change due to urbanisation on surface runoff using GIS-based SCS–CN method: A case study of Xiamen City, China. Land 2021, 10, 839. [Google Scholar] [CrossRef]
- Tiwari, J.; Thornton, C.M.; Yu, B.; Poch, R.M. The Brigalow Catchment Study: VI. Evaluation of the RUSLE and MUSLE models to assess the impact of clearing brigalow (Acacia harpophylla) on sediment yield. Soil Res. 2021, 59, 778–793. [Google Scholar] [CrossRef]
- Bibi, T.S.; Adem, E.A. Evaluation of best management practices to reduce sediment yield in the upper Gilo watershed, Baro Akobo Basin, Ethiopia using SWAT. Heliyon 2023, 9, e20326. [Google Scholar] [CrossRef] [PubMed]
- François, M.; Gonçalves Pontes, M.C.; de Vasconcelos, R.N.; de Oliveira, U.C.; Peixoto da Silva, H.; Faria, D.; Mariano-Neto, E. Assessing soil erosion and its drivers in agricultural landscapes: A case study in southern Bahia, Brazil. J. Water Clim. Change 2024, 15, 3312–3327. [Google Scholar] [CrossRef]
- Borrelli, P.; Robinson, D.A.; Fleischer, L.R.; Lugato, E.; Ballabio, C.; Alewell, C.; Meusburger, K.; Modugno, S.; Schütt, B.; Ferro, V. An assessment of the global impact of 21st century land use change on soil erosion. Nat. Commun. 2017, 8, 2013. [Google Scholar] [CrossRef]
- Shadeed, S.; Almasri, M. Application of GIS-based SCS-CN method in West Bank catchments, Palestine. Water Sci. Eng. 2010, 3, 1–13. [Google Scholar] [CrossRef]
- Von Kleist, K.; Herbohn, J.; Baynes, J.; Gregorio, N. How improved governance can help achieve the biodiversity conservation goals of the Philippine National Greening Program. Land Use Policy 2021, 104, 104312. [Google Scholar] [CrossRef]
- Lozano, A.L.; Cortado, J.M.G.; Cosep, P.A., II.; Javier, J.A.L. National Greening Program in the Philippines: A thematic review of policy frameworks, implementation practices and measured outcomes. Int. J. Environ. Clim. Change 2025, 15, 125–139. [Google Scholar] [CrossRef]
- Wang, F.X.; Wang, Z.Y.; Lee, J.H. Acceleration of vegetation succession on eroded land by reforestation in a subtropical zone. Ecol. Eng. 2007, 1, 232–241. [Google Scholar] [CrossRef]
- Lann, T.; Bao, H.; Lan, H.; Zheng, H.; Yan, C.; Peng, J. Hydro-mechanical effects of vegetation on slope stability: A review. Sci. Total Environ. 2024, 926, 171691. [Google Scholar] [CrossRef] [PubMed]
- Zhang, X.; Fu, Y.; Pei, Q.; Guo, J.; Jian, S. Study on the root characteristics and effects on soil reinforcement of slope-protection vegetation in the Chinese Loess Plateau. Forests 2024, 15, 464. [Google Scholar] [CrossRef]
- Nang, Y.W.; Onodera, S.I.; Wang, K.; Shimizu, Y.; Saito, M. Slope gradient effects on sediment yield of different land cover and soil types. Water 2024, 16, 1419. [Google Scholar] [CrossRef]
- Niu, L.; Hu, J.; Li, P.; Zhao, G.; Mu, X. The effect of vegetation restoration on erosion processes and runoff on a hillslope under simulated rainfall. Water 2025, 17, 2411. [Google Scholar] [CrossRef]
Disclaimer/Publisher’s Note: The statements, opinions and data contained in all publications are solely those of the individual author(s) and contributor(s) and not of MDPI and/or the editor(s). MDPI and/or the editor(s) disclaim responsibility for any injury to people or property resulting from any ideas, methods, instructions or products referred to in the content. |
© 2025 by the authors. Licensee MDPI, Basel, Switzerland. This article is an open access article distributed under the terms and conditions of the Creative Commons Attribution (CC BY) license (https://creativecommons.org/licenses/by/4.0/).