Abstract
Monitoring air quality is crucial on a global level. However, it is important to acknowledge the limitations of satellite-derived data in measuring gas concentrations. The Sentinel-5 satellite estimates pollutant density within an atmospheric column by measuring both the reflected solar radiation and the emitted radiation from the top of the Earth’s atmosphere. In other words, it assesses the presence of pollutants within the atmospheric column, but it cannot generate a method to isolate the amount of pollutants near the Earth’s surface from the total measured by the satellite. The authors completely ignored the methodology for converting the pollutant’s gas density within the atmospheric column into parts per million. In this commentary, we aim to clarify that it is neither practically nor operationally feasible to perform what the authors claimed as an evaluation of the accuracy of Sentinel-5p measurements from the ground stations they mentioned.
1. Introduction
Air pollution is a pressing global issue, with profound and far-reaching consequences. Its impacts extend well beyond national borders, affecting human health, the environment, and the climate [1].
The Sentinel-5 Precursor satellite, launched by the European Space Agency in October 2017, is a vital component of the Copernicus Earth observation program. This mission is primarily designed to conduct comprehensive global atmospheric measurements related to air quality, climate change, and ozone layer monitoring. The advanced Tropospheric Monitoring Instrument (Tropomi) on board plays a pivotal role in advancing our understanding of these critical environmental factors. Tropomi is a modern spectroscopic device that measures concentrations of various gases in the Earth’s atmosphere, including nitrogen dioxide (NO2), sulfur dioxide (SO2), ozone (O3), carbon monoxide (CO), water vapor (H2O), methane (CH4), bromate (BrO3−), formaldehyde (HCHO), and particulate matter (aerosols) [2]. Using a push-broom scanning method, the device covers approximately 2600 km in width on the Earth’s surface, allowing for daily global monitoring with high spatial resolution. Tropomi utilizes seven distinct spectral bands in the UV, visible, NIR, and SWIR ranges to achieve its measurements.
Tropomi employs remote sensing techniques based on the behavior of radiation. It measures both solar radiation reflected and radiation emitted from the top of the Earth’s atmosphere. This versatile instrument effectively monitors various gases and compounds in the atmosphere, providing valuable data on their distribution and concentration levels. This contributes significantly to studying air pollution, assessing air quality, and monitoring climate change impacts.
2. Comments on Results
First: Sentinel-5P measures the gas density within the entire atmospheric column or a portion of it. The unit of measurement [ppm] represents the number of compound molecules divided by the number of air molecules. To convert molecules/m2 to ppm, one needs to divide by the column length (the height of the atmosphere containing the gas), where the average height of the troposphere is approximately 12 km. The resulting concentration will be an average over the entire column, not a specific area. This means the result will not be related to the gas concentration near the Earth’s surface. Therefore, this conversion is incorrect, and it is impossible to achieve a strong correlation between satellite measurements and ground stations using this approach.
Tonion and Pirotti (2022) conducted a comprehensive cross-validation study of Sentinel-5P NO2 data against ground-based measurements. They highlighted that the cross-validation approach demonstrates the reliability of Sentinel-5P NO2 data when properly aligned with localized ground data, thereby enabling accurate assessments of air quality dynamics. Their work emphasized that accurate validation requires robust methodologies that do not rely on simplified conversions. To achieve this, they employed multiple validation methods, including simple linear regression on overlapping consecutive images, which yielded an average R2 of 0.50 (SD = 0.21) [3].
Second: For Sentinel-5P products, the European Space Agency (ESA) validates the data collected by the TROPOMI instrument onboard the Sentinel-5P satellite using a network of ground stations and various techniques such as ZSL-DOAS, Pandora, and MAXDOAS. These are advanced tools used for atmospheric measurements from ground stations [4]:
- 1.
- ZSL-DOAS: A technique of Differential Optical Absorption Spectroscopy (DOAS) that measures atmospheric gases by analyzing scattered sunlight at the zenith.
- 2.
- Pandora: A compact instrument for measuring total column gas concentrations like NO2 by directly observing sunlight. It is part of the global Pandonia network.
- 3.
- MAXDOAS: Measures scattered sunlight at multiple angles to retrieve vertical distributions of gases in the lower atmosphere.
These tools are essential for validating and improving the comparison of satellite observations by providing reliable ground-based measurements.
Validation results of Sentinel-5P measurements can be accessed through the official website: https://mpc-vdaf-server.tropomi.eu/ (accessed on 23 September 2024).
Actual validation of Sentinel-5P measurements is conducted using advanced radiative methods, not by converting gas density products within the atmospheric column to ppm.
Figure 1 shows the locations of Pandonia ground validation stations [5].
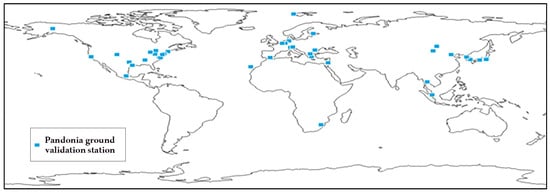
Figure 1.
The locations of Pandonia ground validation stations.
Figure 2 shows the differences between the measurements of the total vertical column of nitrogen dioxide (Pmolec/cm2) from the Pandonia ground network and the Sentinel 5p satellite [5].
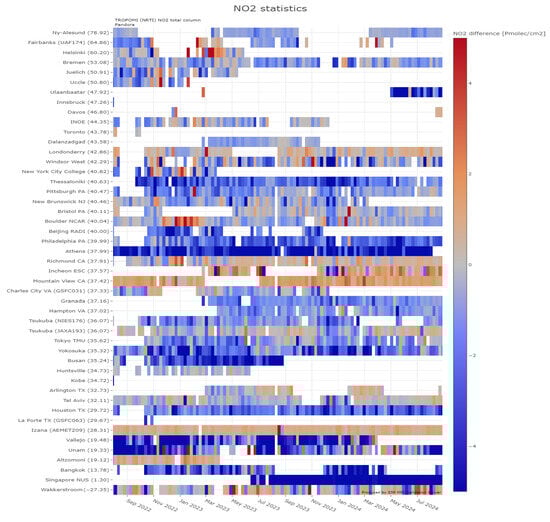
Figure 2.
The differences between the measurements of the total vertical column of nitrogen dioxide from the Pandonia ground network and the Sentinel 5p satellite.
Figure 2 illustrates the comparison validation of Sentinel-5P measurements from ground stations without converting to ppm.
Third: Despite the existence of many ground stations that measure gas concentrations at station height (in ppm), such as those in the United States operated by the Environmental Protection Agency (EPA), these agencies do not convert the measured concentrations from mol/m2 to ppm for the purpose of validating Sentinel-5P measurements. There is no previous literature that relies on the aforementioned conversion method, as it is scientifically incorrect [6].
Fourth: The authors of the paper did not mention anything about the conversion methodology used or whether they utilized auxiliary data (such as air temperature). This raises doubts about all the results presented by the authors, who claim to have converted gas density concentrations to ppm.
Finally: All the results reached by the authors are illogical, incorrect, and cannot be relied upon.
Author Contributions
The author contributions are as follows: Conceptualization, A.A.E.A. and A.H.A.-S.; methodology, A.A.E.A.; software, A.A.E.A.; validation, A.A.E.A. and A.H.A.-S.; formal analysis, A.A.E.A.; investigation A.A.E.A.; resources, A.A.E.A.; data curation, A.A.E.A.; writing—original draft preparation, A.A.E.A.; writing—review and editing, A.A.E.A. and A.H.A.-S.; visualization, A.A.E.A.; supervision, A.H.A.-S.; project administration, A.H.A.-S. All authors have read and agreed to the published version of the manuscript.
Conflicts of Interest
The authors declare no conflict of interest.
References
- Madronich, S.; Sulzberger, B.; Longstreth, J.D.; Schikowski, T.; Andersen, M.S.; Solomon, K.R.; Wilson, S.R. Changes in Tropospheric Air Quality Related to the Protection of Stratospheric Ozone in a Changing Climate. Photochem. Photobiol. Sci. 2023, 22, 1129–1176. [Google Scholar] [CrossRef] [PubMed]
- Kazemi Garajeh, M.; Laneve, G.; Rezaei, H.; Sadeghnejad, M.; Mohamadzadeh, N.; Salmani, B. Monitoring Trends of CO, NO2, SO2, and O3 Pollutants Using Time-Series Sentinel-5 Images Based on Google Earth Engine. Pollutants 2023, 3, 255–279. [Google Scholar] [CrossRef]
- Tonion, F.; Pirotti, F. SENTINEL-5P NO2 Data: Cross-Validation and Comparison with Ground Measurements. ISPRS Arch. 2022, XLIII-B3, 749–754. [Google Scholar] [CrossRef]
- KNMI. MAX-DOAS and Pandora. Available online: https://www.knmi.nl/research/satellite-observations/projects/max-doas-and-pandora (accessed on 23 September 2024).
- TROPOMI MPC-VDAF Server. Available online: https://mpc-vdaf-server.tropomi.eu/no2/no2-nrti-pandora#Locations (accessed on 23 September 2024).
- Environmental Protection Agency (EPA). Outdoor Air Quality Data. Available online: https://www.epa.gov/outdoor-air-quality-data/download-daily-data (accessed on 23 September 2024).


Disclaimer/Publisher’s Note: The statements, opinions and data contained in all publications are solely those of the individual author(s) and contributor(s) and not of MDPI and/or the editor(s). MDPI and/or the editor(s) disclaim responsibility for any injury to people or property resulting from any ideas, methods, instructions or products referred to in the content. |
© 2025 by the authors. Licensee MDPI, Basel, Switzerland. This article is an open access article distributed under the terms and conditions of the Creative Commons Attribution (CC BY) license (https://creativecommons.org/licenses/by/4.0/).