Abstract
In this article, we investigated the dust deposit on leaves in the vegetation period of urban trees using a simple washing method. The data presented in this paper are preliminary results. Air pollution and the area and population of cities are increasing. The EU directives require the reduction and maintenance of air pollution. Trees have many ecological services, including the dust removal capacity. We investigated four urban tree species (Acer platanoides L., Fraxinus excelsior L., Tilia tomentosa Moench., and Prunus cerasifera L. ‘Woodii’) in many locations in Budapest. After collection, the leaves were washed with distillated water, which was eliminated in a drying chamber, and then the dust was measured back into the beakers. Microscopical photos were taken of each leaf’s surface. We found differences among species and seasons, which confirmed previous studies. Examining the data by location, we found no difference in dust deposition, unlike previous results. The dust deposition for Tilia tomentosa Moench. is between 48 and 295 mg/m2; for Fraxinus excelsior L., between 47 and 205 mg/m2; and for Acer platanoides L., between 110 and 500 mg/m2. No relevant data were found for Prunus cerasifera ‘Woodii’ (between 426 and 492 mg/m2) due to its exposed location. New data were obtained in Budapest for the dust deposition of the ‘Woodii’ variety. We partially confirmed or provided new results by examining the dust deposition capacities of urban trees. The leaf surface structure of the examined trees is supposedly a typical cause of dust deposit differences.
1. Introduction
Urbanization is increasing worldwide. According to a United Nations report [1], today, 50% of the world’s population lives in cities, while by 2050, this will represent 68% of the total population. This means that the environmental burden of cities is increasing [2]. From a different perspective, city life is stressful in many ways for city dwellers. According to the WHO (World Health Organization), the urban population is exposed to many health risks, such as cardiovascular and pulmonary diseases, cancers, mental health problems, dementia, reproductive problems, or heat-related strokes and illnesses, among others. These diseases result from the effects of air pollution, noise, urban heat islands, and many other causes [2,3,4].
The European Parliament laid down a directive on ambient air quality and cleaner air for Europe (2008/50/EC) that aimed to regulate and maintain air quality and reduce air pollution [5]. In 2021, almost the entire urban population was exposed to concentrations of fine particulate matter above the guideline level set by the WHO. Furthermore, Central and Eastern Europe and Italy reported the highest concentrations of particulate matter [6]. In Hungary, the air quality is high or moderated during the heating season (from October to March) [7].
As a party member of the United Nation Frameworks Convention on Climate Change (UNFCCC) and the United Nations Economic Commission for Europe—Convention on Long-Range Transboundary Air Pollution (UNECE-CLRTAP) from Geneva, Hungary prepares an emission inventory of greenhouse gases and air pollutants every year. The Hungarian Meteorological Service is responsible for compiling the inventories [8].
Living in cities requires the natural environment, especially urban trees, which provide many ecological services. Ecological systems, including plants, have many benefits for humans, which can be divided in four categories (regulating, provisioning, cultural, and supporting) [9].
Perhaps the most obvious ecological service is the shading ability of trees, to which they actively contribute with their evaporation in addition to the shading of the foliage [10]. With their microclimate-creating effect, they can also reduce the intensity of urban heat islands [11]. One of their most important abilities nowadays is the sequestration of carbon dioxide, thus reducing the level of greenhouse gases in the air [12,13]. In this article, among the above-mentioned, most typical regulating ecological services, we will focus on dust deposition on the leaves of urban trees.
Air-borne pollutants are categorized by their size. Total suspended particulates (TSPs) are all the particles of air pollutants, while particulate matter (PM) refers to the smallest suspended pollutants in the air. By further refining the categories, PM10 is the group of particles with a diameter of 10 µm and PM2.5 is for those smaller than 2.5 µm [14]. Fossil fuel combustion, transportation, wind and soil erosion, and industrial processes are the major sources of TSPs. In addition, PM10, or smaller particles, mostly contain sulfate, ammonium, nitrate, elemental carbon, condensed organic compounds, minerals, microorganisms, and heavy metals [14,15]. The smaller the particulate size, the higher their adsorption capacity, and therefore, the higher their pollution potential [15,16].
The air quality in cities is critical [5,6]. The WHO sets PM10 at 50 µg/m3. This means that the level of the 24 h mean value of PM10 cannot exceed that value. The current value is influenced by many factors. The velocity and direction of air-borne pollutants spreading depend on many factors, such as surface roughness, vegetation, soil or topographic properties, urban condition, building size, the direction and width of roads, the wind speed, etc., which affect different dust deposition rates [16]. Previous experiments prove that the value of air pollutants in cities is higher than in rural areas and seasonal variation is less important than geographic location [17]. TSPs have a positive correlation with PM10 and the PM10/TSP ratio is between 0.6 and 0.75; the correlation coefficient is r = 0.85, which means that two-thirds of the variance in PM10 can be explained by TSPs [17]. Air temperature correlated negatively with PM10, which means that the PM10 level is higher in the autumn–winter period [17]. However, this period is heavily burdened by air pollutants from heating [7]. Some research papers [15,16,17] claim that seasonal variation is not significant in relation to dust deposition, while others prove that seasonality is stronger [17,18,19,20,21].
Leaf characteristics such as shape, surface area, and leaf surface variability influence dust deposition on plant leaves [20,22,23]. Our research group has previous results on some species planted in Budapest, Hungary [15,21]. Acer platanoides L., Tilia tomentosa Moench., and Fraxinus excelsior L. were examined at different locations and during different periods in the inner city of Budapest and we found that dust is deposited in different ways depending on the species, location, and season. The deposited dust amount was between 74.2 and 84.8 mg/m2 in the case of Acer platanoides L., between 62.8 and 74.6 mg/m2 in the case of Fraxinus excelsior L., and between 98.5 and 123.5 mg/m2 in the case of Tilia tomentosa Moench. [21].
In our pilot research, we expanded the number of species and their ages, locations, and sampling times in Budapest. Our goals are to determine the amount of dust deposit on urban tree leaves and to show differences in the ability to deposit dust by species, locations, ages, and seasons. We intend to calculate the approximate amount of dust, what urban trees can deposit based on the number and size of the three most common urban tree species (Acer platanoides L., Fraxinus excelsior L., Tilia tomentosa Moench., and Prunus cerasifera L. ‘Woodii’) in Budapest.
2. Materials and Methods
2.1. Study Area and Meteorological Data
Budapest is located on both banks of Danube River (Figure 1), which divides the Hungarian capital city to Buda (western) and Pest (eastern), with around 2 million inhabitants [24]. Pest is flat and densely built-up in the inner city, showing a concentric-zoned urban model [24]. Buda is hilly, where the Budai Hills rise to an altitude of more than 500 m. Its recreational forest is a protected and natural cooling area of Buda district. Most of the slopes were built up and lost their natural vegetation. In spite of the built-up conditions on Buda Hills, its northwestern–southeastern-directed valley and the Danube are the natural ventilation of air in Budapest [24].
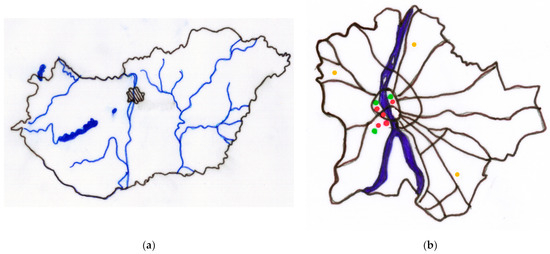
Figure 1.
(a) Location of Budapest within country (striped area), (b) sampling locations (red dots—in Buda: Tabán, Buda Arboretum, Feneketlen pond, and Petőfi-bridge at Buda bridgehead; in Pest: Deák square), chosen HAQN’s measuring stations independent of our institute (green dots) for PM10 (Széna square north and Kosztolányi square south in Buda—left from the Danube—and Erzsébet square in Pest—right from the Danube), and meteorology station also independent of our institute (yellow dots) for precipitation and maximum wind speed (János hill in north Buda, Újpest in north Pest, and Lőrinc in south Pest) within Budapest [own editing].
Annual precipitation of Budapest is 586 mm (mean of 50 years), of which the driest months are from January to March and the rainiest month is July [25], even though climate change has made the distribution of precipitation in the capital highly uncertain. According to the long-term average of the surface air temperature (SAT), it can be said to that the annual SAT is 11.3 °C, but the average annual SAT variations in the city is 22.5 °C [25]; furthermore, human activities and urban heat islands further increase heat day events [24]. Total sunshine is 2079 h annually (mean of 50 years).
Wind speed is on average 2–3 m/s and its direction is typically northwestern, due to topography. There is a secondary direction from the east. The highest wind speeds occur in spring, in March, with an average monthly wind speed of 2.7 m/s. The least windy month is October, with a long-term average of 2.1 m/s [25].
We collected data in 2022 from May to October, and in 2023, from May to end of July. For this period, the Hungarian Meteorology Service data were used and represented as follows. Three measuring stations’ daily data were averaged weekly (János-hill in Buda and Lőrinc and Újpest in south and north Pest; Figure 1b, yellow dots). The necessary data were averaged from the data of the Hungarian Meteorology Service, which is independent of our institute. Precipitation and wind strength are measured only at these three fixed locations in Budapest. The data of the three stations were averaged to cover the area of Budapest. Figure 2 shows the wind speed and precipitation weekly from the 17th week of both examination years (figure is own editing after [26]). In 2022, the rain fell in May and June, followed by a severe drought, and it was not until September that large amounts of precipitation fell. This dry period in summer favored the accumulation of dust on the leaves, which could affect the amount of dust. In 2023, the weather was more humid and the distribution of precipitation was more even than in 2022.
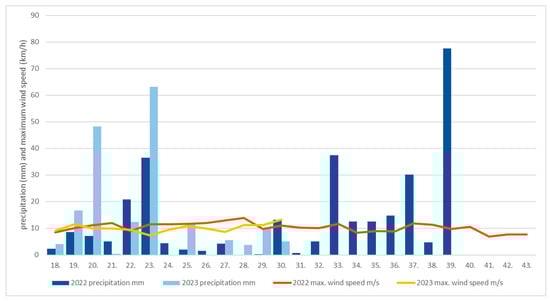
Figure 2.
Weekly averaged maximum wind speed (m/s; brown line from 2022, yellow line from 2023) and precipitation (mm; dark blue column in 2022, light blue column in 2023) in Budapest (average of three measuring stations’ data: János hill—north Buda, Újpest and Lőrincz—north and south Pest). Data started from May (17th week of the year) and concluded in the end of October (43rd week of year (in 2023, data concluded in the 30th week of year, in end of July).
We decided on the above-mentioned time interval because we basically focused on the dust deposition capacity of the urban leaves. The vegetation of most trees lasts from March to October. The leaves reach their ripened size in May, which is why we started collecting samples and observed the weather factors.
These meteorological data can change the dust deposition rate on leaves. Precipitation can wash the dust off the leaves to a greater or lesser extent. Wind speed and direction can affect the amount of dust deposited [14,15,16,17,18].
The Hungarian Air Quality Network observes air-borne pollutants at many locations in Budapest. We have chosen three relevant locations in the inner city (Erzsébet square in Pest district and Kosztolányi square and Széna square in Buda district; Figure 1b, green dots). We calculated the weekly average from the automatically collected data, which starts from the 17th week of both years (from May). Figure 3 shows the PM10 level from three different locations in Budapest (based on [8]). In 2022, the experimental period is from May to October, and in 2023, only from May to the end of July. The value of the dust mostly varied between 15 and 25 mg in 2022. The value of air-borne dust increased in October 2022 with the start of the heating season, according to [7]. In 2023, thanks to more precipitation, PM10 was also lower.
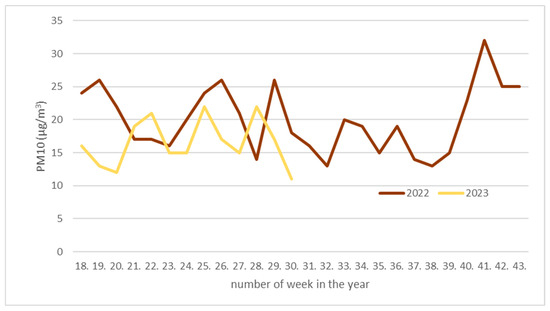
Figure 3.
Weekly averaged PM10 (µg/m3; brown line from 2022, yellow line from 2023) in Budapest (average of three measuring stations data: Széna square—north Buda, Kosztolányi square—south Buda, and Erzsébet square—inner city in Pest). Data started from May (18th week of the year) and concluded in the end of October (43rd week of year; in 2023, data concluded in the 30th week of year, in end of July).
All of our investigated area is polluted and is a high-traffic location, considering the air-borne dust.
2.2. Brief Description of Investigated Taxa
We worked with five taxa, Norway maple (Acer platanoides L.), European or common ash (Fraxinus excelsior L.), silver linden (Tilia tomentosa Moench.), and black cherry plum (Prunus cerasifera L. ‘Woodii’).
All species are deciduous. Norway maple is a large tree (30 m), its bark is light grey, the shoots are shiny and the large buds are reddish brown, its leaves are five-lobed, and their petioles are long and contain milky sap [27]. Common ash is also a large tree (less than 30 m). It has an open, light crown, and grey bark and shoot with black buds. Its leaves are compound with 9–13 leaves [27]. Silver linden is a large tree (~30 m). It has a dense crown with straight upright growing shoots and dark brown bark. Its leaves are big and lobed in the lower section. Young shoots and leaves have silvery hair, after which it received the name [27]. Black cherry plum (cultivar ‘Woodii’) is a smaller tree (less than 15 m) with dark brown bark and thin, shiny dark shoots. This cultivar has dark purple, almost black leaves [27]. The species described here are popular and often planted urban trees.
Table 1 contains more details of the individuals included in the experiment. All current taxa were investigated in both years.

Table 1.
Short description of leaves and locations of investigated individuals.
2.3. Sampling and Laboratory Analysis
In late spring, we measured the height and crown diameter of the trees and then calculated the crown projection area (CPA) according to the following equation [29]:
where the crown length and crown width are two crown diameter data in two mutually perpendicular directions.
CPA = (crown length/2) × (crown width/2) × π (m2)
The leaf area index (LAI) was determined with a ceptometer (AccuPAR LP-80, Decagon Devices Inc., Pullman, WA, USA) in the case of each measuring date in both years. This indicator is a unitless number that shows how many square meters of the leaf surface is in square meters of the crown projection area. By reversing this, the product of the crown projection area and the leaf surface index can be used to calculate approximately the total leaf surface of individual trees according to the following equation:
total leaf area per tree = CPA × LAI (m2)
Leaves were collected on different measuring days (see details in Table 2) in a paper bag, separated by species or locations. In a few experiments [30,31,32], the samples are collected in a plastic bag to prevent the paper fibers from mixing with the sample. In the present research, however, we followed the protocol of [15,21,33,34], according to which the samples were collected in paper bags. This is because plastic bags can electrostatically attract fine dust particles, thus reducing the amount of the sample. In the paper bags, the collected leaves were turned towards each other to reduce the risk of entanglement with the fibers of the paper bag. Due to more rainy days, the measuring in May is missed in 2023. Leaves were randomly collected from the lower half of the crown (from a height of 1.5–2 m), from all sides. The samples were transported to the laboratory as soon as possible, where we set the repeating number (at least four times) and pieces (3–5 pcs) per repeat. Therefore, we took 12–20 leaves from each tree for a given measurement. We partially followed previous protocols [30,31,32] to measure the dust deposit on the leaves (DDL). Firstly, the empty beakers were measured on an analytical scale (Ohaus, Explorer Pro, EP 64, Parsippany, NJ, USA), separately. We carefully washed the dust from the leaf samples into a beaker with 50 mL of distilled water and gently applied a six-sized painting brush to avoid washing off the hairs on the surface of the leaf. We did not use any kind of filter to refine or purify the solution. During the first few measurements, we looked back under a microscope to see how much the trichomas (fine hairs on leaves’ surface) were washed in and found that this amount was insignificant, so we did not use filtration in this preliminary experiment. After washing, the beakers with the solution were put into a drying chamber to eliminate water at 115 °C for 8 h. After they had cooled, the beakers were measured back on the analytical scale. The amount of dust was obtained from the difference between the dusty and clean beakers (in mg).
Table 2.
Measuring date, number of investigated trees per location, and replicates per measuring procedure in both years.
The individual leaf area was determined with a leaf scanner (AM350 Leaf Area Meter, ADC BioScientific Ltd., Hoddesdon, UK). We worked separately with the leaves, which were washed off in a beaker. The measured amount of dust and the summarized data on the area of the sample leaves were standardized to mg/m2.
In order to characterize the surface of the leaves of each species, we took microscopic pictures of the surface and back site of the leaves. A 4× magnification was used on the microscope (Euromex iScope IS 113-PLI, Arnhem, The Netherlands).
2.4. Data Analysis
All data were statistically analyzed via ANOVA using the statistical package IBM SPSS Statistics 27. Means were separated via the Duncan-test at level p = 0.05. Different letters in the same row of the tables indicate significant differences at p = 0.05. Standard deviation data were presented with (±number) in tables or in the plots in diagrams.
3. Results
The dust deposit on leaves (DDL) washed off by water are presented in Figure 4, by month and species. In 2022 May, Acer, Fraxinus and ‘Woodii’ showed significant differences. ‘Woodii’ had the highest DDL (427.0 mg/m2 leaf area). The Acer and Fraxinus values were 169.7 and 165.4 mg/m2. In 2022 August, ‘Woodii’ also showed outstanding values (427.0 mg/m2 leaf area), of which Acer and Fraxinus belonged to the next group with values of a 182.6 and 204.7 mg/m2 leaf area. Tilia gave the lowest value (97.9 mg/m2 leaf area). In 2022 October, the dust deposition values improved significantly, except for Fraxinus, which showed reduced DDL in October. The increased dust deposit comes from the start of the heating season. In 2023 June, we could not determine a significant difference in these data. Due to the rainy weather in May, the amount of dust deposited on the leaves remained low in June as well (530.17 mg/m2 leaf area). Our results show that DDL changes significantly with seasons. During the present study, the DDL capacity of the species shows an increasing trend in the monitored period, except for Fraxinus (Figure 4). The lack of precipitation in October (see Figure 2) strengthened this trend. The amount of dust present in the air also increases the chance of deposition (Figure 3).
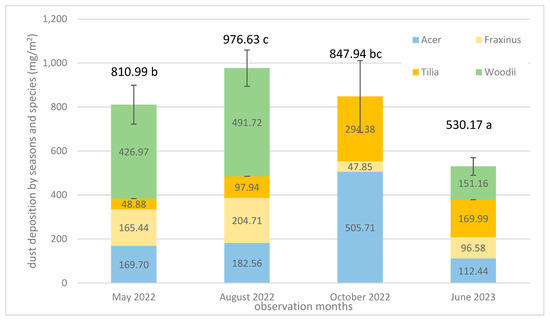
Figure 4.
Performance of DDL by months and species. Plot on every column means standard deviation of sum of months. Different letter at value means significantly differences separated via Duncan test (at p = 0.05). ‘Woodii’ data missed in October 2022.
Investigating the average dust deposit (DDL) by species (Table 3), it can be seen that the leaves of ‘Woodii’ and Acer deposited the most dust from the air during the period under review. We have contradictory data regarding Tilia, of which its dust deposit was low in May and August, while it multiplied in October (Figure 4 and Table 3). The dust deposit capacity of the linden species varies between wide values.
Table 3.
All dust deposition calculations and their standard deviation (mg/m2 leaf area).
We found differences between individual leaf areas (ILA) according to species (Table 3). ‘Woodi’ has the smallest leaves (24.1 cm2), followed by Tilia (48 cm2). Acer and Fraxinus have the largest leaves (110.1 cm2 and 121.0 cm2, respectively). Tilia has the densest canopy (5.73), followed by Acer (4.90) and ‘Woodii’ (4.06). However, Fraxinus is a large tree and has a lighter canopy structure (only with 3.46 LAI). The crown diameter (CD) is closely related to the crown projected area (CPA). Tilia is largely separated from the other species in this case too.
The total leaf area (TLA) drives to calculate the dust deposition capacity of a species. Tilia has the highest volume of leaf surface (286.2 m2) corresponding with dense canopy and small leaves. The large total leaf area of Acer (216.1 m2) comes from a large individual leaf area and quite a dense canopy.
To calculate the dust deposit capacity of a tree (DDC in kg), we multiplied the total leaf area by the dust deposition rate of the species. Here, we found that Fraxinus trees had the lowest capacity to capture air-borne dust (0.0189 kg).
Figure 5, Figure 6, Figure 7 and Figure 8 present the microscopic images of the surface (a) and the back (b) of the leaves. Small, black dots on leaves are dust (please keep in mind that only a part of the measured quantities can be seen in these images at the 4× resolution; most of the measured dust is not visible at this magnification). Acer platanoides L. has a smooth and bright leaf surface according to [13], see Table 1. On the back of the leaf, there are short hairs on the veins. Fraxinus excelsior L. has a glabrous and shiny surface of compound leaves (Figure 6a) and there is not any hair. Tilia tomentosa Moench. leaves are full of trichomes, which look like stars (Figure 7a,b). We can observe dust particles trapped under the star hairs, especially on surfaces where small dust particulates are collected under starlike trichomes. Prunus cerasifera L. ‘Woodii’ is distinguished by the color of the leaf, on which it is difficult to observe the particulates of dust. The leaf surface is glabrous (Figure 8a), but on the backside, it is hairy in veins (Figure 8b).
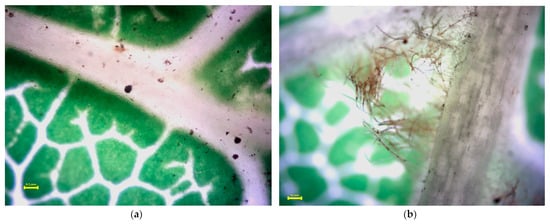
Figure 5.
Stereomicroscopy images of the Acer platanoides L. leaf surface (a) and backside (b). Yellow line in the picture means 0.1 mm scale. Small, black dots on leaves are dust (please keep in mind that only a part of the measured quantities can be seen in these images at the 4× resolution; most of the measured dust is not visible at this magnification).
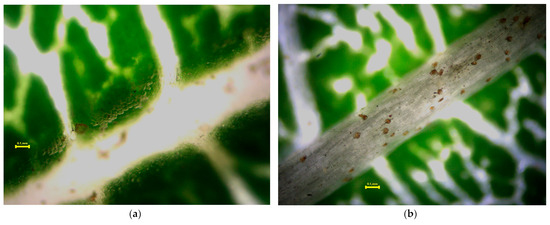
Figure 6.
Stereomicroscopy images of the Fraxinus excelsior L. leaf surface (a) and backside (b). Yellow line in the picture means 0.1 mm scale. Small, black dots on leaves are dust (please keep in mind that only a part of the measured quantities can be seen in these images at the 4× resolution; most of the measured dust is not visible at this magnification).
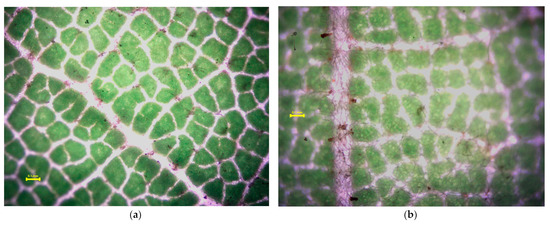
Figure 7.
Stereomicroscopy images of the Tilia tomentosa Moench. leaf surface (a) and backside (b). Yellow line in the picture means 0.1 mm scale. Small, black dots on leaves are dust (please keep in mind that only a part of the measured quantities can be seen in these images at the 4× resolution; most of the measured dust is not visible at this magnification).
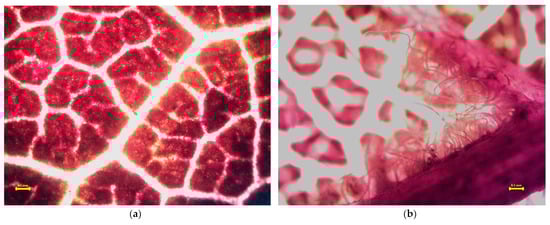
Figure 8.
Stereomicroscopy images of the Prunus cerasifera L. ‘Woodii’ leaf surface (a) and backside (b). Yellow line in the picture means 0.1 mm scale. Small, black dots on leaves are dust (please keep in mind that only a part of the measured quantities can be seen in these images at the 4× resolution; most of the measured dust is not visible at this magnification).
4. Discussion
Our dust deposit results of different urban tree species correspond with [21]. Their results show that the dust deposit changes with the seasons and the exposed location [21].
According to [32], the dust deposit on the leaves of the linden species varies in a wide range (from 5 to 40 mg/m2), while [21] found that the dust deposit is between 94 and 130 mg/m2. Our results are between 48 and 295 mg/m2, which is higher than the previous literature data. The difference in the amount of dust could be caused because we did not filter the dust in this pilot research. Tilia tomentosa L. leaves have densely standing trichomes that can capture the large dust particles too on the surface and back of the leaf (see Figure 6). Trichomes influence the amount of dust deposited [20,32]. The trichomes can capture the large dust particles on the surface and backside of the leaf (see Figure 5). We suppose that dust accumulates on the linden leaves by the end of the vegetation period, as the rain is less able to wash off the large dust particles too from the trichomes. However, in the same way, it is difficult to wash off the dust from the leaves during the preparations.
The dust deposit results of Fraxinus excelsior L. formed according to [15,21], where they found that this species has the lowest dust deposit (between 15 and 20 mg/m2 or 58 and 77 mg/m2) Thanks to its shiny, glabrous leaf surface, which, according to [32], also reduces the amount of deposited dust in the case of different species. Our data presented between 47 and 205 mg/m2. The difference in the amount of dust could be because we did not filter the dust in this pilot research.
We found that the leaves of Acer platanoides L. can deposit air-borne dust in the amount between 110 and 500 mg/m2. Compared to the data of [31], they defined this range between 30 and 50 mg/m2 in the case of Acer campestre and Acer negundo. Other research [21] found dust amounts from 66 to 88 mg/m2 on Acer platanoides L. leaves. The different amounts of dust could be because we did not filter the dust in this pilot research. Every amount varied by the number of measuring times, leaf area, tree size, and weather conditions [15,20,21,30,31,32,33,34].
No relevant data were found for the dust deposit of Prunus cerasifera ‘Woodii’. The closest related species Prunus serotina has a dust deposit of no more than 10 mg/m2 [32]. Our data varied between 426 and 492 mg/m2, due to the exposed location. For example, ‘Woodii’ gave high amounts of deposited dust in every investigated time, which may have been because its area is windy and located next to the Danube, which is surrounded by heavy traffic. This environmental exposure can significantly influence the dust deposit of those trees [16,21,30].
Weather conditions such as precipitation and wind speed can greatly affect the quantity of air-borne pollutants (compare Figure 2 and Figure 3). The lack of precipitation in October increased the PM10 in the air, which increased the amount of dust that could deposit, thus increasing the dust on the leaves’ surface. This statement is related to the statement by [17] that found that the TSP concentration improved in October.
In addition to the factors mentioned above, incorrect sampling practices may have increased the measured values (use of paper bags instead of plastic bags). To clarify this, we plan to carry out methodological studies in the future. Although we did not filter our samples, the ratios between species show that, according to previous studies [15,21,30,31,32,33,34] and our own results, linden can capture the most suspended particles of air-borne pollution.
According to [22,23,30,31,32], the leaf area, age, and leaf surface significantly determine the capacity of trees in dust deposition. Microscopic images show how different the surfaces of the leaves are and how it shapes the dust deposition (Figure 5, Figure 6, Figure 7 and Figure 8); stereomicroscopy images show large differences in the leaf surface structure). Although the small, black dots on leaves are dust particles, at the 4× resolution, most of the measured dust is not visible at this magnification. With the help of microscopic images, in our further plans, we will determine the number of hairs per unit area, thus comparing the leaf surface of each species. In future research, we plan to investigate statistical correlations between the density of trichomes and the dust deposition capacity.
We observed the seasonal changes both by species and by season, which correspond to the results of [15,21]. So far, we have calculated how much dust the examined species can deposit on a larger scale. The dust deposition capacity of individual trees is influenced by the size of the trees, the density of their crowns, and the characteristics of the leaves. Furthermore, the size of the trees increases with their age.
Based on our data and results, refining the dust removal process and filtering the washed solution should be considered for our further investigations. Filtering the solution of the washed dust would greatly refine the process. Filtering and further analysis of the samples show the elemental composition of the total suspended particulates. By collecting as much data as possible, we would like to calculate a correlation between the dust deposition and weather factors, such as wind and precipitation. Furthermore, we also would like to investigate whether the deposited dust affects the photosynthetic activity and the physiological characteristics of the leaves.
5. Conclusions
Trees greatly improve the air in the urban environment by filtering. Urban air pollution can be reduced by choosing the right wood species. In addition to being tolerant of urban conditions, urban trees must also have a good dust deposition capacity. Older trees with a large leaf surface can filter out more pollution from the urban environment. Our results can indicate that of the three most planted tree species, of which silver lindens (Tilia tomentosa Moench.) have the highest dust-holding capacity. Ash trees (Fraxinus excelsior L.) do not tolerate well with urban conditions, and in addition, their shiny, smooth leaves can capture less dust. Although Norway maples (Acer platanoides L.) have a greater ability to capture dust due to their large leaf surface, they do not tolerate a lack of air moisture well.
We partially confirmed previous results on the dust deposit of three urban tree species and provided new results by examining the dust deposit capacities of urban trees. In addition, we confirmed that the leaf surface structure differs significantly, which can cause the different dust deposition abilities. However, weather events, like rain and wind, may affect dust deposition, and more data before and after rain and wind should be collected to clarify their effects.
The methodology of washing off the dust also needs refining. The correct choice of methods is necessary to determine the total suspended particulates. The difference in methods gives a high degree of uncertainty, so methodological experiments will have to be carried out to make the results more reliable.
Author Contributions
Conceptualization, K.H. and V.S.; methodology, V.S. and I.K.; software, V.S.; validation, K.H.; formal analysis, V.S., H.C. and I.K.; investigation, V.S., H.C. and I.K.; resources, V.S., H.C. and I.K.; data curation, V.S., H.C. and I.K.; writing—original draft preparation, V.S. and I.K.; writing—review and editing, V.S.; visualization, V.S.; supervision, K.H.; project administration, V.S. and I.K. All authors have read and agreed to the published version of the manuscript.
Funding
This research received no external funding.
Data Availability Statement
All data generated or analyzed during the current study are presented in this article. However, the raw data is available from the corresponding author.
Acknowledgments
We would like to thank the employees of the Budapest Greenspace Maintenance Division (Főkert Division) belonging to Public Utilities of Budapest for providing us with the opportunity to use their database.
Conflicts of Interest
The authors declare no conflict of interest.
References
- United Nations, Department of Economic and Social Affairs. Population Division, World Urbanization Prospects: The 2018 Revision (ST/ESA/SER.A/420); United Nations: New York, NY, USA, 2019; p. 126. ISBN 978-92-1-004314-4. [Google Scholar]
- WHO. Available online: https://www.who.int/teams/environment-climate-change-and-health/healthy-urban-environments/urban-planning/health-risks (accessed on 31 July 2023).
- Kampas, M.; Castanas, E. Human health effects of air pollution. Environ. Pollut. 2008, 151, 362–367. [Google Scholar] [CrossRef] [PubMed]
- Zhang, W.; Qian, C.N.; Zeng, Y.X. Air pollution: A smoking gun for cancer. Chin. J. Cancer 2014, 33, 173–175. [Google Scholar] [CrossRef] [PubMed]
- European Union Law. Available online: https://eur-lex.europa.eu/legal-content/en/ALL/?uri=CELEX:32008L0050 (accessed on 31 July 2023).
- European Environment Agency Official Homepage. Available online: https://www.eea.europa.eu/publications/europes-air-quality-status-2023 (accessed on 2 August 2023).
- IQ Air. Available online: https://www.iqair.com/hungary (accessed on 2 August 2023).
- Hungarian Meteorology Service. Available online: https://legszennyezettseg.met.hu/kibocsatas (accessed on 16 August 2023).
- Troy, A.; Bagstad, K. Estimating Ecosystem Services in Southern Ontario; Technical report prepared for the Ontario Ministry of Natural Resources SIG LLC; SIG LLC: Pleasanton, CA, USA, 2009; p. 70. [Google Scholar]
- Rahman, M.A.; Ennos, A.R. What We Know and Don’t Know about the Cooling Benefits of Urban Trees; Report of London Tree Officers Association; Trees & Design Action Group: London, UK, 2016; p. 30. Available online: https://www.tdag.org.uk/uploads/4/2/8/0/4280686/what_is_known_and_not_know_cooling_benefits_of_urban_trees.pdf (accessed on 16 August 2023).
- Soltani, A.; Sharifi, E. Daily variation of urban heat island effect and its correlations to urban greenery: A case study of Adelaide. Front. Archit. Res. 2017, 6, 529–538. [Google Scholar] [CrossRef]
- Nowak, D.J. Atmospheric Carbon Dioxide Reduction by Chicago’s Urban Forest. In Chicago’s Urban Forest Ecosystem: Results of the Chicago Urban Forest Climate Project; McPherson, E.G., Nowak, D.J., Rowntree, R.A., Eds.; USDA Forest Service; Northeastern Forest Experimental Station: Radnor, PA, USA, 1994; pp. 83–94. [Google Scholar]
- Nowak, D.J.; Greenfield, E.J.; Hoehn, R.E.; Lapoint, E. Carbon storage and sequestration by trees in urban and community areas of the United States. Environ. Pollut. 2013, 178, 229–236. [Google Scholar] [CrossRef] [PubMed]
- Alias, M.; Hamzah, Z.; Kenn, L.S. PM10 and Total Suspended Particulates (TSP) Measurements in Various Power Stations. Malays. J. Anal. Sci. 2007, 11, 255–261. [Google Scholar]
- Haimei, C.; Kardos, L.; Gyeviki, M.; Hrotkó, K.; Szabó, V.; Sütöriné Diószegi, M. Evaluating the Capability of Woody Plants to Capture Atmospheric Heavy Metals in Budapest. J. Cent. Eur. Green Innov. 2023, 11, 67–81. [Google Scholar] [CrossRef]
- Motamedi, F.; Nadoushan, M.A.; Jalalian, A. Evaluating the Rate of Atmospheric Dust Deposition in Isfahan City. Atmósfera 2022, 35, 601–609. [Google Scholar] [CrossRef]
- Monn, C.; Braendli, O.; Schaeppi, G.; Schindler, C.; Ackermann-Liebrich, U.; Leuenberger, P.; Sapaldia Team. Particule Matter <10 µm (PM10) and Total Suspended Particulates (TSP) in Urban, Rural and Alpine Air in Switzerland. Atmos. Environ. 1995, 29, 2565–2573. [Google Scholar]
- Mori, J.; Sæbø, A.; Hanslin, H.M.; Teani, A.; Ferrini, F.; Fini, A.; Burchi, G. Deposition of traffic-related air pollutants on leaves of six evergreen shrub species during a Mediterranean summer season. Urban For. Urban Green. 2015, 14, 264–273. [Google Scholar] [CrossRef]
- Nowak, D.J.; Crane, D.E.; Stevens, J.C. Air pollution removal by urban trees and shrubs in the United States. Urban For. Urban Green. 2006, 4, 115–123. [Google Scholar] [CrossRef]
- Chaudhary, I.J.; Rathore, D. Suspended particulate matter deposition and its impact on urban trees. Atmos. Pollut. Res. 2018, 9, 1072–1082. [Google Scholar] [CrossRef]
- Hrotkó, K.; Gyeviki, M.; Sütöriné Diószegi, M.; Magyar, L.; Mészáros, R.; Honfi, P.; Kardos, L. Foliar dust and heavy metal deposit on leaves of urban trees in Budapest (Hungary). Environ. Geochem. Health 2021, 43, 1927–1940. [Google Scholar] [CrossRef] [PubMed]
- Wang, L.; Gong, H.; Liao, W.; Wang, Z. Accumulation of particles on the surface of leaves during leaf expansion. Sci. Total Environ. 2015, 532, 420–434. [Google Scholar] [CrossRef] [PubMed]
- Popek, R.; Przybysz, A.; Gawrońska, H.; Klamkowski, K.; Gawroński, S.W. Impact of particulate matter accumulation on the photosynthetic apparatus of roadside woody plants growing in the urban conditions. Ecotoxicol. Environ. Saf. 2018, 163, 56–62. [Google Scholar] [CrossRef] [PubMed]
- Probáld, F. The urban climate of Budapest: Past, present and future. Hung. Geogr. Bull. 2014, 63, 69–79. [Google Scholar] [CrossRef]
- Hungarian Meteorology Service. Budapest’s Climate. Available online: https://www.met.hu/eghajlat/magyarorszag_eghajlata/varosok_jellemzoi/Budapest/ (accessed on 17 August 2023).
- Hungarian Meteorology Service. Daily Meteorology Report. Available online: https://www.met.hu/idojaras/aktualis_idojaras/napijelentes/ (accessed on 17 August 2023).
- Johnson, O.; More, D. Tree Guide, 3rd ed. (Hungarian Edition); HarperCollins Publisher Ltd.: London, UK, 2004; pp. 216, 340, 371, 404, 436. [Google Scholar]
- North Carolina State University. Plant Toolbox. Available online: https://plants.ces.ncsu.edu/plants/ (accessed on 18 August 2023).
- Growth Characteristics of Urban Trees in Budapest. Available online: http://ves.uniag.sk/files/pdf/pnhfuvwl4fiarhbcic1iuv9jhiiott.pdf#page=122 (accessed on 17 August 2023).
- Braun, M.; Margitai, Z.; Tóth, A.; Leermakers, M. Environmental Monitoring Using Linden Tree Leaves as Natural Traps of Atmospheric Deposition: A Pilot Study in Transilvania, Romania. AGD Landsc. Environ. 2007, 1, 24–35. [Google Scholar]
- Simon, E.; Braun, M.; Vidic, A.; Bogyó, D.; Fábián, I.; Tóthmérész, B. Air pollution assessment based on elemental concentration of leaves tissue and foliage dust along an urbanization gradient in Vienna. Environ. Pollut. 2011, 159, 1229–1233. [Google Scholar] [CrossRef] [PubMed]
- Simon, E.; Baranyai, E.; Braun, M.; Cserháti, C.; Fábián, I.; Tóthmérész, B. Elemental concentration in deposited dust on leaves along an urbanization gradient. Sci. Total Environ. 2014, 490, 514–520. [Google Scholar] [CrossRef] [PubMed]
- Margitai, Z.; Braun, M. Nyolc európai város légszennyezettségének vizsgálata falevelekrol gyűjtött por elemösszetételének diszkriminancia analízésével. (Air quality assessment via discriminant analysis of elemental composition data dust collected from tree leaves, in Hungarian). Magy. Kémiai Folyóirat 2005, 111, 38–41. [Google Scholar]
- Margitai, Z.; Simon, E.; Fábián, I.; Braun, M. Inorganic chemical composition of dust deposited on oleander (Nerium oleander L.) leaves. Air Qual. Atmos. Health 2017, 10, 339–347. [Google Scholar] [CrossRef]


Disclaimer/Publisher’s Note: The statements, opinions and data contained in all publications are solely those of the individual author(s) and contributor(s) and not of MDPI and/or the editor(s). MDPI and/or the editor(s) disclaim responsibility for any injury to people or property resulting from any ideas, methods, instructions or products referred to in the content. |
© 2023 by the authors. Licensee MDPI, Basel, Switzerland. This article is an open access article distributed under the terms and conditions of the Creative Commons Attribution (CC BY) license (https://creativecommons.org/licenses/by/4.0/).