Abstract
Surface mining activities support socioeconomic development but also cause significant landscape alteration and degradation. By definition, the concept of landscape requires observers; thus, the way mining landscapes are actually observed needs to be taken into consideration for mitigating visual nuisance from open pit mines. This paper utilizes eye tracking techniques for recording and rendering the actual attention patterns of observers, along with saliency models that ‘predict’ the focus of attention in mining landscape photographs. As it turns out, saliency models can aid in reliably anticipating the attention focus across a range of different mining landscapes.
1. Introduction
Mining has been a necessary human activity for the survival and development of the earliest societies and for the thriving of the modern economy [1,2]. However, surface mining, in particular, is also one of the greatest landscape offenders [3], typically inducing landscape alteration [4] accompanied by intense “geomorphological and aesthetic effects” [3] (p. 185).
Landscape is “an area, as perceived by people, whose character is the result of the action and interaction of natural and/or human factors” [5]. As a consequence, landscape effects are landscape alterations that can be ‘translated’ in the appearance of these alterations and in the subsequent effects in the visual amenity of any potential observer [6].
In this sense, the examination of visual perception is of utmost importance. Recent scientific research reveals that human vision depends on the gradual integration of small regions of each observed scene into a coherent whole [7]. Visual attention focuses on these small regions so as to reduce the perceived complexity and to further facilitate the processing and interpretation of visual scenes [7]. Therefore, the potential of anticipating the focus of attention is theoretically interesting and can be of crucial use in practice. Especially in the domain of surface mining, approximating in advance the visual attention behavior of potential observers may foster strategies for mitigating visual nuisance from open pit mines.
Saliency models have been developed with the aim to predict visual attention based on certain (low-level) attributes of the stimulus: each feature in a visual scene is attributed a visual saliency value depending on its intensity, color, and orientation compared to the respective information of its surrounding features [8]. The resulting saliency maps have been found to provide, in several cases, “reliable predictions of the human observation pattern and [of those] elements in a landscape [that] will catch the attention” [9] (p. 17).
On the other hand, the actual recording of gaze movement and attention allocation can be obtained through eye tracking techniques, e.g., [10,11]. Gaze movement consists of (i) rapid eye movements (saccades), whereby the fovea is reoriented through a visual scene, and (ii) in-between “periods of relative gaze stability (fixations)”, during which pattern information is acquired [10] (p. 593). In fact, “humans […] direct [their] fixation through a scene […] in the service of ongoing perceptual, cognitive, and behavioural activity” [10] (p. 593). An intuitive and aggregate means to visualize the focus of attention—usually based on fixation duration—are attention/focus heatmaps; such types of heatmaps are most appropriate, since they not only reveal the areas being attended in a visual scene, but also constitute robust indicators of the degree of the involved cognitive processes [7,12].
The general effectiveness of these heatmaps is specified by two factors: the usage of a color graduation that corresponds to the everyday sense of warm and cold colors (red hues: greater attention attraction, blue hues: lesser attention attraction); and the fact that “heatmaps show the data directly over the stimulus” [13] (p. 30). What is more, the patterns of focus heatmaps are comparable to the patterns resulting from saliency maps, as saliency also refers to bottom-up perceptual mechanisms of attraction. Hence, these comparisons can be used to study whether and to what extent the attention allocation derived from experimental eye tracking data can be reduced to saliency maps; in other words, whether and in which cases the actual attention attraction can be predicted by the computational models.
In this paper, visual nuisance—i.e., subjective impression of landscape disturbance—caused by mining operations is addressed. The fundamental premise to this end is that if the perception of an open pit mine is adequately low, then its visual nuisance is also reduced [9,14]. To this end, both saliency models and eye tracking techniques are used across different mining landscape photographs in order to derive information for both the anticipated and the actual allocation of attention. This research study aims at testing whether the saliency maps are adequate substitutes of the focus heatmaps resulting from the eye movement analysis. In a more practical sense, the key research question is: can one anticipate the visual behavior of actual observers while viewing mining landscapes by means of appropriate computational models? Additionally, if yes, under which conditions?
2. Materials and Methods
2.1. Visual Stimuli, Participants and Viewing Procedure
2.1.1. Visual Stimuli
The visual stimuli for conducting this eye tracking experiment were 12 mining landscape photographs, i.e., natural (not simulated) landscapes within which certain views/aspects of mining areas (open-pit mines) were present (Figure 1). The photographs were captured using DSLR (digital single-reflex lens) cameras with a sensor of > 10 megapixels and in a manner that certain requirements were satisfied, contributing to the aims of the research. The line of the horizon was, in general, at the upper third of the photographs, in order for the rule of thirds to be satisfied, e.g., [15] and for the terrestrial landscape to be emphasized. Additionally, the season of the year (May–June 2017) and the time of the day (2 p.m.–4 p.m.) that the photographs were captured were similar, and so were the atmospheric and lighting conditions.
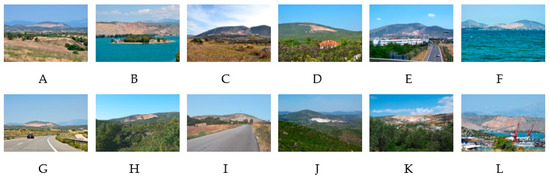
Figure 1.
The 12 mining landscape photographs that were used as visual stimuli for the eye tracking experiment. The characteristics of these landscapes are different so as for the represented landscapes to be substantially differentiated. Photographs (A,C) represent mixed agricultural/mining landscapes; (B,F) are mining landscapes dominated by the water element; (D,H,J) represent mixed forest/mining landscapes; (E,G,I,K,L) are mining landscapes including artificial elements.
Regarding the ‘character’ of these landscapes, there was a purposeful endeavor to capture photographs from mining landscapes characterized by different:
- composition and level of heterogeneity/diversity (e.g., different vegetation cover percentages, presence/absence of water elements, human-made elements, etc.);
- textures (e.g., sometimes uniform textures, some other times alternation between coarse and fine textures, etc.);
- degrees of chromatic contrast between the excavated surface and the rest of the landscape;
- shapes and sizes of the excavated surface, etc.
2.1.2. Participants and Viewing Procedure
For the eye tracking experiment, 20 participants–observers—between 21 and 55 years old, 9 females and 11 males, 9 experts and 11 non-experts—participating voluntarily were asked to attentively observe the 12 mining landscape photographs, displayed in a computer monitor at a random order for 10 s each, under free-viewing conditions. Thus, the participants were not asked to perform any cognitive task (e.g., to compare the excavated surface with its surroundings) but rather to view the landscape photographs at their own will, as if they were observing a landscape in everyday life. In addition, the participants neither had any particular familiarity with the photographs displayed nor were informed about the aims for carrying out the experiment; they were only given the necessary information regarding the experimental apparatus and “regarding the requirements for the orderly and effective experimental performance” [12] (p. 613). The vision of the participants was normal or corrected to normal (participants wearing eyeglasses were asked to wear contact lenses instead), whereas the use of mascara or eyelash extensions was forsaken for avoiding erroneous eye movement recordings. Lastly, for the separation between experts and non-experts, the criterion of expertise by [16] (p. 69) was used and extended, and therefore, “participants who [were] actively working or studying in landscape [or environmental mining] related fields were assigned to the [expert] group”; otherwise, the participants were assigned to the non-expert group.
2.2. Methods
2.2.1. Eye Movement Recording and Processing
The eye movement (gaze) recording procedure was carried out with the aid of a set of experimental apparatus consisting of the eye tracking system—Viewpoint Eye Tracker® by Arrington Research—a PC, and two computer monitors. A 19 inch monitor with a resolution of 1280 × 1024 pixels was used as the display monitor for conducting the eye tracking experiment. The distance between the display monitor and the participants’ eyes (while the participants were appropriately seated) was 60 cm. The system’s sampling rate was 60 Hz (gaze records every 16.67 ms), while its spatial accuracy was between 0.25–1.00° of the visual arc. Detailed characteristics and information about the eye tracking equipment and the calibration process can be found in [17,18], whereas the specific instructions given to the participants are similar to those described in (12,16).
The initial (raw) data collected during tracking the 20 participants–observers’ gaze was transformed into main eye tracking metrics, i.e., fixations and saccades, using OGAMA (Open Gaze and Mouse Analyzer) (5.0), an open-source software designed for the manipulation and analysis of eye movements [19]. Further analysis of the gaze recordings was based on visualization techniques enabled by the creation of focus heatmaps.
2.2.2. Qualitative Analysis: Attention Heatmaps vs. Saliency Maps
Initially, attention (focus) heatmaps were produced per landscape photograph for (i) all the (20) observers and (ii) the two sub-groups of the observers (9 experts and 11 non-experts). These aggregate visualizations—12 for the experts, 12 for the non-experts, and 12 for all the observers (36 heatmaps in total)—were calculated and visualized in the OGAMA (5.0) software, based on the fixation duration of each observer [19], revealing the main trend of the attention allocation of these three (sub)groups for each one of the 12 mining landscapes. More specifically, the areas of increased focus of attention in each mining landscape were identified. On the other hand, the corresponding 12 saliency maps were also produced for every mining landscape photograph, based on the GBVS (Graph-Based Visual Saliency) model, by utilizing a MATLAB ® scripting provided by [20].
Afterwards, the focus maps of all the observers and of the two sub-groups were examined to identify the main areas of focus. Additionally, these focus maps were compared to the saliency maps for each photograph; visual inspection was conducted to decide whether and to what degree the aggregate results of the experimental procedure matched the theoretical predictions of the attention attraction. Further qualitative comparisons were made between the focus maps of the two sub-groups and the saliency maps.
3. Results
The focus heatmaps of the two sub-groups (experts and non-experts) and of all the observers are displayed in Figure 2, per mining landscape photograph, along with the corresponding saliency maps.
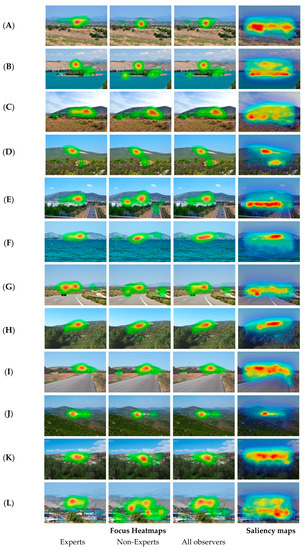
Figure 2.
Focus heatmaps and saliency maps for each of the 12 mining landscapes of Figure 1 (rows). The focus heatmaps result from the gaze movements of the experts, non-experts, and all observers. The saliency maps at the rightmost column of the figure are computed based on the GBVS model.
3.1. Focus Heatmaps
At first, by visually inspecting the heatmaps, the actual focus of attention of the participants was allocated very heavily inside the quarries’ excavated areas in almost all cases, regardless of the observer group. Both experts and non-experts focused their visual attention mainly within the mining areas. Nevertheless, in a more detailed examination, some differences between the observation patterns of experts and non-experts emerge: in general, it appears that the experts present much more concentrated observation patterns within the quarry areas.
Especially for landscapes characterized by great heterogeneity or complexity and in which attention ‘distractors’ are present, the variations between such observation patterns are more intense; the attention of non-experts may be allocated on other elements of the landscape, aside from the excavated surface. Contrarily, the attention distribution of the experts remains rather “compact” and almost dominantly focused within the quarry. Typical examples are the mining landscapes represented by photographs E and L. In these photographs, the other human-made constructions or elements/activities of the landscapes significantly attract the attention of non-experts, while the observation patterns of experts remain quite robustly within the excavations. However, in landscapes with a great deal of uniformity and where the quarry is an element of differentiation, the observation patterns of experts and non-experts are almost identical (photographs: H, J, D, and F).
3.2. Focus Heatmaps and Saliency Maps: Comparisons
Saliency maps predict the attention in a very effective way, precisely when the quarry is a distinct element in an otherwise uniform background (photos H, J, D, and F). Other landscapes (photos G and I) are of particular interest, since they are characterized by a moderate heterogeneity, while the corresponding saliency maps render the attention distribution in a fairly enlarged area—including the excavations. Nonetheless, the experimentally determined distribution of attention occurs in a rather concentrated area, chiefly within the quarries. It seems reasonable to hypothesize that the presence of roads (axes) in these landscapes (axial) may affect the attraction of attention; the formation of conditions of directionality may affect the actual—yet not the anticipated—focus of attention.
In general, saliency models reflect the attention of non-experts better than that of experts. This finding is more pronounced for more complex and semantically rich landscapes (e.g., photographs E and L), where the more expanded observational patterns of non-experts are better simulated by the theoretical predictions. Of course, for some landscapes (especially A and C), saliency maps predict quite different attention concentration areas than those obtained experimentally. In any case, overall, for half of the represented landscapes, the saliency maps render quite satisfactorily the experimentally recorded visual attraction, while for a third of these landscapes, the experimentally derived attention patterns and those of the computational models almost coincide.
4. Discussion
Saliency maps can constitute adequate—or even appropriate—substitutes for anticipating the visual attention focus, yet not in all cases. Landscape composition and structure, along with other meaningful cues included in different mining landscapes, differentiate the effectiveness of the visual attention prediction. In practice, saliency maps (GBVS) ‘yield’ almost identical patterns with those of focus heatmaps of actual observers in more ‘typical’ mining landscapes, i.e., where the excavated surface dominates upon an otherwise uniform landscape. This echoes the findings of research studies regarding urbanization: saliency models’ “predictions of the viewing pattern in rural landscapes with a limited [number] of buildings [are] most reliable” [9] (p. 16). Increased levels of diversity and complexity tend to induce more expanded viewing exploration and more dispersed observation patterns [21], further engaging top-down processes.
Aside from the mining landscape type, saliency maps tend to better simulate non-experts’ observation patterns. This is especially pronounced in less ‘typical’ mining landscapes that are more diverse and complex. This finding accords with the theory too, since non-experts’ viewing behaviors are less affected by domain-specific knowledge (top-down processes) while observing landscapes where quarries and other mining infrastructures/operations exist. In this sense, non-experts’ observation patterns while free-viewing mining landscapes tend to be affected mainly by bottom-up processes [22], and that is why their patterns are better approached by the saliency maps, which, by definition, reflect the informational content and the purely bottom-up properties of the visual stimuli [8,9].
5. Conclusions
One of the most important aspects towards approaching the visual nuisance from open pit–pit mines is the way that the latter are visually perceived. In this paper, the experimentally derived attention patterns from the observation of a range of different mining landscapes were compared to the predicted focus of attention derived by saliency models for the same landscapes. By combining these novel techniques in the domain of environmental mining, it was shown that one can anticipate to a fair extent the focus of attention across several mining landscapes. However, the reliability of this methodology will not be equal for all types of mining landscapes, i.e., for typical mining landscapes, whereby the attention is almost exclusively focused within the excavated areas, saliency models’ predictions are extremely reliable. This reliability tends to dwindle for more complex and semantically rich mining landscapes. For such landscapes, the deviations are conspicuous both between focus and saliency maps and between experts and non-experts’ patterns, with the saliency maps better anticipating non-experts’ visual attention patterns.
Author Contributions
Conceptualization, L.-M.M. and M.M.; methodology, L.-M.M.; software, L.-M.M.; validation, L.-M.M.; investigation, L.-M.M.; resources, L.-M.M. and M.M.; data curation, L.-M.M.; writing—original draft preparation, L.-M.M.; writing—review and editing, M.M.; visualization, L.-M.M.; supervision, M.M. All authors have read and agreed to the published version of the manuscript.
Funding
This research received no external funding.
Institutional Review Board Statement
Ethical review and approval were waived for this study, due to the fact that the participants were not exposed to any potential threat or arduous task other than freely observing a dozen of landscape photographs for less than three minutes of the hour.
Informed Consent Statement
Informed consent was obtained from all subjects involved in the study.
Data Availability Statement
The data presented in this study are openly available in Mendeley at DOI: 10.17632/pwbvcbdszx.1.
Conflicts of Interest
The authors declare no conflict of interest.
References
- Hartman, H.L.; Mutmansky, J.M. Introductory Mining Engineering; John Wiley & Sons: Hoboken, NJ, USA, 2002; pp. 1–24. [Google Scholar]
- Dulias, R. The Impact of Mining on the Landscape: A Study of the Upper Silesian Coal Basin in Poland; Springer: Cham, Switzerland, 2016; pp. 1–30. [Google Scholar]
- Menegaki, M.E.; Kaliampakos, D.C. Landscape analysis as a tool for surface mining design. Environ. Plan. B Plan. Des. 2006, 33, 185–196. [Google Scholar] [CrossRef]
- Dentoni, V.; Massacci, G. Assessment of visual impact due to surface mining with the Lvi method. In Legislation, Technology and Practice of Mine Land Reclamation; Hu, Z., Ed.; Taylor & Francis Group: London, UK, 2015; pp. 527–534. [Google Scholar]
- Council of Europe. The European Landscape Convention—Firenze, 20X. 2000 (ETS No. 176) Official Text in English; Council of Europe: Strasbourg, France, 2000. [Google Scholar]
- The Landscape Institute, and Institute of Environmental Management and Assessment. Guidelines for Landscape and Visual Impact Assessment, 2nd ed.; Spon Press: London, UK; New York, NY, USA, 2002; pp. 3–18. [Google Scholar]
- Duchowski, A. Eye Tracking Methodology: Theory and Practice; Springer International Publishing: Berlin, Germany, 2017; pp. 159–174. [Google Scholar]
- Itti, L. Visual salience. Scholarpedia 2007, 2, 3327. [Google Scholar] [CrossRef]
- Dupont, L.; Ooms, K.; Antrop, M.; Van Eetvelde, V. Comparing saliency maps and eye-tracking focus maps: The potential use in visual impact assessment based on landscape photographs. Landsc. Urban Plan. 2016, 148, 17–26. [Google Scholar] [CrossRef]
- Henderson, J.M. Eye movements and scene perception. In The Oxford Handbook of Eye Movements; Liversedge, S., Gilchrist, I., Eds.; Oxford University Press: Oxford, UK, 2011; pp. 593–606. [Google Scholar]
- Wade, N.J.; Tatler, B.W. Origins and applications of eye movement research. In The Oxford Handbook of Eye Movements; Liversedge, S., Gilchrist, I., Eds.; Oxford University Press: Oxford, UK, 2011; pp. 17–43. [Google Scholar]
- Misthos, L.M.; Pavlidis, A.; Karabassakis, E.; Menegaki, M.; Krassanakis, V.; Nakos, B. Exploring the visual impact from open pit mines applying eye movement analyses on mining landscape photographs. Int. J. Min. Reclam. Environ. 2020, 34, 609–624. [Google Scholar] [CrossRef]
- Bojko, A.A. Informative or misleading? Heatmaps deconstructed. In Human-Computer Interaction. New Trends. In Proceedings of the International Conference on Human-Computer Interaction, San Diego, CA, USA, 19–24 July 2009; Jacko, J.A., Ed.; Springer: Berlin/Heidelberg, Germany, 2009; pp. 30–39. [Google Scholar]
- Misthos, L.-M.; Pavlidis, A.; Menegaki, M.; Krassanakis, V. Exploring the Perception of Mining Landscapes Using Eye Movement Analysis. In ET4S Eye Tracking for Spatial Research, Proceedings of the 3rd International Workshop Zurich; Kiefer, P., Giannopoulos, I., Göbel, F., Raubal, M., Duchowski, A.T., Eds.; ETH Zurich: Zurich, Switzerland, 2018; pp. 46–51. [Google Scholar]
- Svobodova, K.; Sklenicka, P.; Molnarova, K.; Vojar, J. Does the composition of landscape photographs affect visual preferences? The rule of the Golden Section and the position of the horizon. J. Environ. Psychol. 2014, 38, 143–152. [Google Scholar] [CrossRef]
- Dupont, L.; Antrop, M.; Van Eetvelde, V. Does landscape related expertise influence the visual perception of landscape photographs? Implications for participatory landscape planning and management. Landsc. Urban Plan. 2015, 141, 68–77. [Google Scholar] [CrossRef] [Green Version]
- Krassanakis, V.; Filippakopoulou, V.; Nakos, B. An application of eye tracking methodology in cartographic research. Proc. Eye Track Behav. 2011. [Google Scholar]
- Krassanakis, V.; Filippakopoulou, V.; Nakos, B. Detection of moving point symbols on cartographic backgrounds. J. Eye Mov. Res. 2016, 9, 1–16. [Google Scholar] [CrossRef]
- Voßkühler, A.; Nordmeier, V.; Kuchinke, L.; Jacobs, A.M. OGAMA (Open Gaze and Mouse Analyzer): Open-source software designed to analyze eye and mouse movements in slideshow study designs. Behav. Res. Methods 2008, 40, 1150–1162. [Google Scholar] [CrossRef] [PubMed] [Green Version]
- Harel, J.; Koch, C.; Perona, P. Graph-based visual saliency. In Advances in Neural Information Processing Systems; MIT press: Cambridge, MA, USA, 2006; pp. 545–552. [Google Scholar]
- Dupont, L.; Ooms, K.; Duchowski, A.T.; Antrop, M.; Van Eetvelde, V. Investigating the visual exploration of the rural-urban gradient using eye-tracking. Spat. Cogn. Comput. 2017, 17, 65–88. [Google Scholar] [CrossRef]
- Dupont, L.; Antrop, M.; Van Eetvelde, V. Eye-tracking analysis in landscape perception research: Influence of photograph properties and landscape characteristics. Landsc. Res. 2014, 39, 417–432. [Google Scholar] [CrossRef]
Publisher’s Note: MDPI stays neutral with regard to jurisdictional claims in published maps and institutional affiliations. |
© 2021 by the authors. Licensee MDPI, Basel, Switzerland. This article is an open access article distributed under the terms and conditions of the Creative Commons Attribution (CC BY) license (https://creativecommons.org/licenses/by/4.0/).