Abstract
Automated and robotic welding have become standard practices in manufacturing, requiring precise control to maintain weld quality without relying on skilled welders. In Tungsten Inert Gas (TIG) welding, monitoring the weld pool is crucial for ensuring the necessary weld penetration, which is vital for maintaining weld integrity. Real-time observation is essential to prevent defects and improve weld quality. Various sensing technologies have been developed to address this need, with vision-based systems showing particular effectiveness in enhancing welding quality and productivity within the framework of Industry 4.0. This review looks at the latest technologies for monitoring weld pools and bead shapes. It covers methods like using Complementary Metal-Oxide Semiconductors (CMOS) to take clear images of the melt pool for better process identification, Active Appearance Model (AAM) to capture 3D images of the weld pool for accurate penetration measurement, and Charge-Coupled Devices (CCD) and Laser-Induced Breakdown Spectroscopy (LIBS) to analyze plasma spectra and create material composition graphs.
1. Introduction
Tungsten Inert Gas (TIG) welding utilizes a tungsten electrode [1,2,3] that does not melt to produce an arc for melting and fusing metals. Originally developed in the late 1930s for aluminum and magnesium welding, the technique was enhanced by advancements in inert gas shielding technology by 1940 in the USA. TIG welding is also referred to as Gas Tungsten Arc Welding (GTAW) [1]. It later expanded to include welding copper and steel alloys [4,5]. TIG welding prevents atmospheric tarnishing by using an inert gas [6] like Argon (Ar) [1,2,3,5,6,7], Hydrogen [7], Nitrogen [6,8], Oxygen [1,7,9,10], CO2 [6], Helium [2,6,7], or a combination of these gases. Renowned for producing high-quality welds with cost-effective equipment, TIG welding is widely used in the industrial sector due to its flexibility, arc stability and controlled weld pool [10], good protection effect, consistent process, less material splash, and superior weld quality [7]. Mainly, this TIG process enables welding in all positions [10].
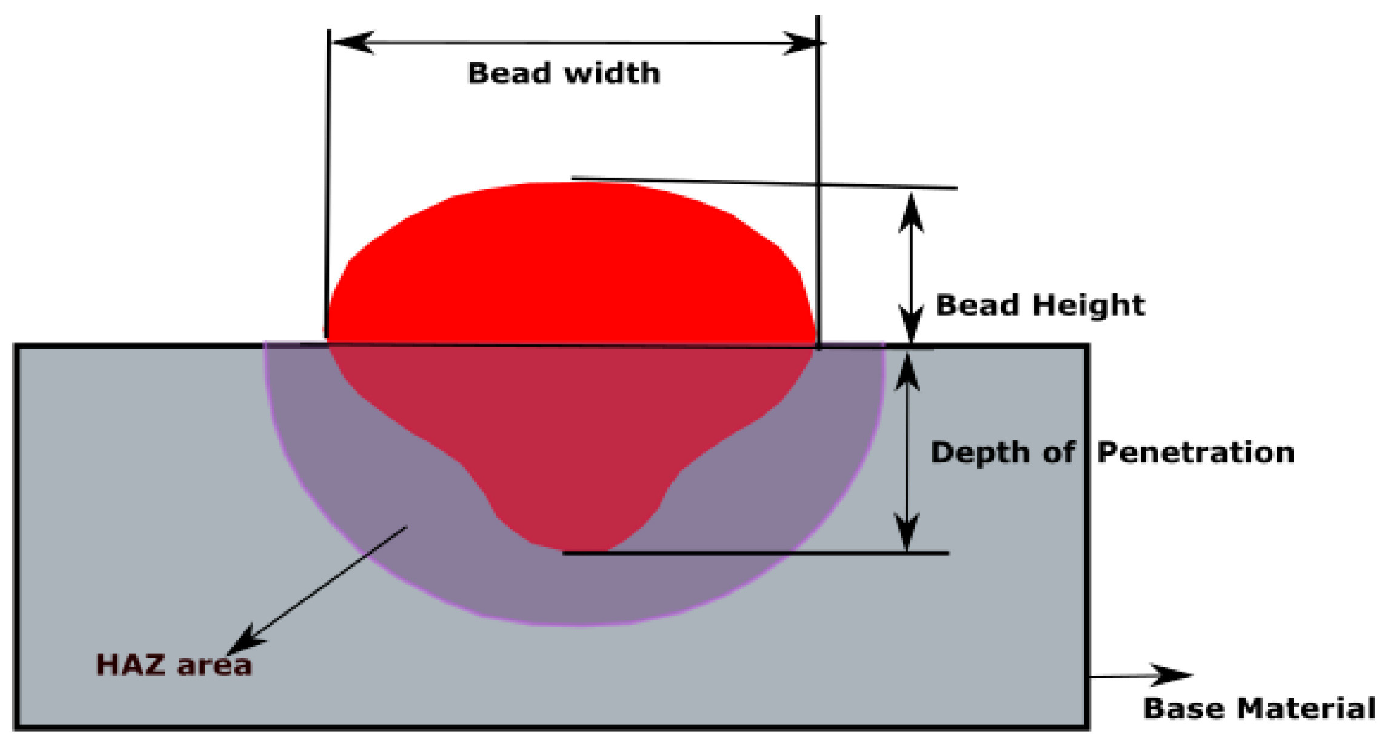
TIG welding is essential for manufacturing components in the aerospace [4,10], nuclear [4], automotive [4], shipbuilding [5,11], oil and gas [1] and military sectors [4,10]. A non-consumable electrode is crucial for creating a strong electric arc, which melts the base metal for high-quality welds [2,3,12,13]. Thermionic emission is the initial stage of the process, where an electric current passes through an electrode and heats it due to the Joule effect. This heating energizes the electrons to overcome the material’s work function, causing them to emit from the surface. This emission ionizes the shielding gas and creates a plasma. Additionally, ion bombardment from the ionized gas and plasma interaction further heats the electrode tip [3]. Process parameters significantly influence weld quality based on weld pool geometry, making it crucial to identify optimized values. The weld quality, including bead height, width, Weld Pool Penetration and the Heat-Affected Zone (HAZ) [2,8,9,10,11,12,14,15,16,17], is shown in Figure 1 [14].
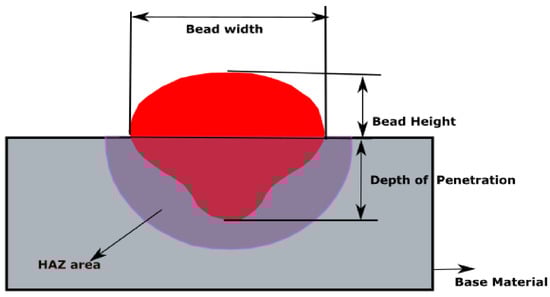
Figure 1.
Weld bead geometry [2].
Common bead geometry issues during welding include excessive fusion width [2], HAZ problems, incorrect bead height, cracks, lack of penetration, and porosity [17,18,19,20]. These defects can compromise the strength and load-bearing capacity of the welded joint. Specifically, lack of penetration and cracks can diminish the joint’s strength and fatigue life by increasing internal stress and facilitating the propagation of fractures [2]. Controlled weld bead geometry leads to good mechanical characteristics and morphological properties. By varying welding current (A), electrode diameter (mm), Travel speed of the welding torch (cm/min), and shielding gas (L/min), optimal parameters can be determined [2,13,14].
Expert welders can observe the weld pool and make real-time adjustments to welding parameters, such as the travel speed of the welding torch, welding arc voltage, and welding current, to achieve the desired weld geometry, including penetration depth, bead width, and bead height. The growing shortage of skilled welders, combined with the increasing need for automation in industrial processes, has driven a substantial rise in research aimed at automating and optimizing welding process parameters [2,11]. To meet this challenge, several methods have been implemented to ensure high-quality welds. These methods include Design of Experiments (DoE) techniques [2,4,8,12] and real-time monitoring with cameras or spectrometers for analyzing weld bead geometry.
Industry 4.0 focuses on the integration of sensors, IoT connectivity, quality control [21,22,23], and data analytics through machine learning. These technologies enable the development of a feedback system that enhances the welding process [24,25], improving quality, productivity, and safety. A major aspect of Industry 4.0 is the real-time communication between the welding power source and a computer system, which automatically adjusts welding parameters based on continuous feedback and monitoring [26,27,28].
Currently, extensive research is being conducted on online quality monitoring for welding due to the inherent complexity of the process’s physics and the lack of reliable, cost-effective commercial solutions. A vision monitoring system is used to screen the weld bead geometry on-line. This system utilizes cameras to capture high-resolution images, and sensors can be employed to record radiation spectrum information during TIG welding. Image acquisition is performed using cameras, such as Complementary Metal-Oxide Semiconductors (CMOS) [4,11], High Dynamic Range (HDR) [4], and Active Appearance Model (AAM) [20,21,22] cameras. For capturing the welding-plasma spectra and images, Charge-Coupled Devices (CCDs) [13,14,15,16,18,20] and Laser-Induced Breakdown Spectroscopy (LIBS) [13,23,24,25] are employed. Recent advancements in welding technology have greatly improved the precision and quality of welding operations. This review emphasizes the on-line monitoring of TIG weld pools, employing cutting-edge vision sensing technologies, such as CMOS, CCD, AAM, and LIBS. These technologies provide real-time data that are crucial for assessing the weld quality and performance.
2. Vision Sensing for TIG Weld Pool Monitoring
Vision-based solutions enhance remote TIG welding monitoring by focusing on the weld pool during the welding process. Various visual systems, such as CMOS, CCD, and LIBS, are widely used. CMOS technology is one of the industry’s oldest and most commonly used systems. During welding, the intense brightness of the welding arc can obscure the weld pool, reducing visual clarity. To address this issue, a CMOS camera captures images while controlling the light it receives, ensuring that the area around the arc is well-lit without causing overexposure [4,8,11]. Another technology, CCD, converts light into electronic signals, providing high-resolution imaging and spectral analysis. CCD spectrometers are used to acquire spectra of welding plasma, allowing for precise detection of emission lines [13,15]. These spectrometers also capture weld pool images during the base-current period of each pulse [14]. LIBS and AAM generate high-temperature plasma using a laser pulse on a sample’s surface. The fundamental structure of the substance is determined by examining the light reflected from this plasma [13,23,24,25].
2.1. CMOS
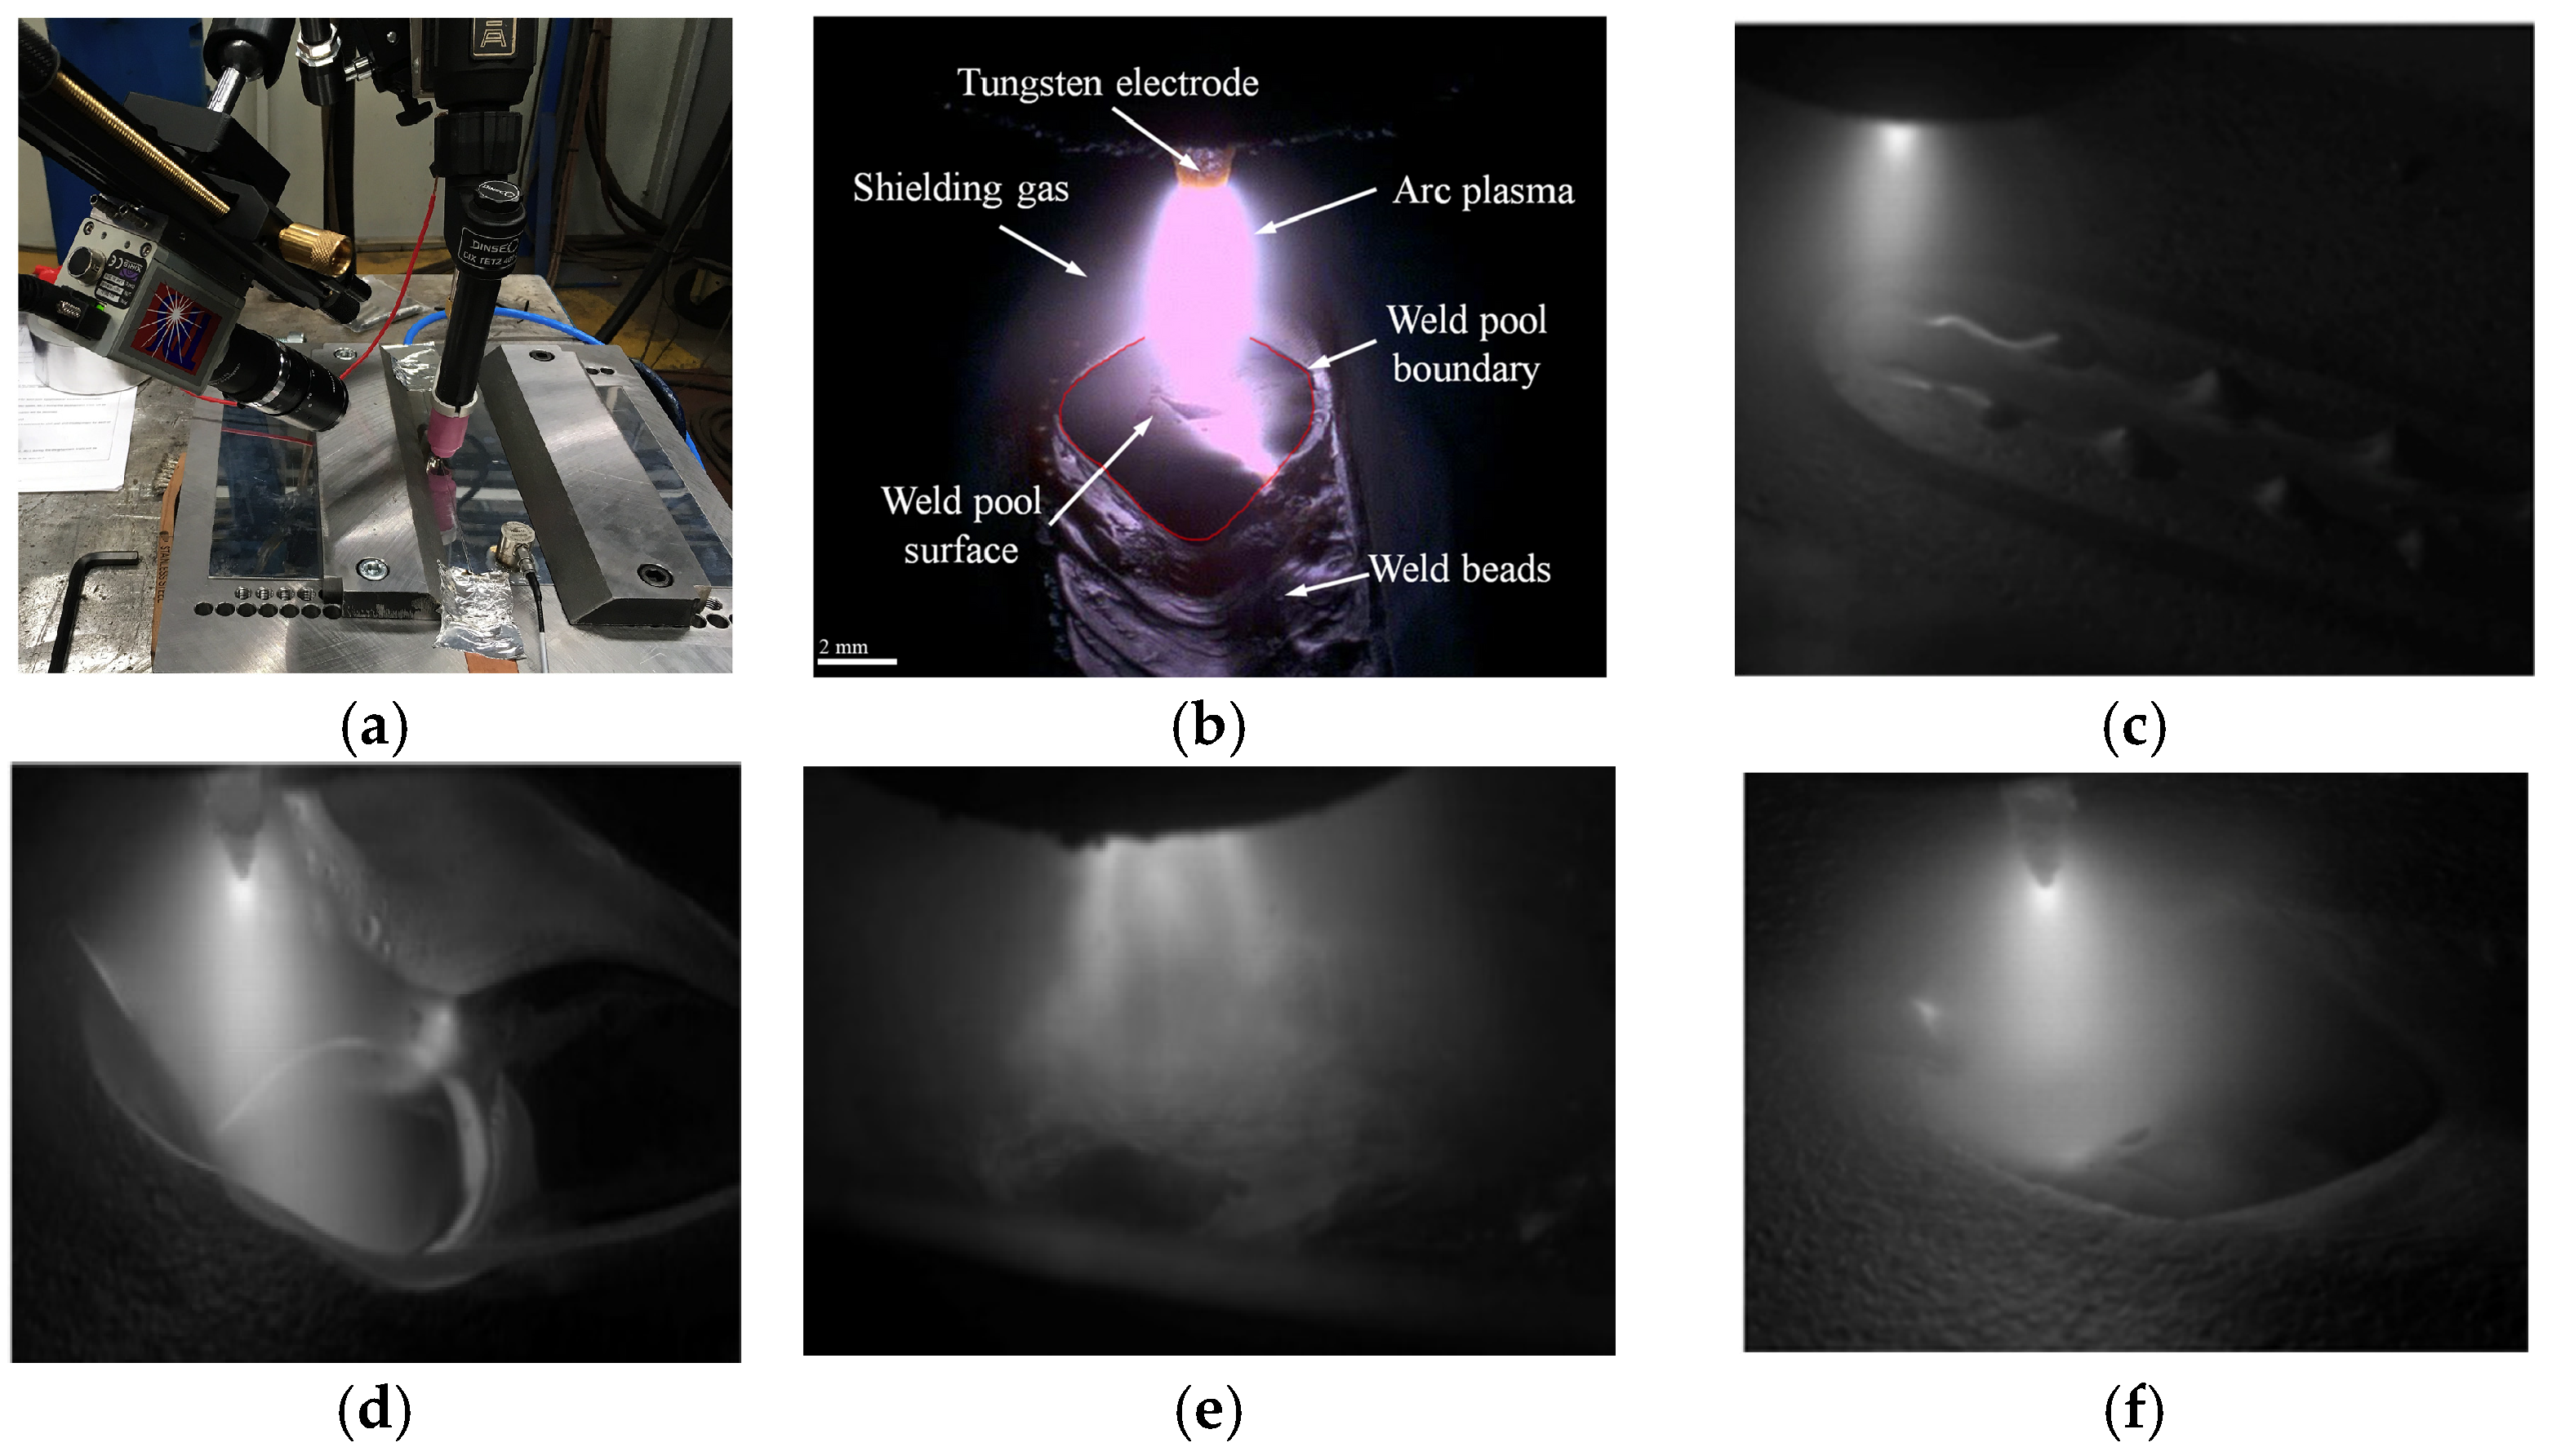
A CMOS sensor converts optical images into electrical signals using MOS (Metal Oxide Semiconductor) transistors. Each pixel in the sensor contains a photodiode and an MOS transistor, which work together to detect and switch electrical signals from each pixel to create an image. The CMOS camera (Xiris automation inc, Burlington, ON L7L 5Z1, Canada) is affixed to the robot holding the welding torch. It moves in coordination with the weld at a specific angle relative to the welding direction [4,11], as shown in Figure 2a. The camera captures images during welding, focusing on the weld pool and the area directly in front of the welding arc [14].

Figure 2.
(a) CMOS camera and TIG welding setup [4]; (b) CMOS-captured weld pool [11]; (c) improper fusion; (d) burn through; (e) excess gas formation; (f) proper weld [4].
Figure 2b illustrates the weld-pool-monitoring system that employs the CMOS camera to capture real-time images of the weld pool [11]. This system helps assess various weld bead conditions, including improper fusion, burn-through, and proper weld, as depicted in Figure 2c–f. These images are essential for evaluating the quality of the weld and making necessary adjustments to the welding parameters [4].
2.2. Active Appearance Model (AAM)
AAMs are generative models designed to represent specific visual phenomena. They are frequently used for pattern recognition to extract edge feature points from objects [20,21,22]. When integrated with CCD technology, this setup is referred to as the three-light-path sensing system [20]. This system comprises a CCD, optics, and specialized filtration systems to capture comprehensive images of the weld pool. Mirror 1 and mirror 2 are positioned at a 45° angle relative to the workpiece to image the front and back topside weld pools, while mirror 3 is placed directly underneath to capture the backside weld pool image. The light path is set at a 45° angle relative to each of the mirrors, mirror 1 through mirror 8, allowing the CCD to simultaneously collect detailed information from three different angles via distinct light paths. The schematic of the AAM platform is shown in Figure 3. After identifying the weld pool’s feature parameters, these parameters are associated with various penetration states.
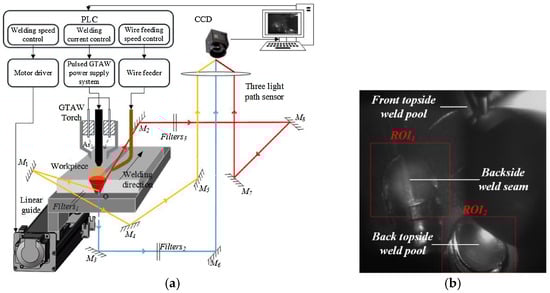
Figure 3.
(a) Diagram of a GTAW setup incorporating a sensing system with three separate optical paths. The red, yellow, and blue arrows indicate different light routes used by the sensor to observe key welding features such as the weld pool surface, penetration level, and the back side of the workpiece. (b) three distinct light pathways used to capture weld pool images [20].
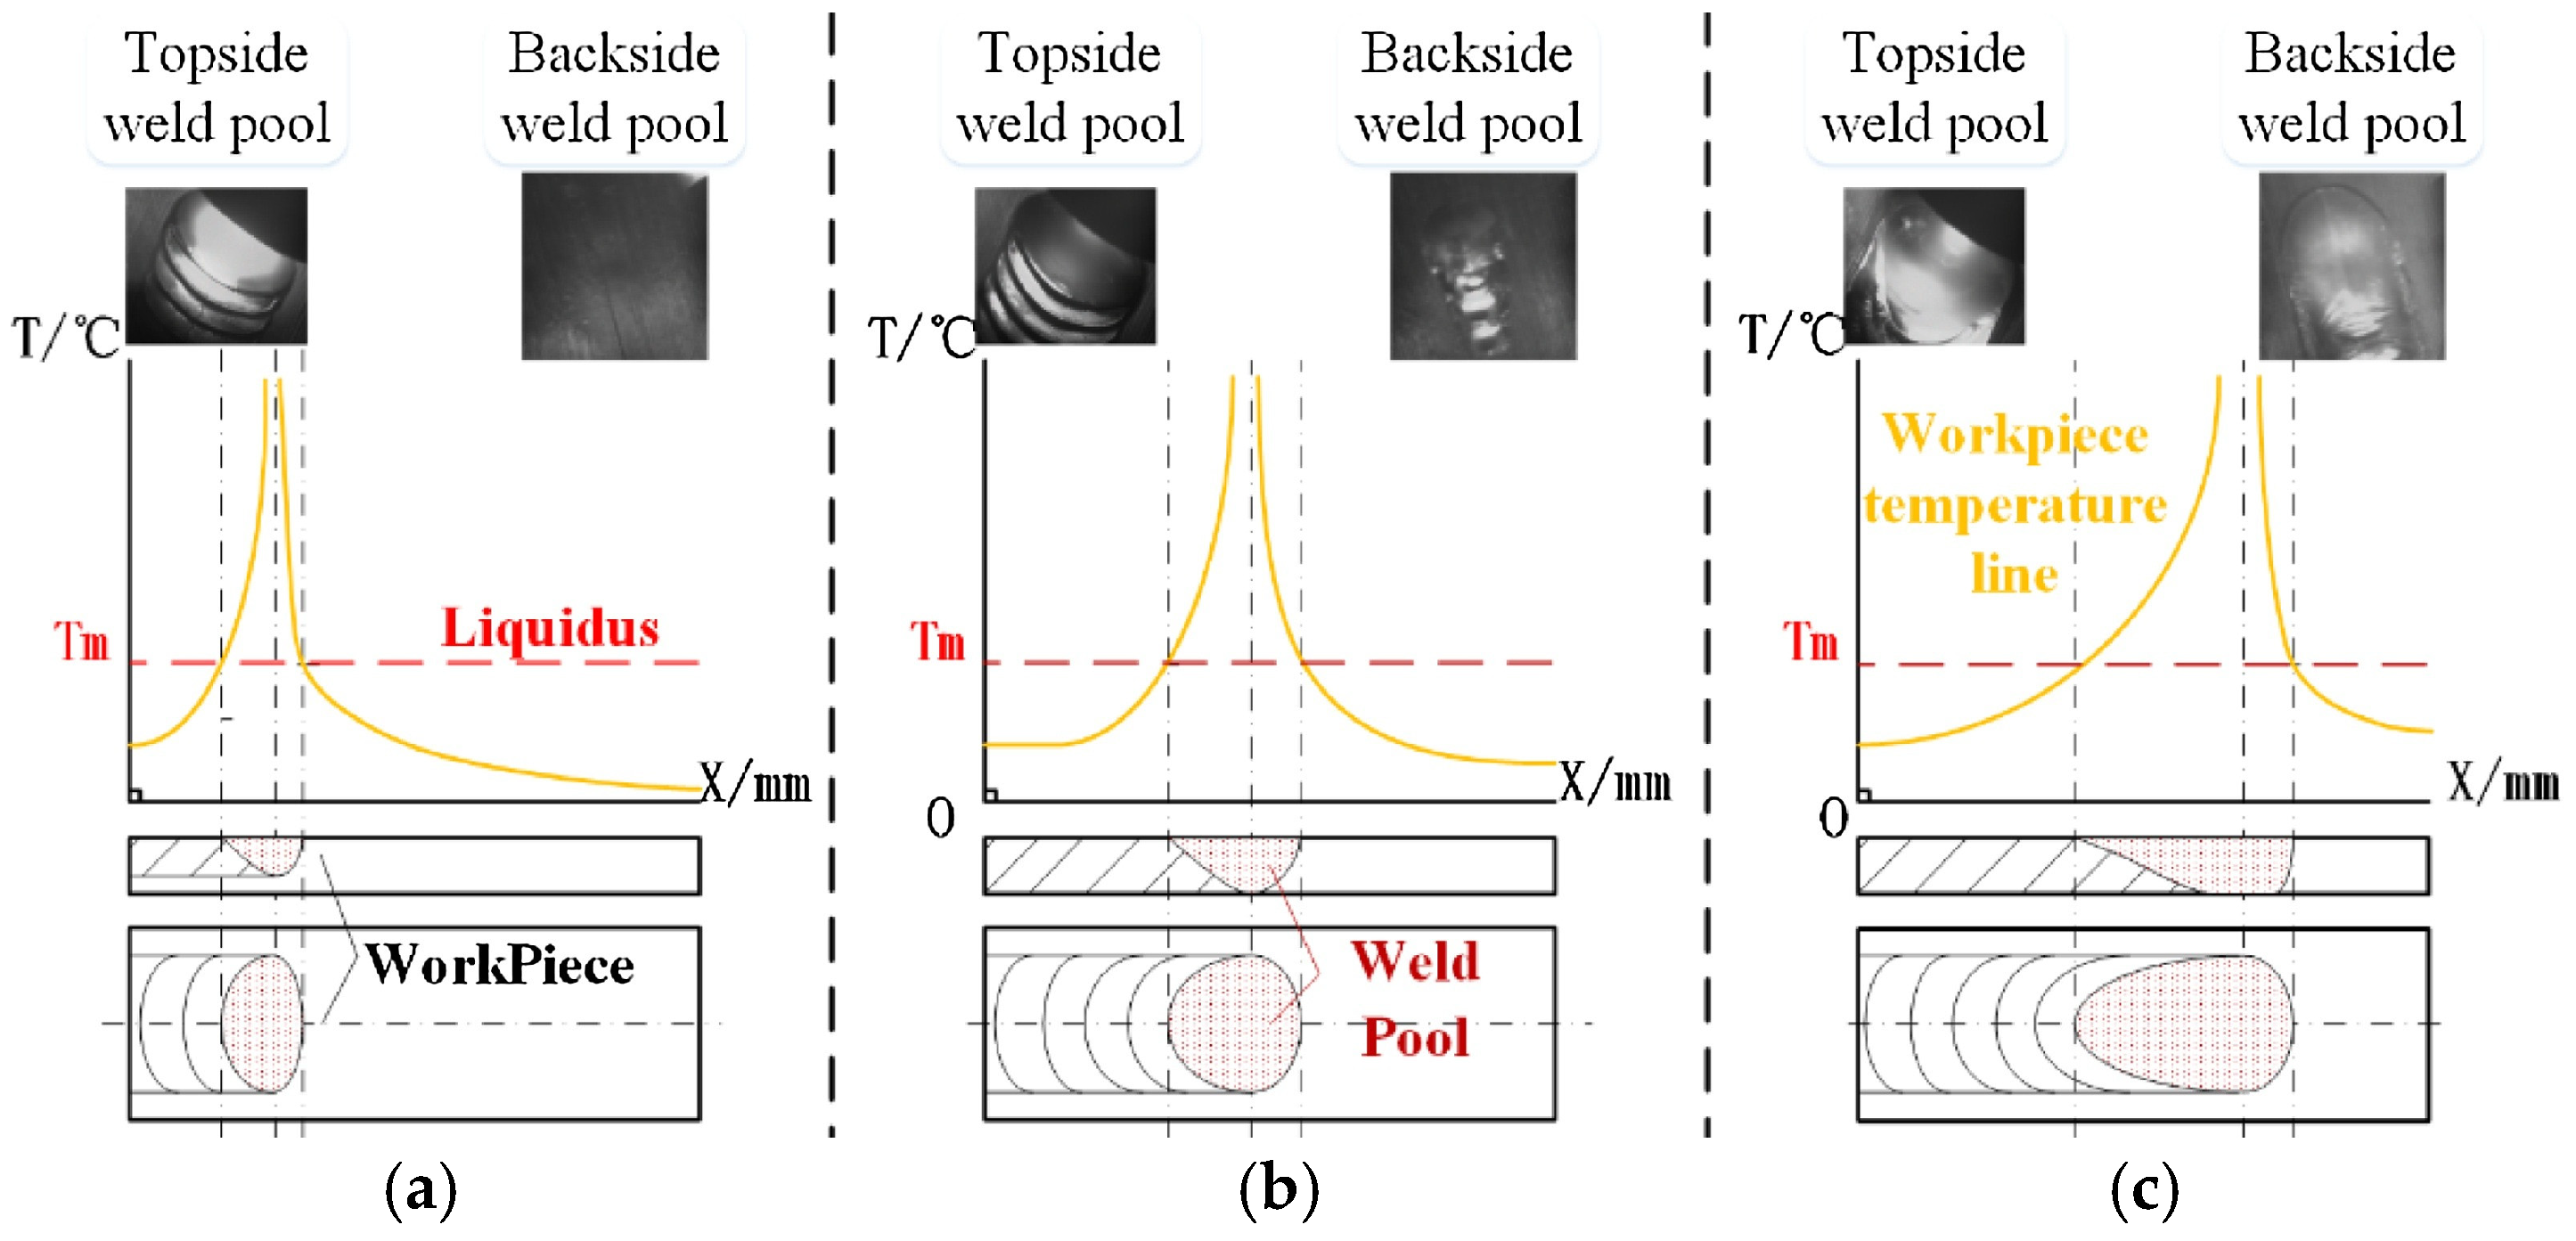
Figure 4 displays images obtained through these three light pathways: the front topside view, the backside weld seam view, and the back topside view [20]. The weld pool’s dimensions are affected by heat input during welding and heat accumulation in the base metal. Thus, analyzing the topside weld pool features provides valuable insights into penetration states. Three potential penetration scenarios are illustrated in Figure 4: (a) inadequate penetration, (b) moderate penetration, and (c) complete penetration. Nonetheless, accurately modeling welding penetration is challenging due to the complex, nonlinear, and dynamic nature of the thermal processes involved. The proposed method for evaluating GTAW penetration using pulsed signals primarily relies on extracting visual features from weld pool images through AAM. This technique measures key visual attributes, including the bead width and height of the weld pool. Compared to other visual models like CMOS, this method achieves a correlation coefficient of 92.23% for the extracted features [20].
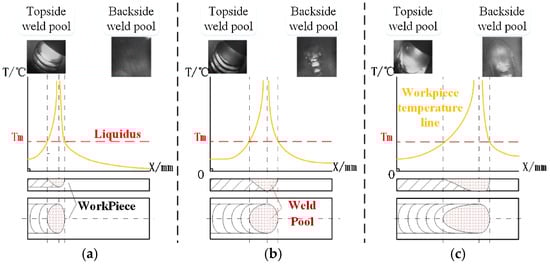
Figure 4.
Analysis of welding performance shows three possible states of penetration: (a) inadequate penetration; (b) moderate penetration; (c) complete penetration [20].
2.3. Charge-Coupled Devices (CCDs)
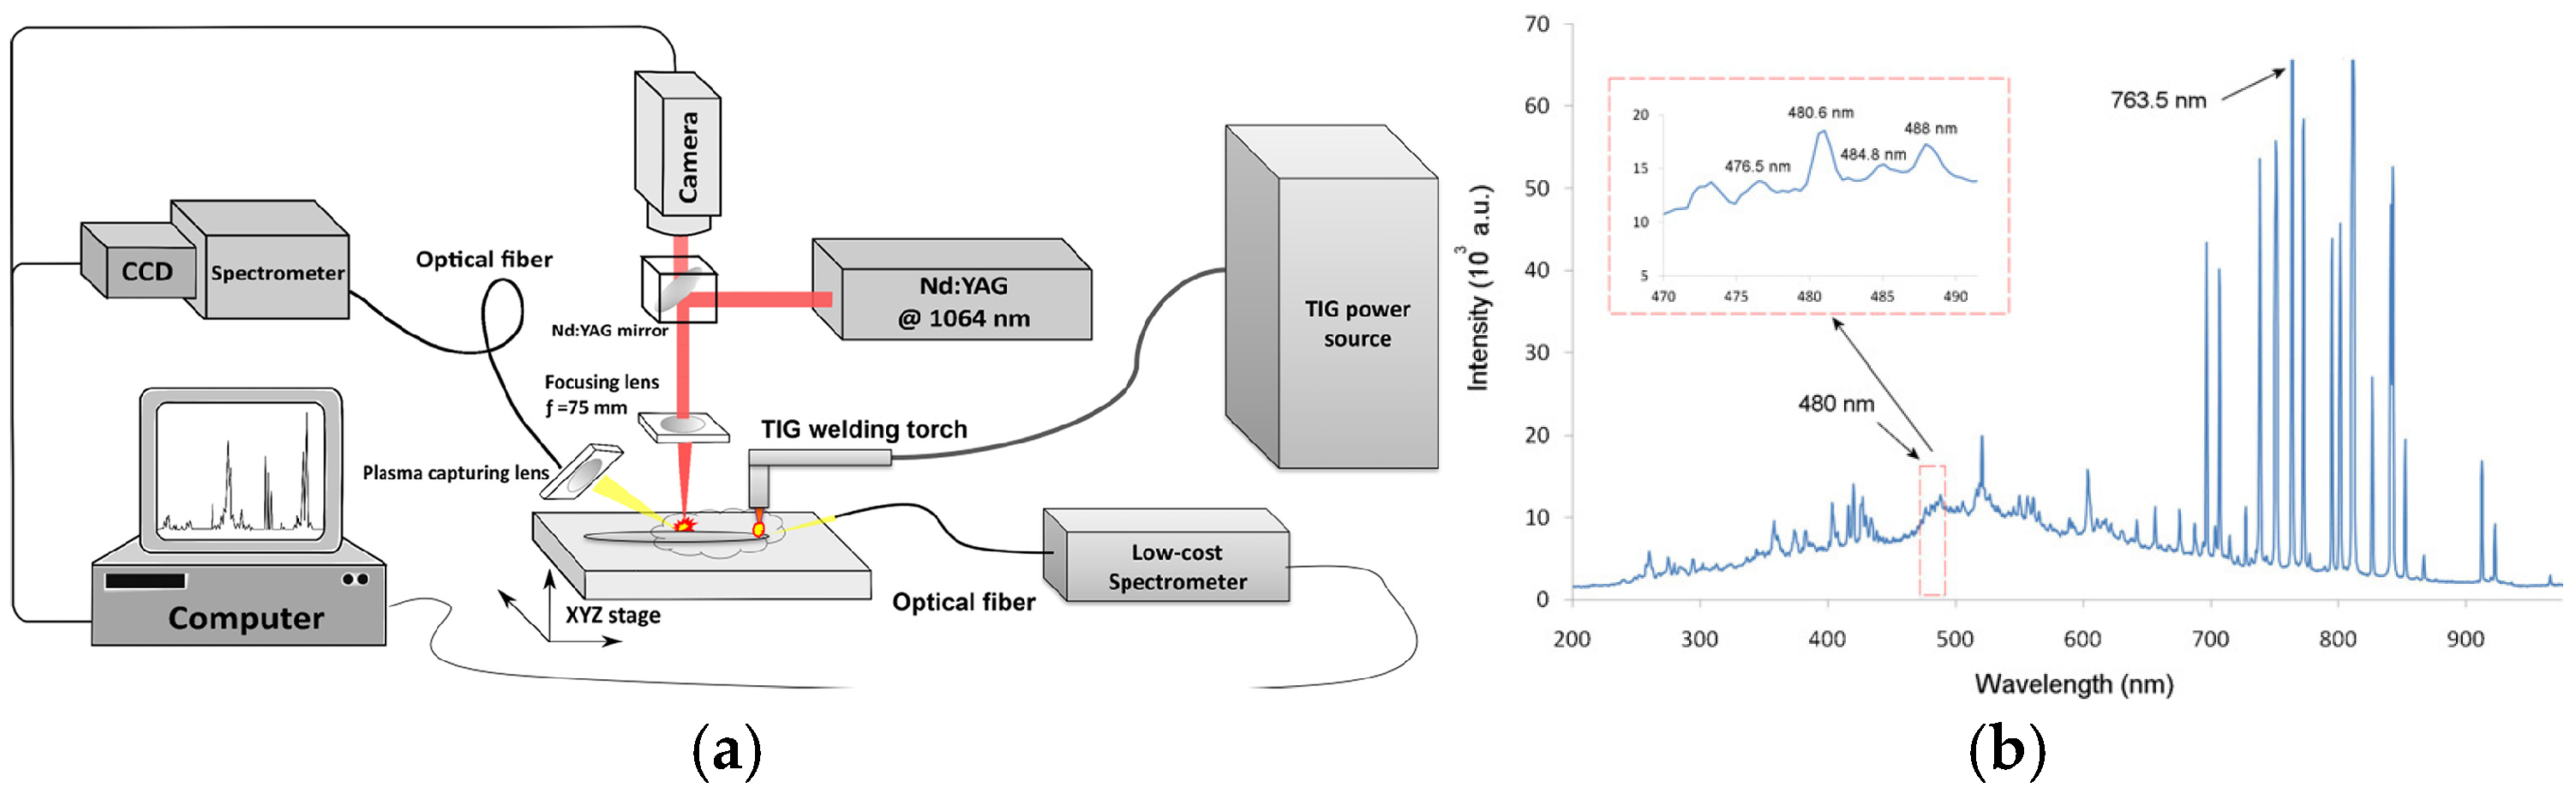
A CCD is a type of integrated circuit used for capturing images by transforming light into electronic signals. The sensor organizes the image into a grid of pixels, where each pixel generates an electrical charge based on the amount of light it detects. The magnitude of this charge correlates directly with the brightness of the pixel within the image. During arc welding, the welding torch and collimators remain fixed [13,16], while the positioner moves the plates to perform the seams. Plasma spectra (with central wavelengths at 480, 766, and 780 nm) are produced during the process and captured by a collimator. These data are transmitted through an optical fiber to a CCD spectrometer.
The CCD, equipped with photodiodes, then analyzes the plasma radiation to identify specific elements involved in the welding process or to conduct colorimetric analysis [13,15,16,18]. The Plasma Optical Spectroscopy experimental configuration is shown in Figure 5a [16]. The weld spectrometer captures a plot displaying the correlation between wavelength and intensity, with data recorded every 10 milliseconds [13]. During the presence of a defect, a noticeable shift occurs in the plasma spectra: the emission lines below 550 nm intensify, while the intensity of those above 700 nm diminishes significantly, as illustrated in Figure 5b [16].
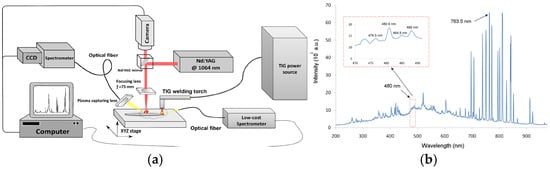
Figure 5.
(a) Plasma Optical Spectroscopy experimental configuration; (b) plasma spectrum graph [16].
2.4. LIBS
Photon emissions characteristic of a specific element are measured using a type of atomic emission spectroscopy known as Laser-Induced Breakdown Spectroscopy. In this process, a pulsed laser beam excites the sample, causing it to absorb radiation and evaporate. This evaporation forms a plasma, which emits a unique radiation as it cools. A spectrometer can then detect and analyze the emitted light [23,25,26]. Figure 6 shows the TIG welding process integrated with LIBS for real-time monitoring [25].
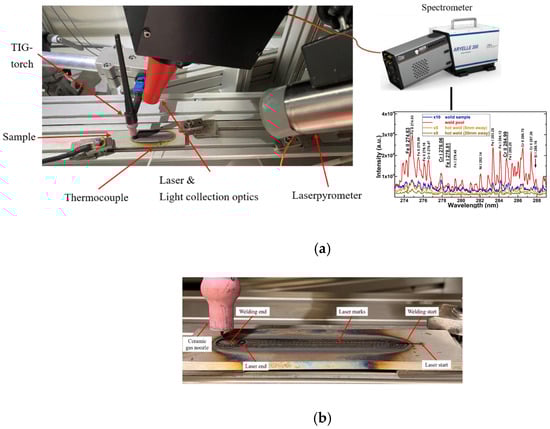
Figure 6.
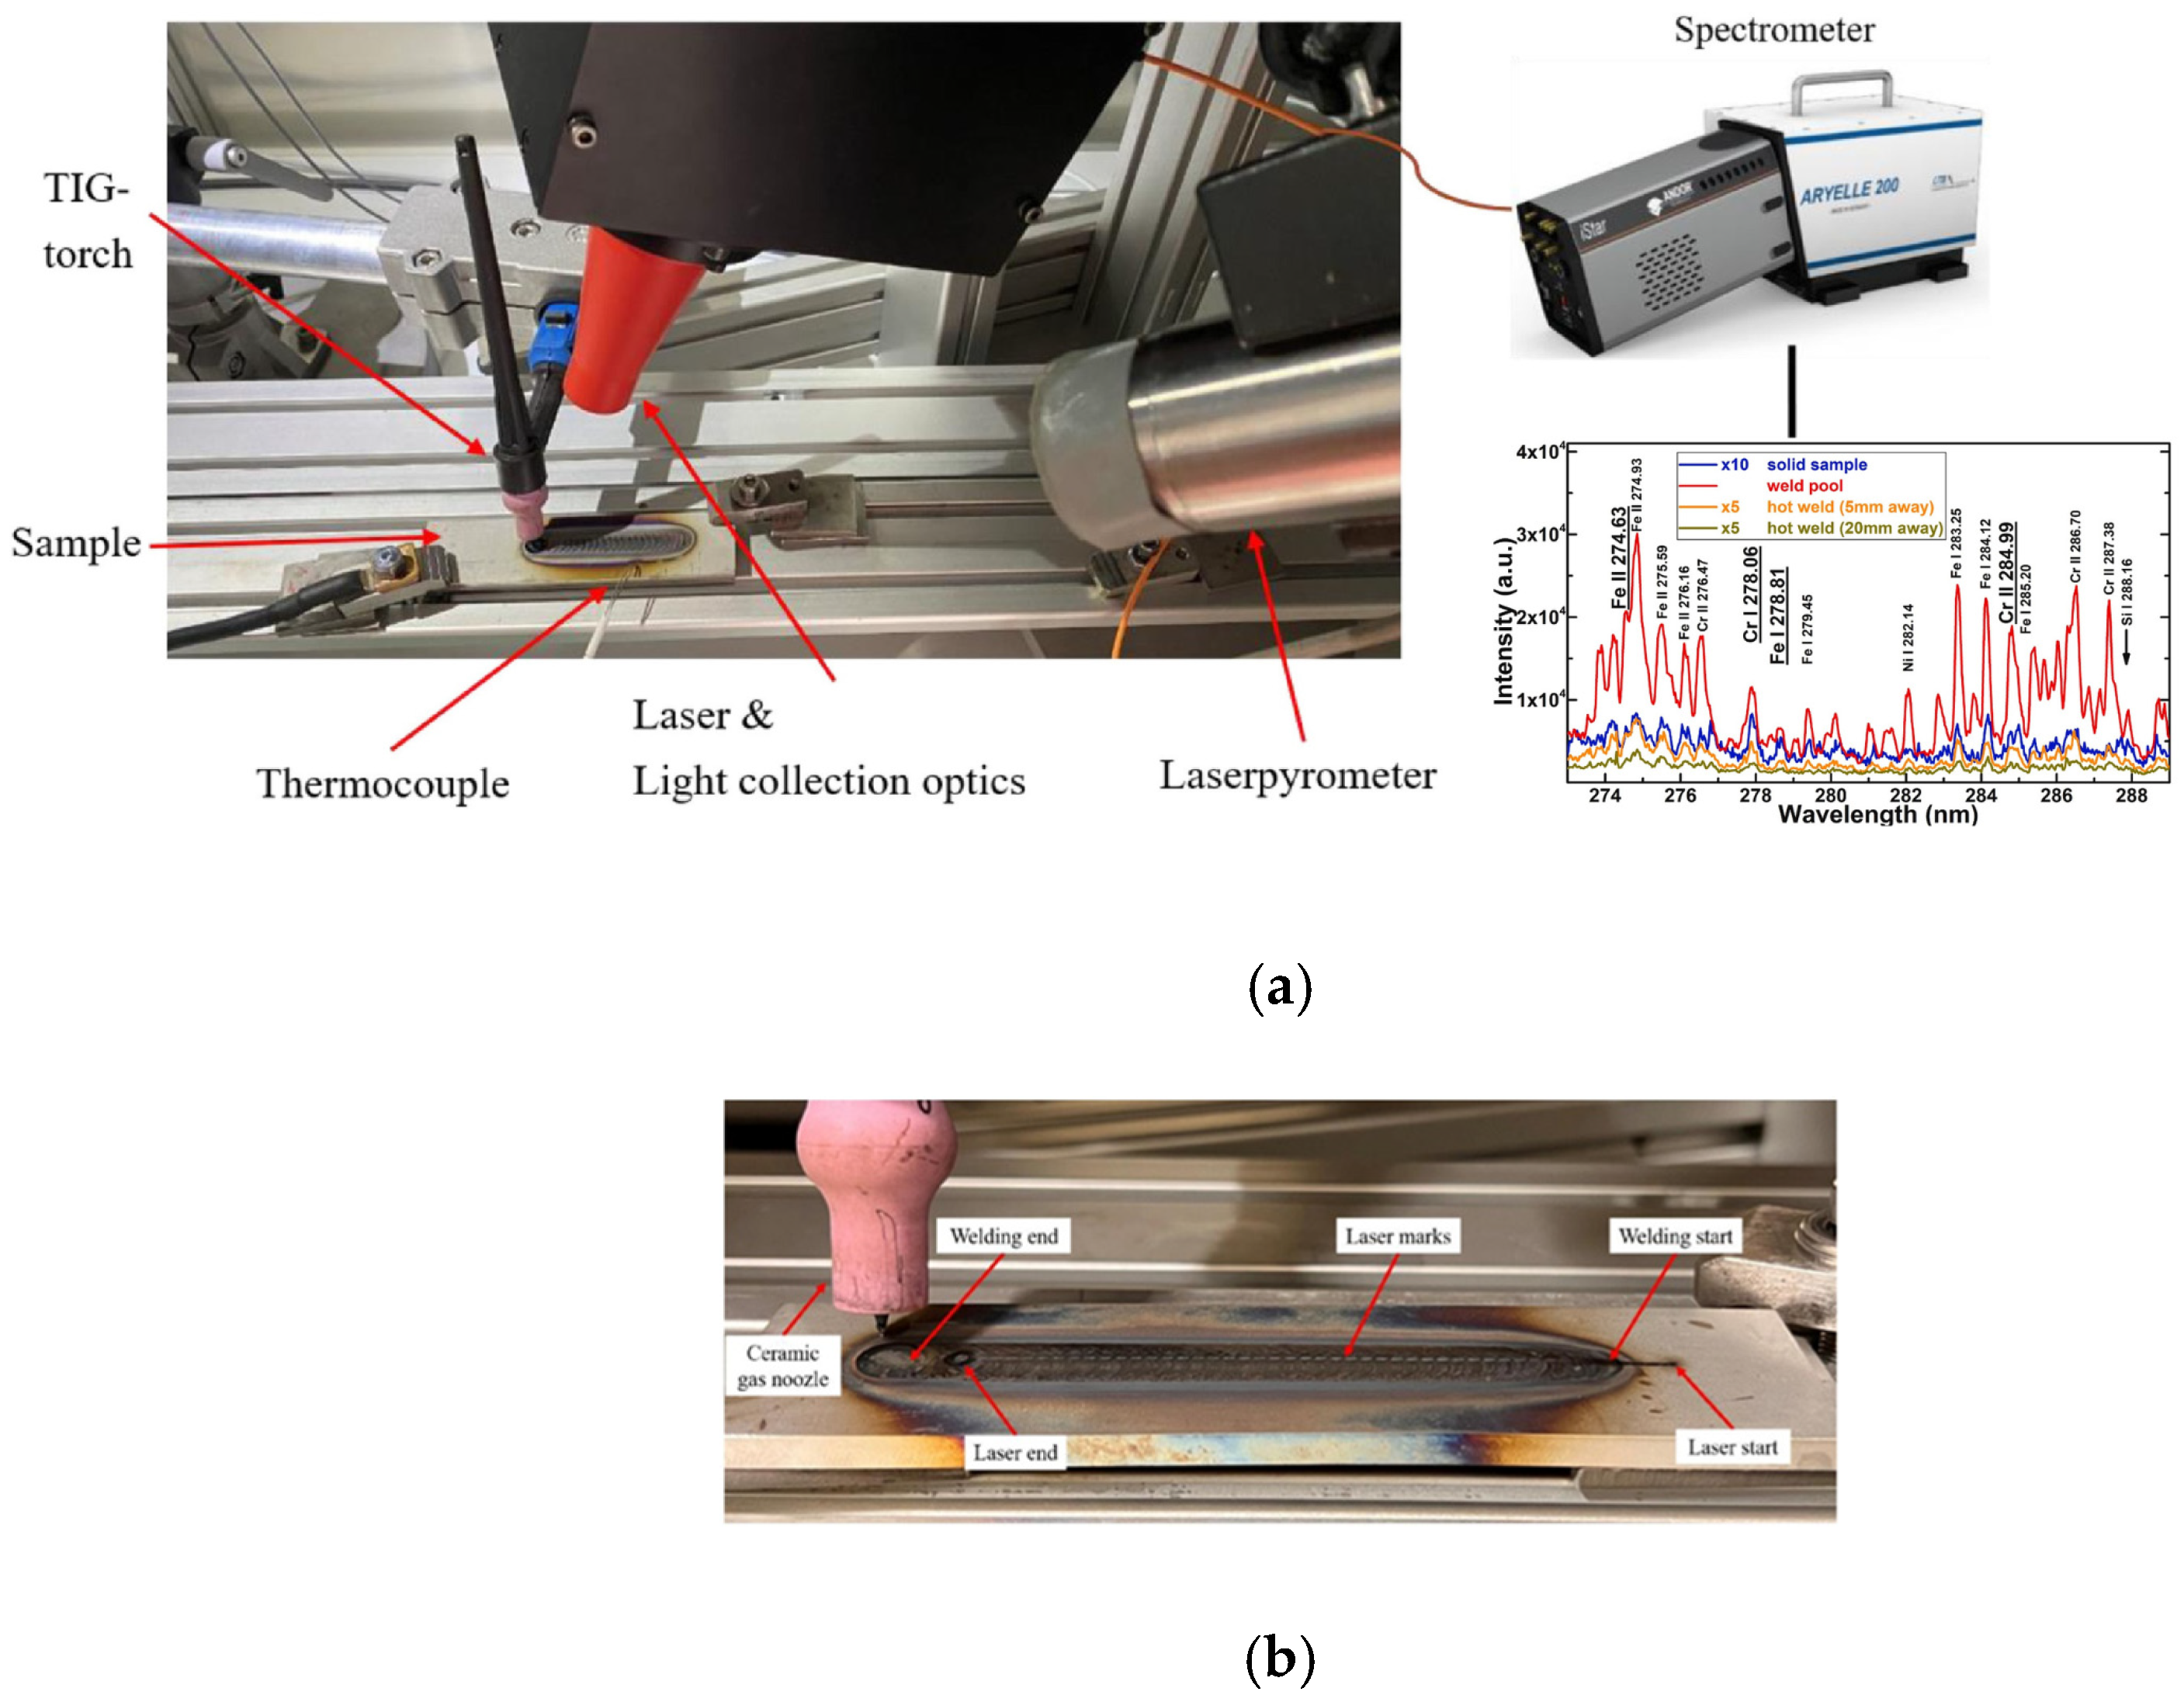
(a) Arrangement of experimental equipment for real-time LIBS analysis during TIG welding [25]; (b) the weld seam is analyzed using LIBS [25].
This setup consists of a pure tungsten electrode with a 1.6 mm diameter used in the TIG torch, with a ceramic gas nozzle (6 mm diameter). In this process, an approximate standoff distance of 3 mm is maintained, along with 10 L/min [25] or 16 L/min [23] of Ar shielding gas. The high-speed Nd: YAG laser (Quantel laser, 22300 Lannion, France) in the LIBS system typically consumes 5 W of power and can deliver up to 200 mJ of energy per pulse. The Aryelle 200 Echelle spectrometer (LTB Lasertechnik Berlin GmbH, Germany), featuring an Intensified Charge Coupled Device (ICCD) detector and a spectral resolution of 9000, is synchronized with the laser source using an LIBS controller (LTB Lasertechnik Berlin GmbH, Germany). ICCD detectors offer better versatility and time precision compared to single CCD-type detection technology [23,24,25,26].
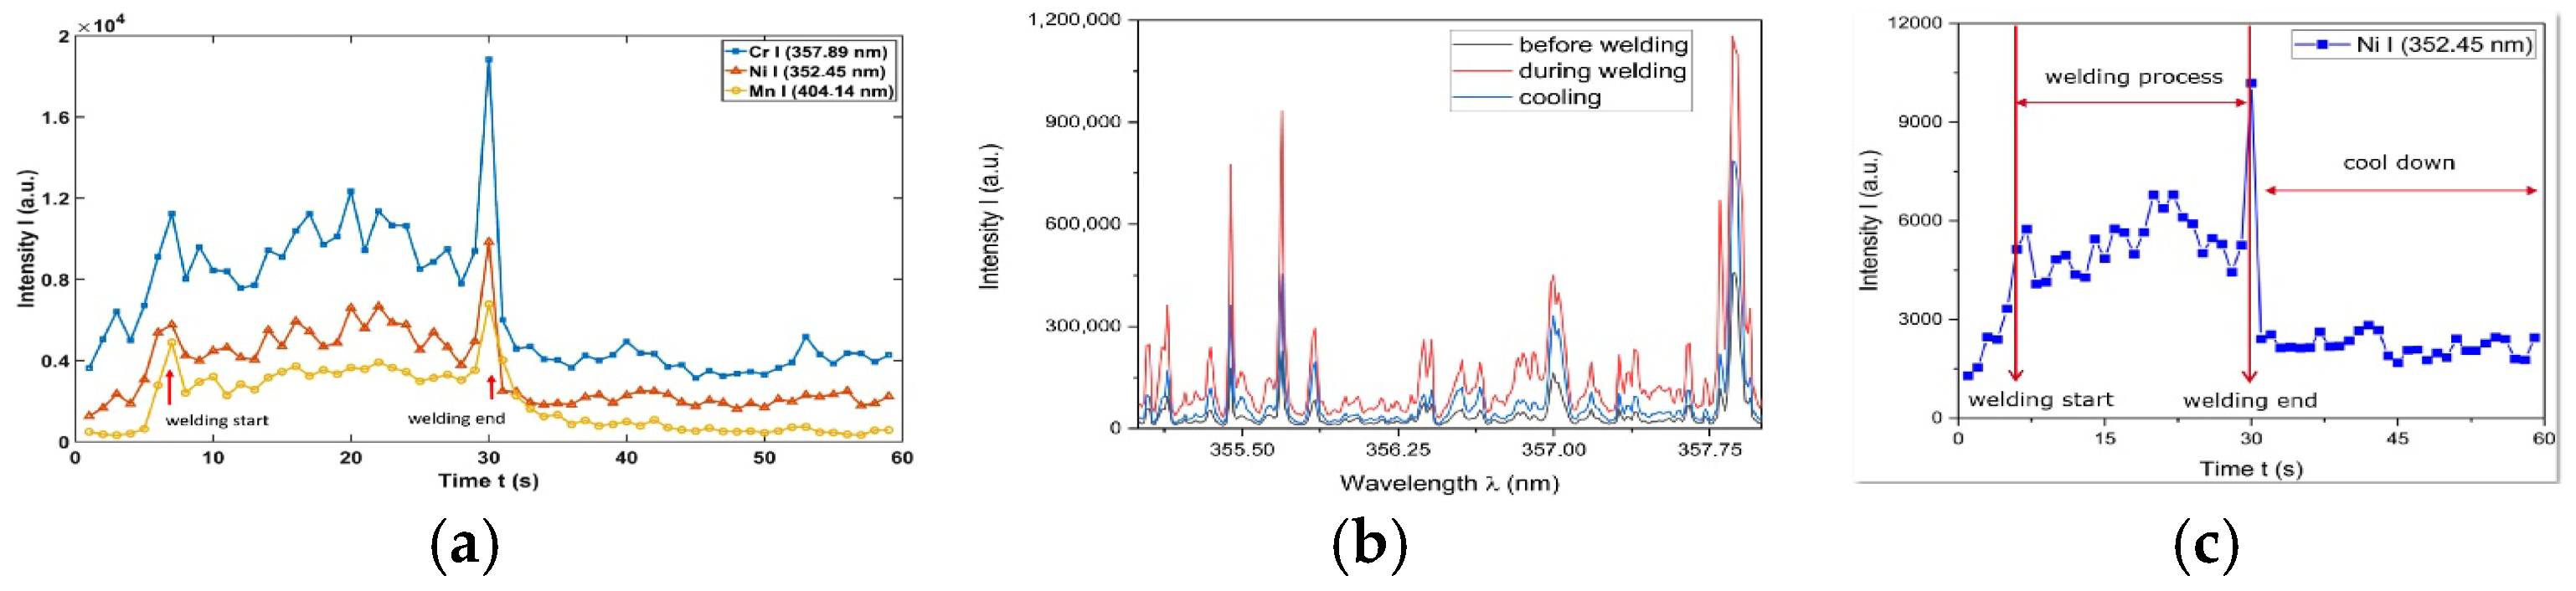
The principal alloying elements of a Duplex Stainless Steels (DSSs) material (DSS EN grade 1.4462) were measured using TIG-welding conditions of a 140 Amps current and a 5 mm/sec travel speed, as illustrated in Figure 7a. Using LIBS laser markings, weld the seam. The LIBS intensities at the beginning and end of the laser and welding process are shown in Figure 7b. As the specimen’s temperature increases during TIG welding, the LIBS spectrum intensities of the Nickel alloy (Ni) elements also rise, as shown in Figure 7c [25].
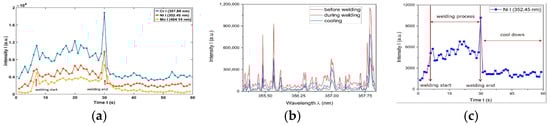
Figure 7.
(a) LIBS intensities of the primary alloying elements (Cr, Ni, Mn) in DSS EN grade 1.4462 material during TIG welding; (b) LIBS intensities measured before welding, after welding, and during cooling [25]; (c) LIBS intensities of nickel (DSS EN grade 1.4462) during TIG welding [25].
3. Conclusions
Welding-equipment manufacturers are increasingly adopting Industry 4.0 technologies by integrating cyber–physical systems for real-time process monitoring, which is essential for the future of smart factories. In robotic and automated welding, advanced sensing technologies have become crucial for achieving high-quality welds without relying on skilled operators. Vision-based systems such as CMOS, AAM, CCD, and LIBS have significantly improved real-time monitoring of weld pools and bead geometry, meeting the growing need for precision and efficiency in modern manufacturing. As these technologies continue to evolve, they will play a key role in optimizing welding processes, ensuring weld quality, and advancing automation in manufacturing.
Despite their advantages, these technologies also have certain limitations. CMOS sensors struggle with a restricted dynamic range and are prone to noise, which can affect image clarity in low-light or high-temperature environments. AAM has difficulty detecting defects in thick materials and requires accurate sensor placement for reliable fault detection. While CCD and LIBS are effective in assessing welding track quality and integrating with closed-loop systems for weld integrity, they demand precise calibration for accurate material composition analysis and come with high initial costs. These four technologies play a crucial role in vision-sensing techniques for evaluating weld track quality. However, achieving precise measurement of bead width and depth of penetration remains a challenge, emphasizing the necessity for further improvements in sensing and analysis techniques.
Author Contributions
The reviewed manuscript was written by P.S.P. Project supervision was carried out by P.S., V.P.V., S.M. and V.B. All authors have read and agreed to the published version of the manuscript.
Funding
The author(s) disclosed receipt of the following financial support for the research, authorship, and/or publication of this article: The authors acknowledge the Ministry of Heavy Industries–Industry Accelerator Project (MHI–IAP), India (Sanction No. 12/20/2022 HE & MT) for providing financial support to carry out this work.
Institutional Review Board Statement
Not applicable.
Informed Consent Statement
Not applicable.
Data Availability Statement
No new data were created or analyzed in this study. Data sharing is not applicable to this article.
Conflicts of Interest
The authors declare no conflicts of interest.
References
- Zhang, J.; Shao, P.; Wang, X.; Fan, D. Improving weld penetration by two-TIG arc activated via mixing oxygen into shielding gas. Int. J. Adv. Manuf. Technol. 2022, 125, 169–181. [Google Scholar] [CrossRef]
- Kesse, M.A.; Buah, E.; Handroos, H.; Ayetor, G.K. Development of an Artificial Intelligence Powered TIG Welding Algorithm for the Prediction of Bead Geometry for TIG Welding Processes using Hybrid Deep Learning. Metals 2020, 10, 451. [Google Scholar] [CrossRef]
- Belgacem, L.; Benharat, S.; Hakem, M.; Sakmeche, M. Experimental investigating pure tungsten cathode behavior in argon AC-TIG welding. Int. J. Adv. Manuf. Technol. 2024, 130, 3573–3581. [Google Scholar] [CrossRef]
- Bacioiu, D.; Melton, G.; Papaelias, M.; Shaw, R. Automated defect classification of SS304 TIG welding process using visible spectrum camera and machine learning. NDT E Int. 2019, 107, 102139. [Google Scholar] [CrossRef]
- Lin, J.-W.; Chang, H.-C.; Wu, M.-H. Comparison of mechanical properties of pure copper welded using friction stir welding and tungsten inert gas welding. J. Manuf. Process. 2013, 16, 296–304. [Google Scholar] [CrossRef]
- Shinde, N.V.; Telsang, M.T. Effect of alternate supply of shielding gases of tungsten inert gas welding on mechanical properties of austenitic stainless steel. J. Inst. Eng. (India) Ser. C 2016, 97, 299–307. [Google Scholar] [CrossRef]
- Wu, H.; Chang, Y.; Mei, Q.; Liu, D. Research advances in high-energy TIG arc welding. Int. J. Adv. Manuf. Technol. 2019, 104, 391–410. [Google Scholar] [CrossRef]
- Kshirsagar, R.; Jones, S.; Lawrence, J.; Tabor, J. Prediction of bead geometry using a Two-Stage SVM–ANN algorithm for automated tungsten inert gas (TIG) welds. J. Manuf. Mater. Process. 2019, 3, 39. [Google Scholar] [CrossRef]
- Rana, H.; Badheka, V.; Patel, P.; Patel, V.; Li, W.; Andersson, J. Augmentation of weld penetration by flux assisted TIG welding and its distinct variants for oxygen free copper. J. Mater. Res. Technol. 2020, 10, 138–151. [Google Scholar] [CrossRef]
- Venkatesan, G.; Muthupandi, V.; Justine, J. Activated TIG welding of AISI 304L using mono- and tri-component fluxes. Int. J. Adv. Manuf. Technol. 2016, 93, 329–336. [Google Scholar] [CrossRef]
- Baek, D.; Moon, H.S.; Park, S.-H. Optimization of weld penetration prediction based on weld pool image and deep learning approach in gas tungsten arc welding. Int. J. Adv. Manuf. Technol. 2023, 130, 2617–2633. [Google Scholar] [CrossRef]
- Dutta, P.; Pratihar, D.K. Modeling of TIG welding process using conventional regression analysis and neural network-based approaches. J. Mater. Process. Technol. 2006, 184, 56–68. [Google Scholar] [CrossRef]
- Valdiande, J.J.; Martínez-Minchero, M.; Cobo, A.; Lopez-Higuera, J.M.; Mirapeix, J. On-line monitoring and defect detection of arc-welding via plasma optical spectroscopy and LIBS. Spectrochim. Acta Part B At. Spectrosc. 2022, 194, 106474. [Google Scholar] [CrossRef]
- Zhang, Z.; Kannatey-Asibu, E.; Chen, S.; Huang, Y.; Xu, Y. Online defect detection of Al alloy in arc welding based on feature extraction of arc spectroscopy signal. Int. J. Adv. Manuf. Technol. 2015, 79, 2067–2077. [Google Scholar] [CrossRef]
- Ancona, A.; Lugarà, P.M.; Ottonelli, F.; Catalano, I.M. A sensing torch for on-line monitoring of the gas tungsten arc welding process of steel pipes. Meas. Sci. Technol. 2004, 15, 2412–2418. [Google Scholar] [CrossRef]
- Mirapeix, J.; Ruiz-Lombera, R.; Valdiande, J.J.; Rodriguez-Cobo, L.; Anabitarte, F.; Cobo, A. Defect detection with CCD-spectrometer and photodiode-based arc-welding monitoring systems. J. Mater. Process. Technol. 2011, 211, 2132–2139. [Google Scholar] [CrossRef]
- Liu, L.; Chen, H.; Chen, S. Online Monitoring of variable Polarity TIG welding penetration State based on fusion of welding characteristic parameters and SVM. In Transactions on Intelligent Welding Manufacturing; Springer: Berlin/Heidelberg, Germany, 2018; pp. 87–104. [Google Scholar] [CrossRef]
- Chen, C.; Xiao, R.; Chen, H.; Lv, N.; Chen, S. Prediction of welding quality characteristics during pulsed GTAW process of aluminum alloy by multisensory fusion and hybrid network model. J. Manuf. Process. 2020, 68, 209–224. [Google Scholar] [CrossRef]
- Zhang, Z.; Wen, G.; Chen, S. Weld image deep learning-based on-line defects detection using convolutional neural networks for Al alloy in robotic arc welding. J. Manuf. Process. 2019, 45, 208–216. [Google Scholar] [CrossRef]
- Chen, C.; Lv, N.; Chen, S. Welding penetration monitoring for pulsed GTAW using visual sensor based on AAM and random forests. J. Manuf. Process. 2020, 63, 152–162. [Google Scholar] [CrossRef]
- Cootes, T.F.; Edwards, G.J.; Taylor, C.J. Active appearance models. IEEE Trans. Pattern Anal. Mach. Intell. 2001, 23, 681–685. [Google Scholar] [CrossRef]
- Matthews, I.; Baker, S. Active appearance models revisited. Int. J. Comput. Vis. 2004, 60, 135–164. [Google Scholar] [CrossRef]
- Taparli, U.A.; Kannengiesser, T.; Cieslik, K.; Mory, D.; Griesche, A. In situ chemical composition analysis of a tungsten-inert-gas austenitic stainless steel weld measured by laser-induced breakdown spectroscopy. Spectrochim. Acta Part B At. Spectrosc. 2020, 167, 105826. [Google Scholar] [CrossRef]
- Taparli, U.A.; Jacobsen, L.; Griesche, A.; Michalik, K.; Mory, D.; Kannengiesser, T. In situ laser-induced breakdown spectroscopy measurements of chemical compositions in stainless steels during tungsten inert gas welding. Spectrochim. Acta Part B At. Spectrosc. 2017, 139, 50–56. [Google Scholar] [CrossRef]
- Quackatz, L.; Griesche, A.; Kannengiesser, T. In situ investigation of chemical composition during TIG welding in duplex stainless steels using Laser-Induced Breakdown Spectroscopy (LIBS). Forces Mech. 2021, 6, 100063. [Google Scholar] [CrossRef]
- Kumar, S.; Sharma, K.; Mishra, V.; Maan, V. A structural model of Welding 4.0 implementation challenges. Int. J. Interact. Des. Manuf. (IJIDeM) 2023, 18, 1243–1254. [Google Scholar] [CrossRef]
- Davim, J.P. Welding Technology; Materials Forming, Machining, and Tribology; Springer: Berlin/Heidelberg, Germany, 2021. [Google Scholar] [CrossRef]
- Gyasi, E.A.; Handroos, H.; Kah, P. Survey on artificial intelligence (AI) applied in welding: A future scenario of the influence of AI on technological, economic, educational and social changes. Procedia Manuf. 2019, 38, 702–714. [Google Scholar] [CrossRef]

Disclaimer/Publisher’s Note: The statements, opinions and data contained in all publications are solely those of the individual author(s) and contributor(s) and not of MDPI and/or the editor(s). MDPI and/or the editor(s) disclaim responsibility for any injury to people or property resulting from any ideas, methods, instructions or products referred to in the content. |
© 2025 by the authors. Licensee MDPI, Basel, Switzerland. This article is an open access article distributed under the terms and conditions of the Creative Commons Attribution (CC BY) license (https://creativecommons.org/licenses/by/4.0/).