Abstract
Motorcycles are widely used vehicles in Indonesia, not only as private vehicles but also for public transportation. Currently, there are many applications that help customers to use motorbikes as public transportation and are known as “online ojek” applications. Although there have been many online ojek applications used by the public, there is no online ojek application specifically for women. This study uses the conjoint method to determine the attributes of female consumer preferences for online ojek applications so that further studies the result of this study as a reference for developing female online ojek applications. With a sample size of 130 respondents, the combination of attributes is formed using fractional factorial design. This study produces eight attributes and levels that are most desired by consumers: (1) colourless, 3D supporting icons with, (2) a primary application colour of pink, (3) button shapes with blunt rectangles, (4) bold text for the level selected in the thick and thin text design, (5) application menu containing homepage, promo, order, chat, profile, thick and thin text, (6) Indonesian application language, (7) payment menu containing accumulated prices and accumulated minutes and (8) 3D and colourful icons.
1. Introduction
According to [1], internet usage in Indonesia is growing steadily. In data released by the Indonesian Internet Service Providers Association, Indonesia is one of the countries with the largest number of active internet users in the world, reaching 221 million users in 2024. The percentage of the population aged 5 years and over who stated that they had accessed the internet in the last three months was 62.10% in 2021 and increased to 66.48% in 2022. This increase in internet usage occurred in both urban and rural areas. In urban areas, the percentage of internet users in 2021 was around 71.81% and then increased to 74.16% in 2022, while internet users in rural areas in 2021 were around 49.30 percent and increased to 55.92% in 2022 [2].
With the development of cell phones and the internet has come the rapid development of mobile applications. Mobile applications are applications that can be used while users move easily from one place to another without interruption of communication. Mobile applications are known as downloadable applications and have certain functions that add to the functionality of the mobile device itself. In the workplace, mobile applications are frequently used to improve business processes [3]. Building business applications has long been present in many online transportation applications. One of the growing online transportation forms in Indonesia is online motorcycle taxis (online ojek). Online ojek is an online application-based transportation form where consumers use their devices to order online ojek services and connect to drivers who receive orders and are ready to deliver consumers to their destinations. The competitor of online ojek are conventional ojeks, which are used by residents in big cities because of their advantages, namely being faster and able to pass between traffic in the city. Conventional ojek usually wait at busy intersections, or at entrances to residential areas [4].
The development of online ojek also occurs in Madura, specifically in Bangkalan. Online ojek are chosen by communities because they are cheap, fast and safe. In addition, motorcycles are the most frequently used mode of transportation. In reality, the area around the campus of Trunojoyo University of Madura (UTM) is not fully served by large online ojek services such as Gojek and Grab. This obstacle creates serious problems for users, especially in the ease and safety of transportation access. The number of students and educators of UTM who come from outside the area requires adequate transportation access to move from residence to campus and vice versa. This limited access to transportation hampers mobility, especially at night or during bad weather. In recent years, the safety of online ojek users has become a major concern. In the campus environment, female students often feel less comfortable and safe using ojek operated by men. In addition, the culture of Madurese society is strongly influenced by Islamic values, where the interactions between men and women are restricted. In the view of Islam, there are limits to the interaction between men and women; men and women are allowed to interact in general and urgent matters, but they should not interact much if there is no important matter. These Islamic values are also the basis for the importance of female online ojek. In addition, female students also need a female ojek online application design that suits their needs. So, this research will study the preferences of female students related to online ojek applications regarding their wishes for convenience of use.
One method that studies consumer needs is conjoining. According to [5,6], it defines customer needs more accurately than using a simple questionnaire. The results obtained using the conjoint method are more detailed, reliable and easier to understand. Before using the conjoint method, it is necessary to obtain the voice of the customer (VOC) [7], which is useful for knowing the list of perceptions and desires of consumers in the use of female online motorcycle taxis [8]. This study uses the adaptive conjoint method because it uses 15 attributes. This technique is used to simplify or combine the self-explicated model and traditional conjoint analysis.
According to [9], conjoint analysis is used to determine customer preferences on important attributes and utilities associated with levels or attribute levels. Meanwhile, according to [10], conjoint analysis is a method of measuring preferences and helps predict how people make complex decisions. Conjoint analysis follows a decomposition approach. It assumes that the overall preference for a product (or service) is determined by preferences for its specific attributes, that these preferences are additive, and that respondents maximize their benefits when deciding on product attributes. Respondents are presented with a stimulus consisting of various combinations of levels.
2. Material and Method
The type of research method used in this research is quantitative. This method is used to describe what attributes are preferences for the use of online ojek among female students of UTM objectively, using conjoint analysis to see the most desirable attributes.
This research has 12 steps, starting from data collection to data processing, as follows:
- Conduct the first interview to obtain the attributes needed by online ojek users.
- Group attributes from the results of the interviews.
- Determine the method used, namely ACA (adaptive conjoint analysis) because the number of attributes was more than 6, and was in the range 15–30.
- Determine the attributes and levels obtained from the results of the interviews. According to [11], determining attributes and levels is very important in starting conjoint research. Nonmetric levels specifically describe a factor. Each factor must be represented by two or more levels, but the number of levels usually does not exceed four or five. If the original factor is metric, then it should be reduced to a small number of nonmetric levels.
- Perform attribute and level distribution, which serves to obtain the importance value of each attribute.
- Sort the importance value on each attribute to obtain the highest importance value. According to [12], ask respondents to rate the attributes based on their level of importance on a scale of 1 to 4, where 4 indicates the highest level of importance.
- Eliminate attributes that have low values, leaving 8 attributes. According to [12], in performing adaptive conjoint analysis (ACA) respondents report 2 to 9 profiles, consisting of a maximum of 8 attributes. This calibration concept was chosen by the software to evolve from highly undesirable to highly desirable.
- Arrange the stimulus obtained from the elimination results with the full profile method using the fractional factorial design procedure by applying an orthogonal array. According to [11], the full-profile method is the most popular method due to its perceived realism and its ability to reduce the number of comparisons through the use of fractional factorial design. This approach results in fewer assessments, but each assessment is more complex, and assessments can be ranked or rated.
- Conduct questionnaire distribution to respondents.
- Determine the input data obtained from the questionnaire distribution results. Input data in the form of ratings obtained after recapitulating the questionnaires that have been distributed. According to [9], ask metric data respondents to give a rating or value to each stimulus using a Likert scale ranging from 1 to 4 (1 = least preferred, 4 = most preferred).
- Measure the accuracy of predictions by conducting reliability and validity testing on the data that have been obtained.
- Conduct data testing with SPSS and generate part-worth coefficient and relative importance values.
3. Result and Discussion
3.1. Getting Attributes and Level with Voice of Customer
The voice of customers (VOC) was determined by collecting information directly from potential users, namely 22 female students who use and have used female online ojek. The results of the interview were recorded so that 15 attributes and levels were obtained as follows (Table 1). Table 1 shows the results of the voice of customers [7] on online motorcycle taxi consumers. After categorizing the voice of customer survey, it was found that there were 15 attributes in this study.

Table 1.
Voice of customer.
The conjoint method that matches 15 attributes according to [11] is adaptive conjoint analysis. The underlying reason is because in adaptive conjoint analysis (ACA), up to 30 attributes can be used, and each attribute can have up to 15 levels. The term adaptive refers to the interview being computerized for each of the respondents. Respondents are presented with a questionnaire and then asked to answer. The questions given to respondents can be of two types, namely ranking or rating. ACA has two capabilities, namely the ability to design a computerized interview, and the ability to mimic respondents’ choices in modifying products. Table 1 has 15 attributes: application name, application language, application primary colour, application colour combination, application menu, application icon, supporting icon, thick and thin text design, text and icon layout, text and icon size, button design, button shape, payment menu, vehicle description and ad location.
3.2. Conducting Assessment and Elimination on Attributes and Levels
By distributing questionnaires to 30 respondents, several attributes were sorted according to importance, and the remaining attributes after elimination were obtained as follows (Table 2):
Table 2.
Attributes and levels after elimination.
Table 2 is the next stage of the conjoint analysis, whereby the attributes that are less important are eliminated. According to [12], eliminating some of the attributes in adaptive conjoint analysis (ACA) is an attempt to obtain the attributes that the most desired by consumers. It is intended to find the number of attributes that are most desired in building a female online motorcycle taxi application. The initial 15 attributes were eliminated, resulting in 8 selected attributes, namely application language, application primary colour, application menu, main icon, supporting icon, thick and thin text design, button shape, and payment menu.
3.3. Attributes and Stimulus
Eight attributes were used in this study, each of which has its own level and description. A total of 27 stimuli were developed by researchers with the help of the SPSS application, as follows (Table 3).
Table 3.
Online ojek application stimulus.
Table 3 contains 27 stimuli obtained from 8 attributes. The determination of the results of stimuli with the full-profile method used fractional factorial design by applying an orthogonal array so that the results obtained 27 pairs of attributes in the form of stimuli. According to [12], respondents were asked to rank or sort the stimuli. The ranking usually starts from a very favourable stimulus to a very unfavourable stimulus. Metric data respondents were asked to give a rating or value to each stimulus (ranking) in this study to obtain the most desirable attributes using ranking.
3.4. Dummy Variables
Based on Table 2, regarding the determination of levels, to determine or form dummy variables, options were formed as follows:
- Y: Average assessment of 110 respondents;
- A1 (Application language): (1) Indonesian, (0) multi-language;
- B1 (Application primary colour): (1,0) pink, (0,1) purple, (0,0) blue;
- C1 (App menu): (1,0) home, promo, order, chat, profile, (0,1) home, order, chat, profile, (0,0) home, order, payment, chat, profile;
- D1 (Main icon): (1) 3D and coloured, (0) 2D and coloured;
- E1 (Support icon): (1,0) 2D black and white, (0,1) 3D and coloured, (0,0) 3D and colourless;
- F1 (Thick and thin text design): (1,0) thicken the highlighted text, (0,1) normal, (0,0) thicker text;
- G1 (Button shape): (1,0) blunt end rectangle, (0,1) round end rectangle, (0,0) rounded;
- H1 (Payment menu): (1) accumulated price, accumulated minutes and mileage, (0) accumulated price and accumulated minutes.
Using a sample of 110 respondents, the average of each respondent’s answer to each stimuli from the results of filling out the questionnaire was calculated. Furthermore, the estimation of regression parameters with dummy variables with 27 stimuli was performed.
3.5. Estimation of Regression Parameters with Dummy Variables
Respondents’ assessments of the values of stimuli was carried out in aggregate, where Y is the average assessment of 110 respondents for each of 27 stimuli. The following are the results of estimating regression parameters with dummy variables:
Y = 2.532 − 1.222A1 − 10.778B1 − 2.778C1 − 3.778D1 + 0.889E1 + 6.556F1 + 2.889G1 + 2.389H1
3.6. Measurement of Prediction Accuracy
The measurement of prediction accuracy can be seen from the existing goodness of fit value. The procedure using dummy variables can be seen from the R2 value goodness of fit and Pearson correlation.
Evaluating goodness of fit is necessary to measure the consistency of the model in predicting the preferences given by each respondent. The procedure using regression on dummy variables can be seen from R2. Based on Table 4, the R2 value obtained is 0.729. It can be concluded that the regression model with the resulting dummy variable is good for prediction, because 72.9% of the total diversity of respondents’ utility can be explained by the existing attributes.
Table 4.
Goodness of fit result.
Pearson correlation or Pearson’s R is often used as a tool in measuring the validity of the utility value. Based on Table 5, the sig value is 0.002, so H0 is rejected, which means that the attributes used are significant considerations of female students when determining the most desirable attributes. And the correlation coefficient is 0.534. When the correlation result is close to 1, it means that the relationship between attributes is becoming stronger and has a positive value, which shows the direction, indicating a good prediction.
Table 5.
Correlation result.
3.7. Part-Worth Coefficient
The part-worth coefficient can be seen in the output results of conjoint analysis. The following are the output results in the form of part-worth coefficient values and relative importance values (Table 6):
Table 6.
Output results of part-worth coefficient value and relative importance value.
Table 6 shows the attributes in which female motorcycle taxi consumers are most interested, down to those that are less interesting. The female motorcycle taxi applications with the greatest attribute importance values are as follows: supporting icons, with 15.621%; the primary colour of the application, with 15.522%; the shape of the button, with 14.802%; the application menu, with 14.707%; the design of thick and thin text, with 14.399%; the application language, with 8.858%; the payment menu, with 8.055%; and the main menu, with 8.037%.
The result of the conjoint research is the total selection of respondents from the various attributes contained within the concept. The level of importance of each attribute is defined as the difference between the maximum usability value and the minimum usability value. Thus, the relative importance value (NRP) of one attribute with another attribute is as follows (Figure 1):
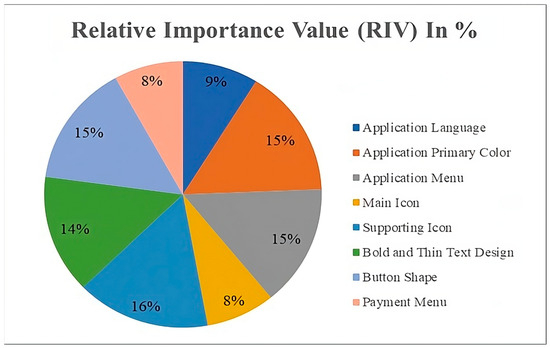
Figure 1.
Relative importance value.
Based on Figure 1, it can be seen that the attribute most frequently chosen by female ojek consumers was supporting icons. Supporting icons were preferred to be 3D and colourless; the primary colour of interest was pink; the preference for the shape of buttons was blunt-end rectangles; the application menu order preference was home, promo, order, chat and profile; the application language of interest was Indonesian; the payment menu of interest was accumulated price and accumulated minutes; and the main icon was preferred to be in 3D colour. The research results can be used to design female online ojek applications in further research.
4. Conclusions
Using the adaptive conjoint analysis method, we obtained eight attributes. The most desirable attribute of the eight attributes was the supporting icon attribute. The attribute that most interested or was most frequently chosen by female students who used or had used female online ojek was a 3D and colourless supporting icon attribute. Pink colour was preferred for the selected level in the application’s primary colour attribute. A blunt-end rectangle was preferred for the selected level in the button shape attribute. Homepage, promo, order, chat and profile was the preferred menu order in the application menu attribute. Bold text was preferred in the thick and thin text design attribute. Indonesian language was preferred for the application language attribute. Accumulated price and accumulated minutes were preferred for the payment menu attribute. A 3D and coloured main icon was preferred.
Author Contributions
Conceptualization, R.I. and S.A. (Sabarudin Akhmad); methodology, S.S.; validation, R.I. and S.A. (Sabarudin Akhmad); investigation, S.S.; data curation, S.S.; writing—original draft preparation, S.S.; writing—review and editing, R.I.; supervision, S.A. (Samsul Amar); project administration, S.A. (Samsul Amar); funding acquisition, S.A. (Sabarudin Akhmad). All authors have read and agreed to the published version of the manuscript.
Funding
This research was funded by Independent Grant Research Trunojoyo University Madura. Independent Grant Research is an annual program organised by the Research and Community Service Institute of Trunojoyo University Madura. Independent Grant Research has several schemes including Research Lab, National Collaboration and International Collaboration. This paper is one of the outcomes of the independent grant program in the national collaboration scheme with a grant value of IDR 45 million.
Institutional Review Board Statement
I confirm that the study protocol was reviewed and approved by Universitas Trunojoyo Madura.
Informed Consent Statement
Informed consent was obtained from all subjects involved in this study.
Data Availability Statement
Data supporting reported results can be found at this link: https://drive.google.com/drive/folders/1MjQpdq_xL76yoXP4dDoQB_9nzvkqGtzZ?usp=sharing (accessed on 1 January 2025).
Conflicts of Interest
The authors declare no conflicts of interest.
References
- Asosiasi Penyelenggara Jasa Internet Indonesia. APJII Jumlah Pengguna Internet Indonesia Tembus 221 Juta Orang; Asosiasi Penyelenggara Jasa Internet Indonesia: Jakarta, Indonesia, 2024. [Google Scholar]
- Sutarsih, T.; Maharani, K. Statistik Telekomunikasi Indonesia 2022; Badan Pusat Statistik: Jakarta, Indonesia, 2023. [Google Scholar]
- Prabowo, I.A.; Wijayanto, H.; Yudanto, B.W.; Nugroho, S. Buku Ajar Pemrograman Mobile Berbasis Android; Universitas Dian Nuswantoro: Jawa Tengah, Indonesia, 2020. [Google Scholar]
- Ferdila, M.; Us, K.A. Analisis Dampak Transportasi Ojek Online Terhadap Pendapatan Ojek Konvensional di Kota Jambi. IJIEB Indones. J. Islam. Econ. Bus. 2021, 6, 134–142. [Google Scholar]
- Kowalska-Pyzalska, A.; Michalski, R.; Kott, M.; Skowrońska-Szmer, A.; Kott, J. Consumer preferences towards alternative fuel vehicles. Results from the conjoint analysis. Renew. Sustain. Energy Rev. 2022, 155, 111776. [Google Scholar] [CrossRef]
- Yamaguchi, S.; Komuro, K.; Tanabe, S.; Yamaguchi, H. Important factors affecting transportation for shippers and potential demand for the Northeast Passage: A conjoint analysis of Japan. Polar Sci. 2024, 39, 101043. [Google Scholar] [CrossRef]
- Kotri, A. Analyzing Customer Value Using Conjoint Analysis: The Example of A Packaging Company; University of Tartu: Tartu, Estonia, 2006. [Google Scholar]
- Rembulan, G.D.; Wijaya, T.; Ruslie, A.; Jordy, J.; Sunadynatha, R.A.S. Mereduksi Voice of Customer pada Pengembangan Produk Alat Pembuka Tutup Galon Menggunakan Analisis Faktor. JIEMS J. Ind. Eng. Manag. Syst. 2020, 13, 87–99. [Google Scholar] [CrossRef]
- Supranto, J. Analisis Multivariat: Arti dan Interpretasi, 2nd ed.; Rineka Cipta: Jakarta, Indonesia, 2010. [Google Scholar]
- Heck, J.; Jahnke, L.; Leker, J. Early evidence of a transition towards sustainability-oriented decision-making in the chemical industry in Germany, Austria, and Switzerland: A choice-based conjoint analysis. Energy Policy 2024, 187, 114028. [Google Scholar] [CrossRef]
- Hair, J.F.; Black, W.C.; Babin, B.J.; Anderson, R.E. Multivariate Data Analysis; Pearson: New York, NY, USA, 2010. [Google Scholar]
- Rao, V.R. Applied Conjoint Analysis; Springer: Berlin/Heidelberg, Germany, 2014; Volume 9783540877. [Google Scholar]
Disclaimer/Publisher’s Note: The statements, opinions and data contained in all publications are solely those of the individual author(s) and contributor(s) and not of MDPI and/or the editor(s). MDPI and/or the editor(s) disclaim responsibility for any injury to people or property resulting from any ideas, methods, instructions or products referred to in the content. |
© 2025 by the authors. Licensee MDPI, Basel, Switzerland. This article is an open access article distributed under the terms and conditions of the Creative Commons Attribution (CC BY) license (https://creativecommons.org/licenses/by/4.0/).