Abstract
A creative industry company producing resin-based decorative lamps is facing quality issues due to production defects. This study applied the Six Sigma and FMEA methods to identify controls, analyze causes, and propose improvements. Six Sigma reduces defects using the DMAIC approach, while FMEA assesses risks through the Risk Priority Number (RPN). The analysis showed a DPMO of 14,587.89 and a sigma level of 3.7, aligning with industry standards in Indonesia. Key defects included bubbles (57%), uneven surfaces (24%), and cracks (19%). Suggested improvements included training, production evaluations, rotary casting tools, safety measures, and enhanced cleanliness in the sanding area.
1. Introduction
The creative industry in Indonesia is highly admired by consumers worldwide for its quality, as Indonesia has the resources to create unique products that are infused with cultural elements from each region, thereby enhancing the product’s value and ensuring the highest quality [1]. The development of the creative industry in Indonesia is paving the way for growth across various sectors. This progress is supported by contributions from multiple areas that positively impact the advancement of the national economy. The creative industry’s role is crucial for economic development, both on a global scale, at the macroeconomic level, and for Small and Medium Enterprises (SMEs) [2]. The resin craft industry is currently experiencing growth, making it a potential business sector, as the use of resin materials in the craft industry offers advantages in terms of product strength and durability while also facilitating the creation of more detailed products [3].
In the manufacturing industry, production process activities are undeniably crucial, as the production process involves the transformation from raw materials in the warehouse to finished goods [4]. When encountering issues or errors during the production process, these can lead to company losses, whether in the form of defective products or material wastage [5]. A company must enhance its competitiveness to effectively vie for the existing market shares [6]. One way to gain a competitive edge is through the continuous improvement of production quality [7]. Companies must maintain the quality of their products or services, as failure to do so can result in negative consequences such as a decrease in loyal customers, costs related to the recall of defective products, and other issues [8]. Therefore, effective quality control and improvement in the production process are necessary to ensure that the products meet quality standards and customer expectations [9].
At PT XYZ, which operates in the home accessories industry with products like decorative lamps, sculptures, cabinets, tables, and chairs made from resin, the company has received various awards for its home accessories and has exported its products to other countries while establishing partnerships. However, despite a high demand from both national and international customers, there are issues in production. The involvement of human labor in the creative industry affects the product quality, as humans are prone to making mistakes [10].
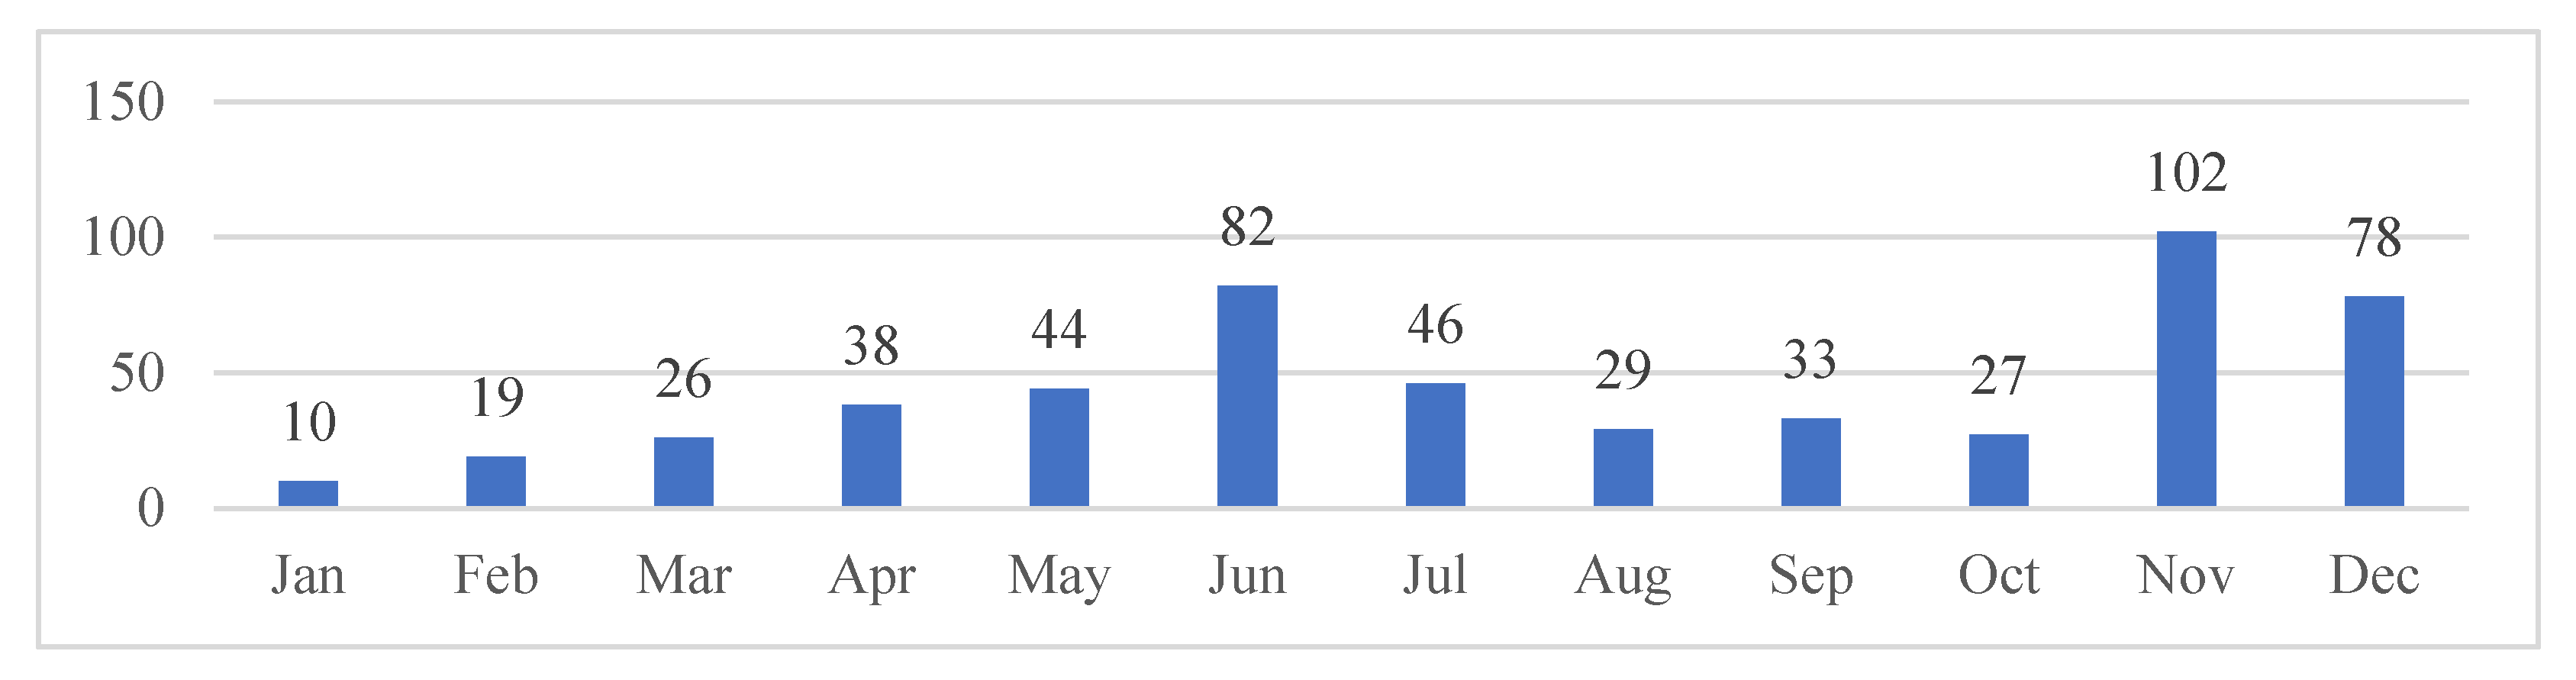
Based on production data and product defects from January to December 2023 in Figure 1, the graph shows an average defect rate of 4.7% per year for each production batch. One challenge that is faced by the resin craft company is the occurrence of product defects during the production process, which can lead to losses for the company due to suboptimal production efficiency and raw material costs, as repair or correction processes are rarely feasible, resulting in significant quality decreases. To address this issue, it is essential to control the product quality to prevent defects and continuously improve the product quality to meet customer expectations. Therefore, a method for quality control needs to be implemented by the company. Common defects include breakage or cracking during product removal from molds and color inconsistencies that do not meet the desired criteria.
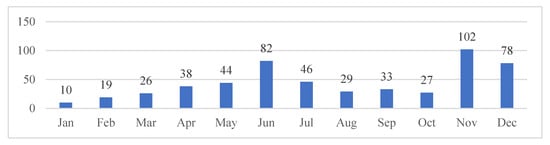
Figure 1.
Percentage of defective products for the period January–December 2023.
The Six Sigma method was employed to enhance product quality. This method is a quality control approach used by many organizations to achieve near-perfection in production [11]. Six Sigma focuses on defects and variations in a product. This approach begins with identifying the critical quality elements (Critical-to-Quality attributes) of a process and progresses to recommending improvements to address defects. One method for reducing product defects involves systematic steps: defining, measuring, analyzing, improving, and controlling [12,13,14]. The DMAIC method is a fundamental problem-solving framework within Six Sigma, encompassing a series of crucial improvement stages to achieve the desired results [15].
The Failure Mode and Effect Analysis (FMEA) method is an effective tool for managing potential product failures (failure modes), identifying the effects of these failures, and assessing the criticality of the failure effects on the product [16,17]. FMEA identifies and prioritizes the likelihood of failures. In FMEA calculations, indicators defined as severity, occurrence, and detection of failures are used [18]. The integration of the FMEA and Six Sigma methods involves identifying the causes of product defects, where Six Sigma calculates the rate of defects, and FMEA is used to identify failure causes to enable improvements based on priority rankings. Based on the described issues, the use of FMEA within Six Sigma can enhance quality improvement through a series of analyses by applying the DMAIC stages and identifying the severity, occurrence, and detection, thereby addressing quality issues within the company.
2. Methods
This research was conducted at PT XYZ, a company operating in the creative industry. The focus of the research was on the production process of decorative lamps. Data were collected from January to December 2023. This study utilized both primary and secondary data. Primary data were obtained through direct observation and interviews with production line employees, including one QC audit and two supervisors at the research site, who were interviewed about the causes and consequences of failures and to determine the severity, occurrence, and detection values. Secondary data were sourced from existing materials such as journals, books, production reports, defect statistics, and other relevant sources [19].
For the data processing and analysis, we used the Six Sigma method with the Define, Measure, Analyze, Improve, and Control (DMAIC) stages and Failure Mode and Effect Analysis (FMEA). The stages in the data processing are described below.
2.1. Define
In this initial stage, the identification of issues that may lead to production failures in the research object is conducted. This stage outlines the product quality standards or Critical-to-Quality (CTQ) characteristics based on the specifications provided by the customers, plans the necessary actions based on observation and research analysis, and sets the research targets and objectives for quality improvement based on these observations.
2.2. Measure
In the second stage, data processing for products experiencing defects during the production process is carried out. The previously determined Critical-to-Quality (CTQ) characteristics are assigned sigma values and Defect Per Million Opportunities (DPMOs). This stage involves calculations using control charts (P-Charts) to illustrate the control limits of a product. The P-Chart includes the Center Line (CL), upper control limit (UCL), and lower control limit (LCL), allowing for the determination of whether the product is within the control limits. The following are the formula steps for the control chart (P-Chart) [20,21,22]:
DPMO = DPO × 1,000,000
Description:
P: Proportion;
∑n: Total Production;
np: Number of defective products;
P: Average Proportion of Defects;
n: Number of samples;
∑np: Total Number of Defects.
2.3. Analyze
The third stage involves identifying the causes of quality issues in the production process using fishbone diagrams, Pareto charts, and FMEA. A fishbone diagram is used to identify and analyze potential causes of problems. A Pareto chart helps recognize dominant issues based on the principle that 80% of problems are caused by 20% of the causes. FMEA is employed to reduce the risk of product or process failures by preventing predictable errors. This stage focuses on gaining a deep understanding of the causes of quality issues and taking appropriate steps to address them. The steps in using FMEA are as follows [23]:
- Identify the production process flow;
- Identify potential failure modes in the production process;
- Identify potential impacts of production failures;
- Identify the causes of production process failures;
- Detect failure modes in the production process;
- Assign ratings for severity, occurrence, and detection;
- Calculate the Risk Priority Number (RPN) = severity (S) × occurrence (O) × detection (D);
- Propose improvements based on the calculated potential failures.
2.4. Improve
In the fourth stage, improvement proposals based on the previous analysis are developed. In this stage, ideas are generated for solving quality issues in production, where measurements can be made by assessing potential outcomes and providing recommendations for improvements, which can then be implemented as quality enhancement actions.
2.5. Control
In the final stage, the improvement proposals that were developed during the “Improve” phase should be disseminated to all relevant employees or departments and implemented promptly to prevent the recurrence of issues. Additionally, the production supervisor should oversee the implementation to ensure that the improvements are maintained consistently.
3. Result and Discussion
3.1. Define
The Define stage is the initial phase in the Six Sigma methodology, undertaken to identify the production stages. This phase aims to map out the company’s business process from the supplier through to the final delivery to customers in Figure 2.
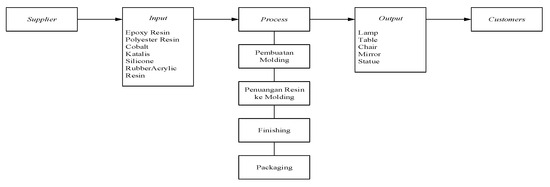
Figure 2.
SIPOC production process diagram.
3.2. Measure
The Measure phase is the second phase in the application of the Six Sigma methodology. This phase involves defining key characteristics or Critical-to-Quality (CTQ) attributes and analyzing them using Six Sigma processes, including calculating the DPMOs (Defects Per Million Opportunities), sigma levels, Pareto analysis, and fishbone diagrams. During this phase, data were obtained from production records from January 2023 to December 2023 in Table 1.

Table 1.
Product defects.
3.2.1. Establishing Critical-to-Quality (CTQ) Attributes
Critical-to-Quality (CTQ) attributes are to key characteristics of a product that significantly impact the ability to meet customer needs or achieve customer satisfaction. Based on the collected data, there are three CTQ attributes for decorative lighting products that could affect customer satisfaction: uneven surfaces, bubbling, and cracks or breakage.
3.2.2. Analysis Using P-Chart
A control chart was employed to analyze the proportion or percentage of defects or failures in a product. Measurements were taken from the final products that were manufactured between January 2023 and December 2023, encompassing various types of decorative lighting. A total of 11,330 units were produced over the year, with 534 units exhibiting defects across three categories: uneven surfaces, bubbling, and cracks or breakage. The overall results from the P-Chart calculations are presented in Table 2, which displays the P-Chart computations.
Table 2.
P-chart calculation.
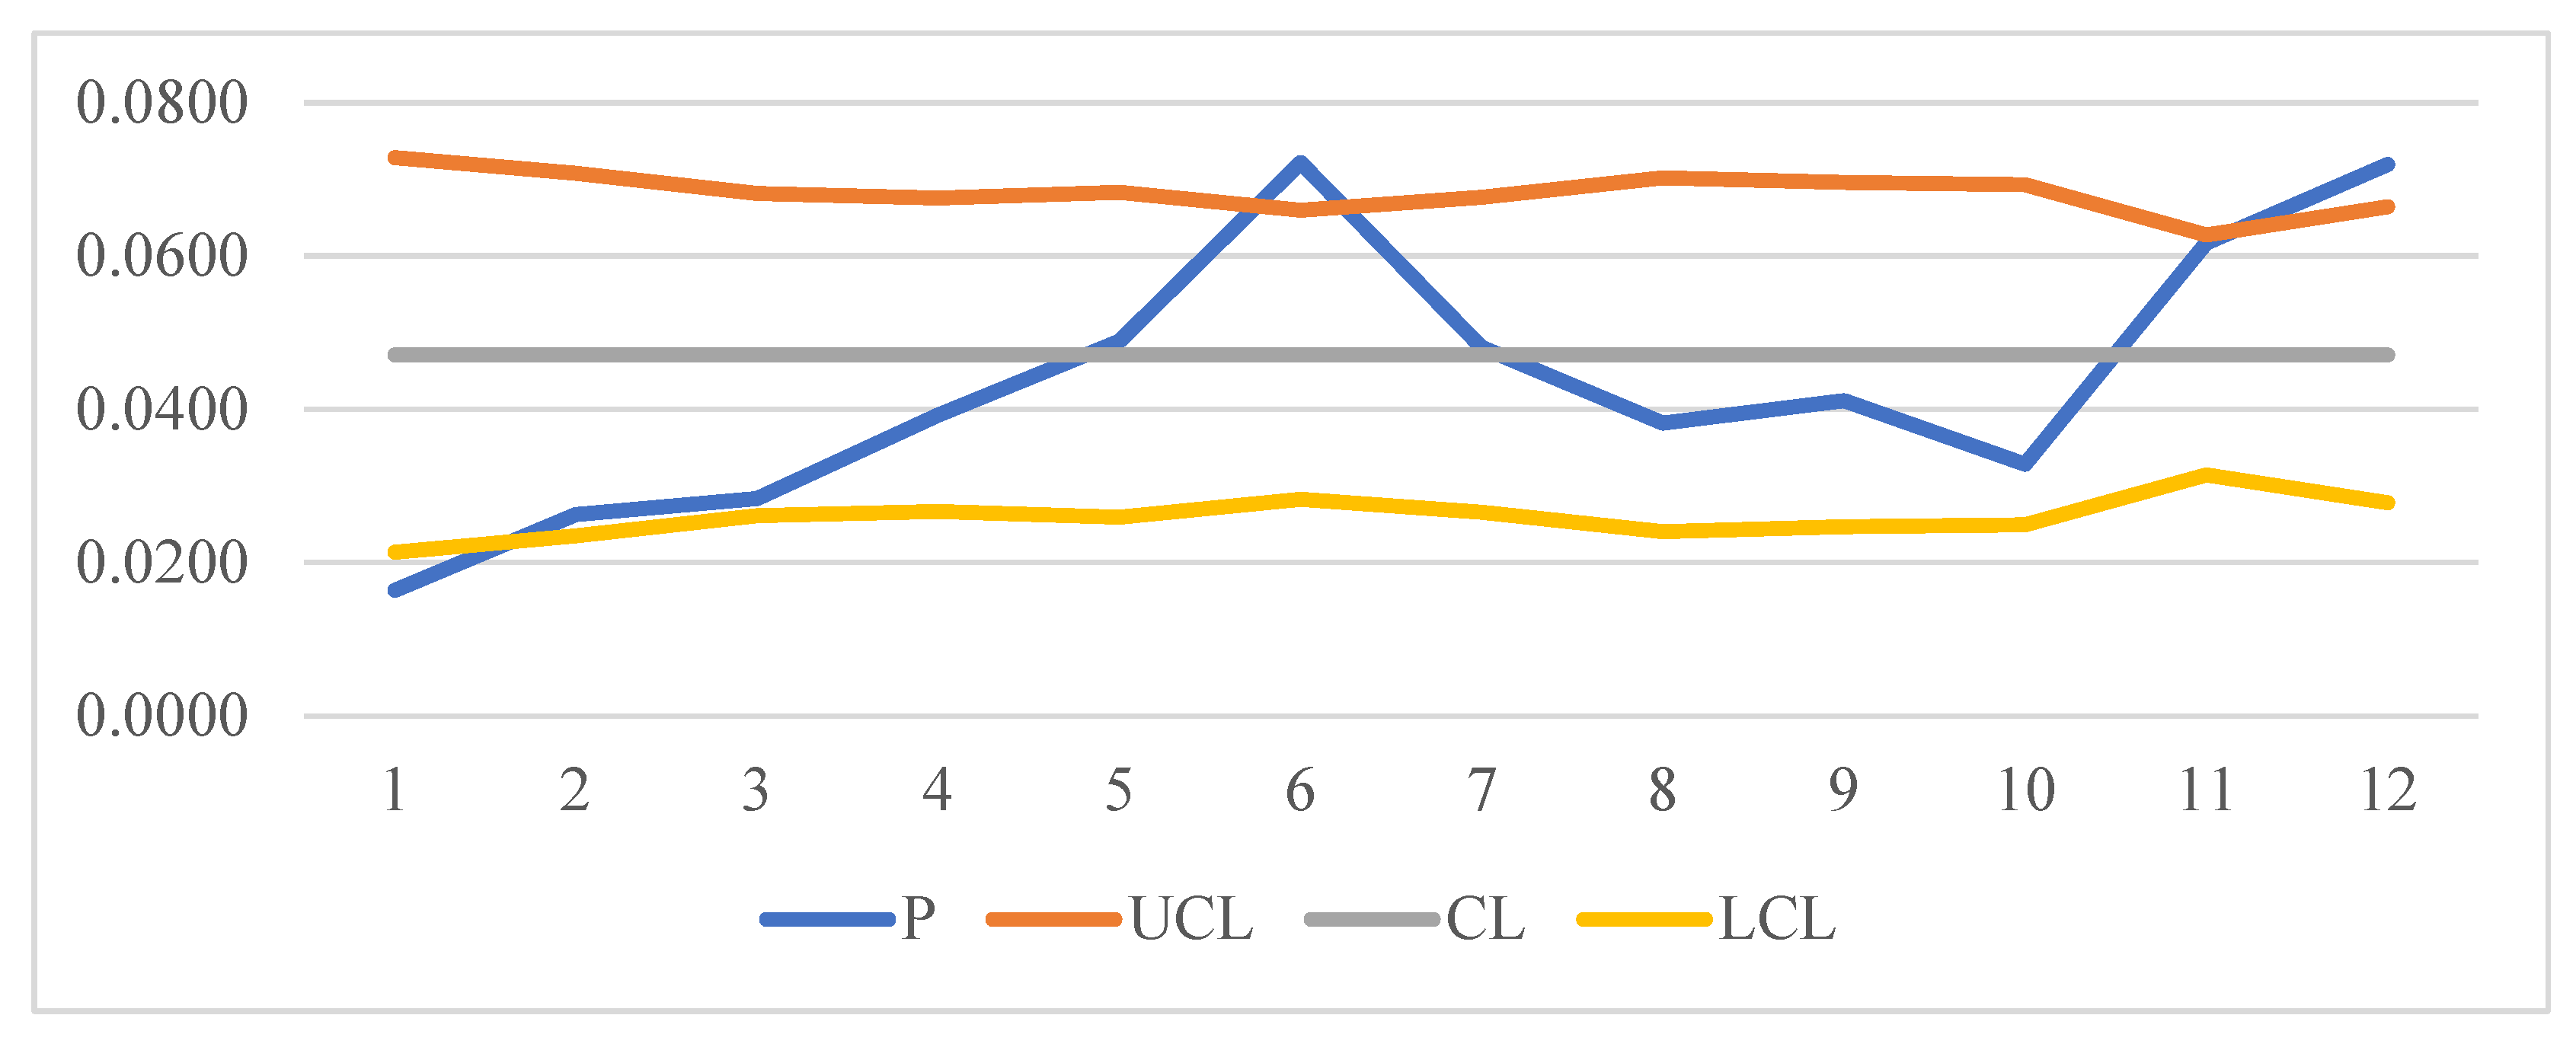
Based on the calculations in Table 2, the P-Chart analysis can be represented graphically, as shown in Figure 3. This chart illustrates the control chart for the period from January 2023 to December 2023.
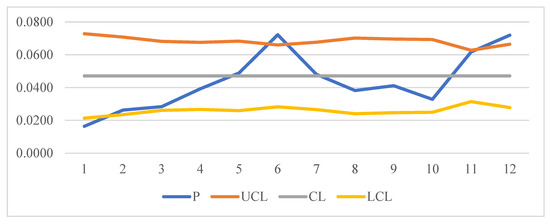
Figure 3.
January 2023–December 2023 control chart.
The control chart reveals several percentages of defects exceeding both the upper and lower control limits. This indicates the need to identify causes and implement corrective actions in the production process of decorative lighting. The proportion of products exceeding the control limits was 1.6% in January, 7.2% in June, 6.17% in November, and 7.2% in December. The high number of defect proportions can be attributed to factors affecting product outcomes, as evidenced by the chart lines exceeding the normal limits. Lines within the control limits suggest that the process is stable or controlled. Therefore, corrective actions are necessary for January, June, November, and December, where the number of defects exceeded the control limits, to restore the process to within normal limits. Continuous monitoring is required to maintain the stability of the production process.
3.2.3. Calculate the Defect per Million Opportunities (DPMOs) Value and Sigma Level
The Defects Per Million Opportunities (DPMOs) value measures the defect or failure rate within a production process, quantifying the number of defects per one million production opportunities. The overall results of the DPMO calculations and sigma levels are shown in Table 3.
Table 3.
DPMO and sigma level calculation.
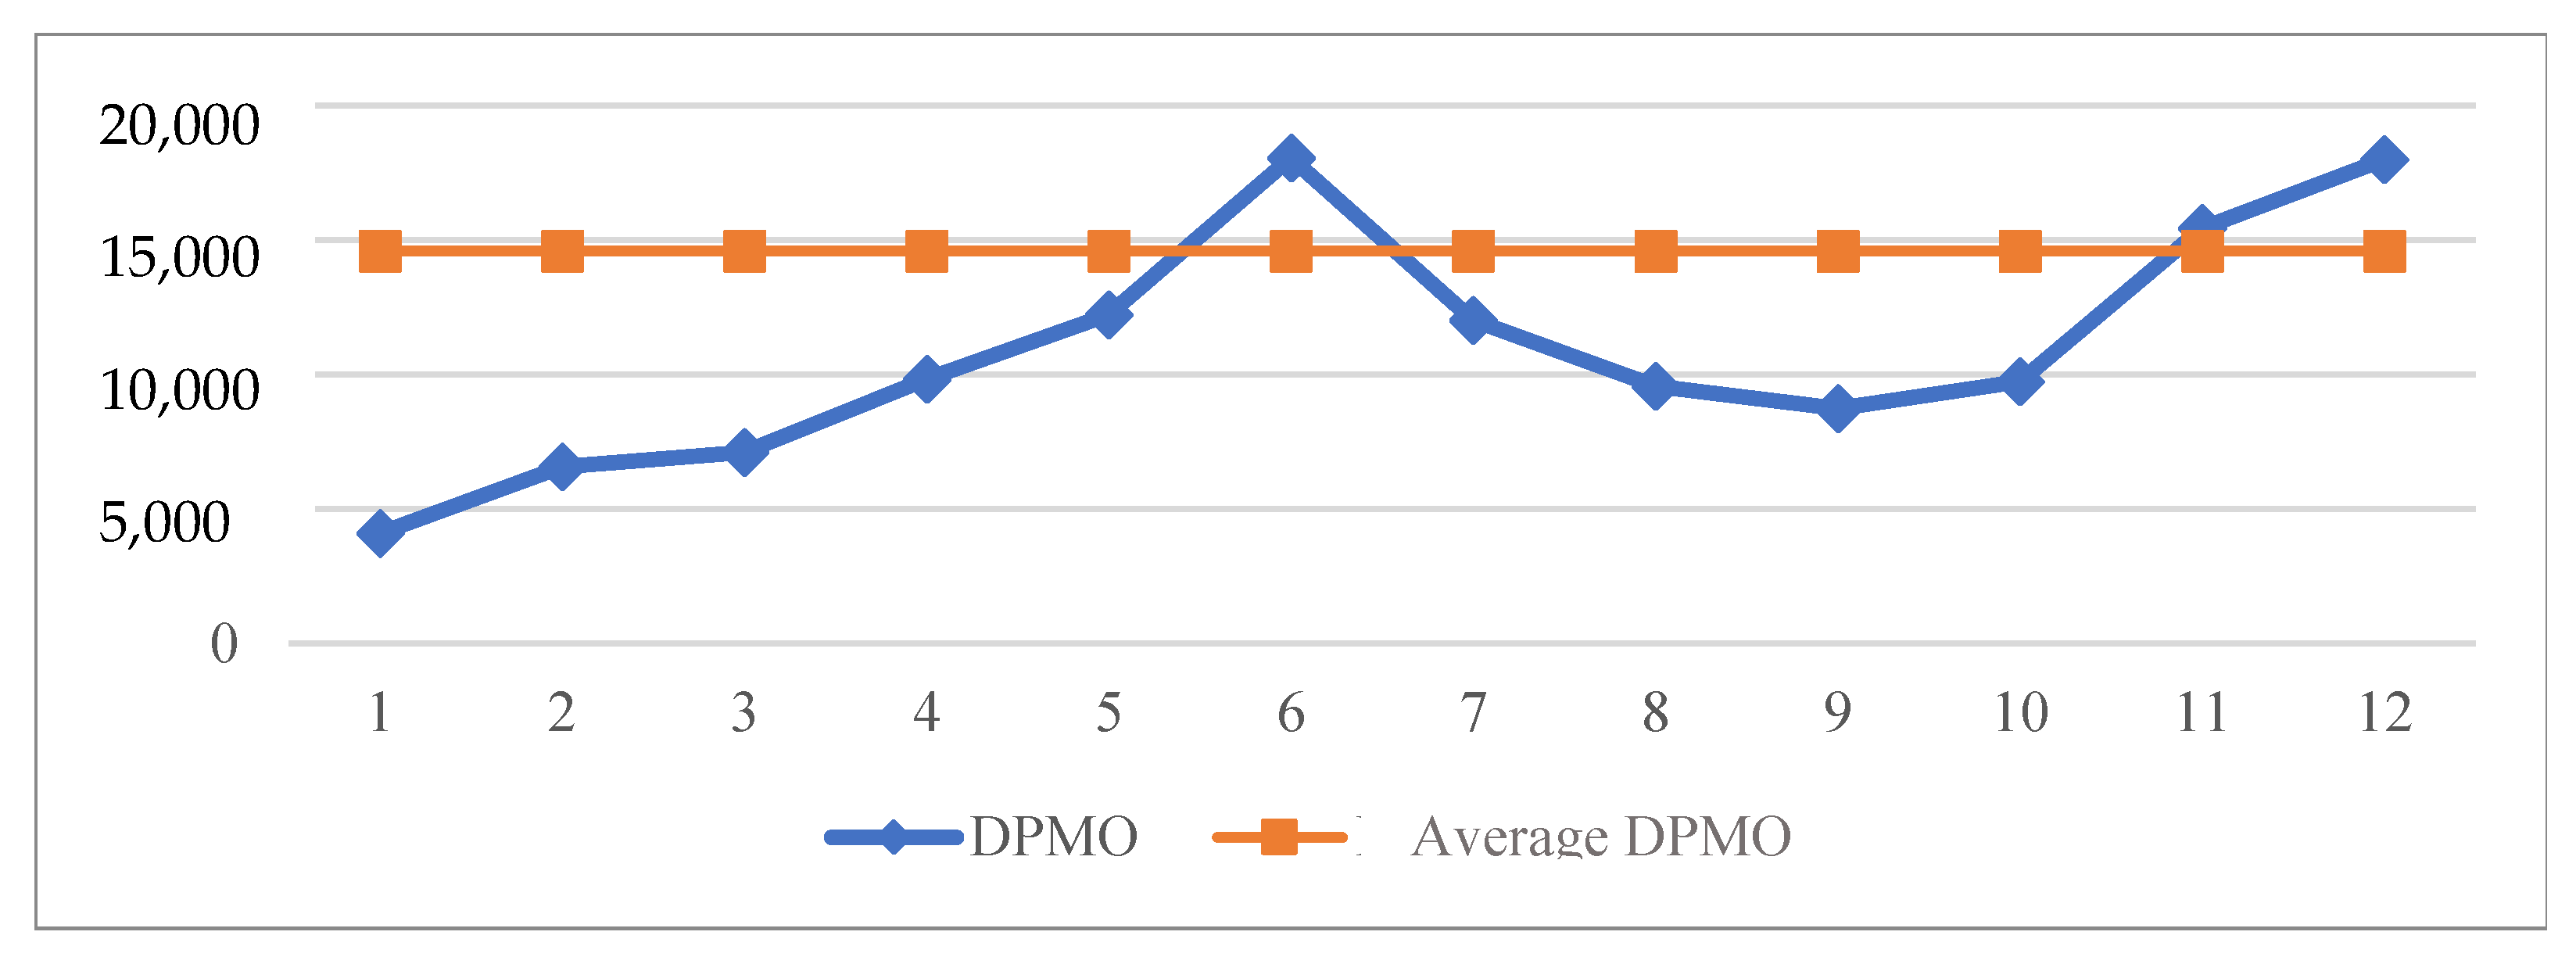
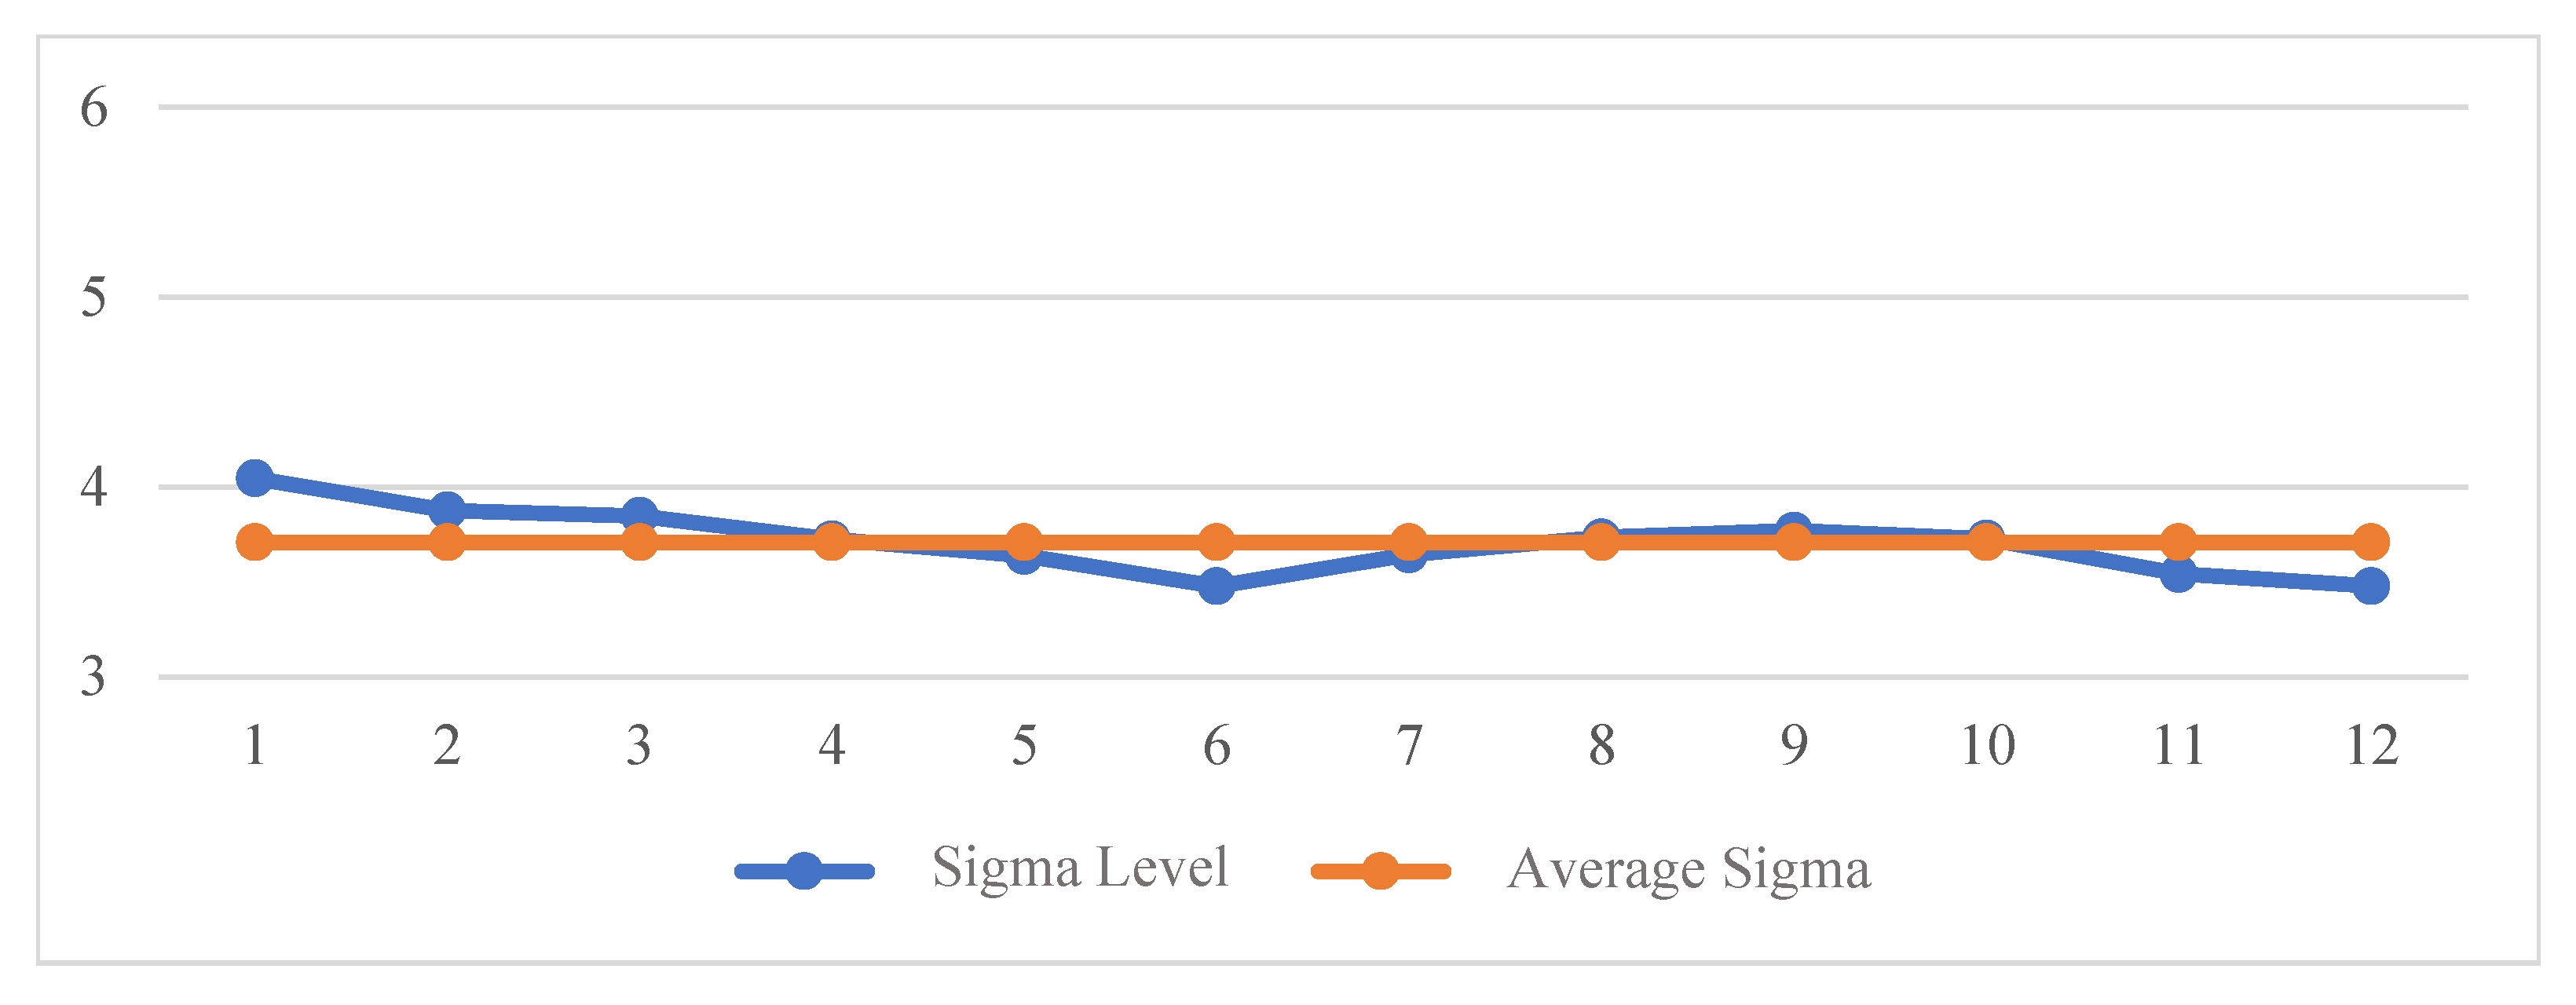
Based on the calculations in Table 3, the DPMO and sigma level results can be graphically represented, as shown in Figure 4 for the DPMO chart and Figure 5 for the sigma level chart, covering the period from January 2023 to December 2023.
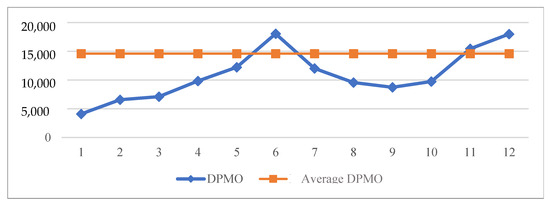
Figure 4.
DPMO chart.
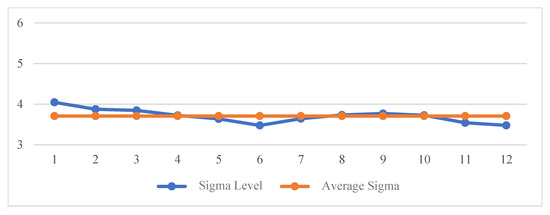
Figure 5.
Sigma level.
Based on the calculations depicted in Figure 4 and Figure 5, the DPMO values exhibited monthly fluctuations and did not consistently achieved sigma levels. The lowest DPMO value was recorded in January at 5464.48, while the highest was in June at 24,061. The sigma levels ranged from a low of 3.476 in June to a high of 4.04 in January. The average DPMO over the year was 14,587.89, indicating that there are approximately 14,587.89 defects per million opportunities in the production process. The average sigma level was 3.7, which corresponds to a defect rate of 66,807 defects per million at a sigma level of 3 and 6210 defects per million at a sigma level of 4. These figures highlight the need for improvements to enhance the production process.
3.3. Analyze
In the Analyze phase, the third stage in the Six Sigma implementation, the collected and calculated data are analyzed to understand the root causes of the issues that were identified in the previous stage. This phase involves three key steps: identifying issues using Pareto diagrams, fishbone diagrams, and Failure Mode and Effect Analysis (FMEA).
3.3.1. Pareto Diagram
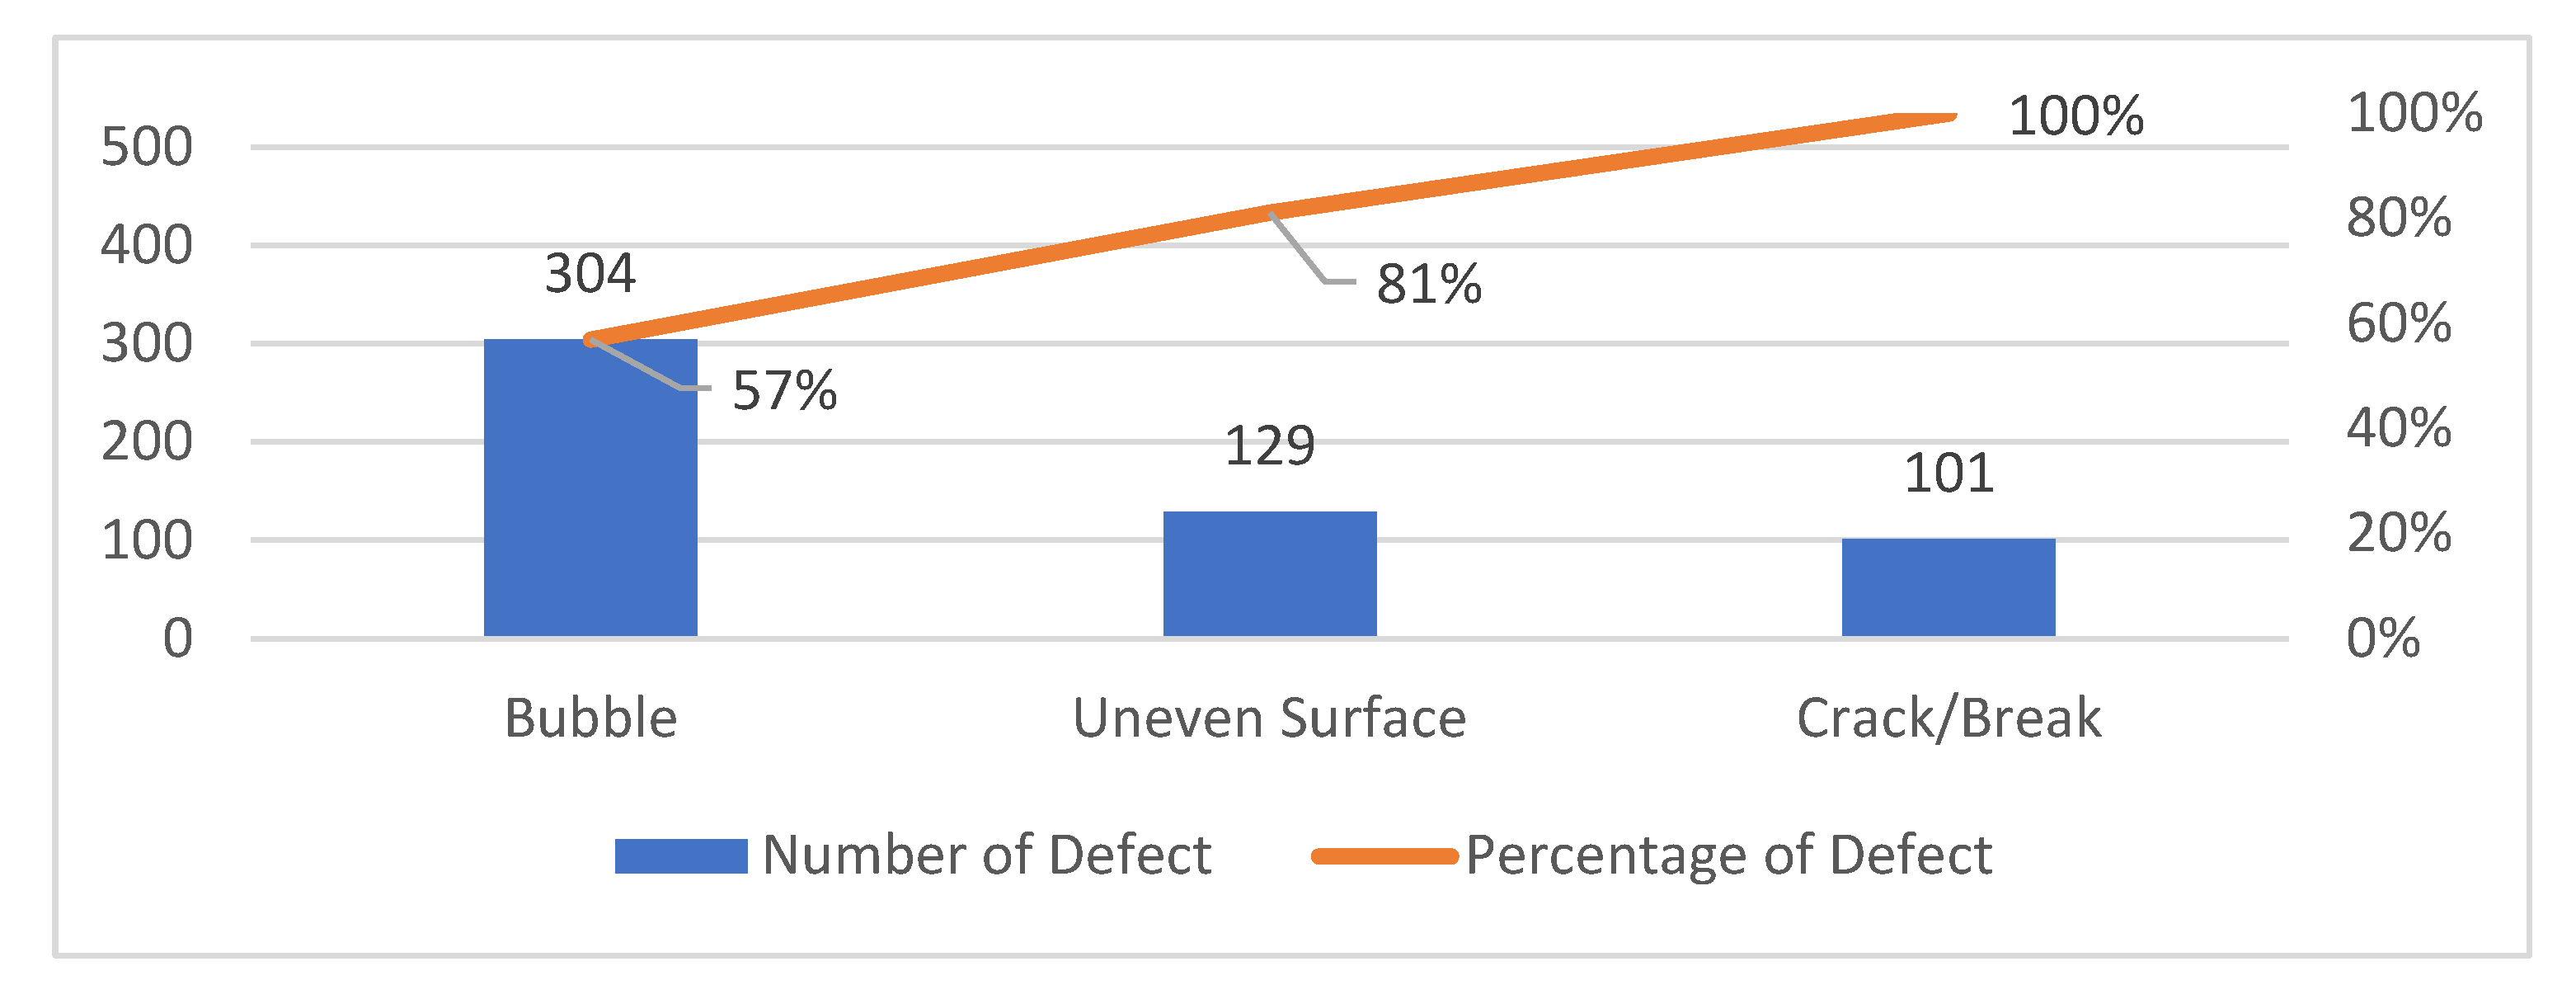
The Pareto diagram is an analytical tool used to identify the causes of defects and prioritize factors that have the most significant impact on the problems or outcomes observed. The Pareto principle, often referred to as the 80/20 rule, suggests that 80% of defects originate from 20% of the causes. The percentage of rejected product types is calculated, and these data can be represented in a Pareto diagram, as shown in Figure 6.
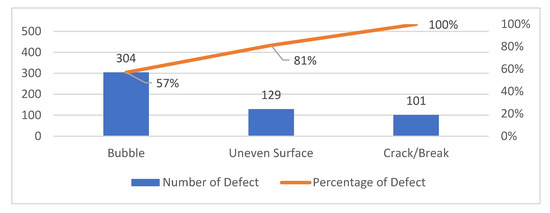
Figure 6.
Pareto diagram.
Based on the calculations of the percentages of defects, as shown in Figure 6, the Pareto diagram reveals that the most significant defect type was bubbling, accounting for 57%, while the least significant was cracking or breaking, at 19%. According to the 80/20 principle, improvements should focus on addressing the defects caused by bubbling and uneven surfaces, as these contribute most significantly to the overall defect rate.
3.3.2. Fishbone Diagram
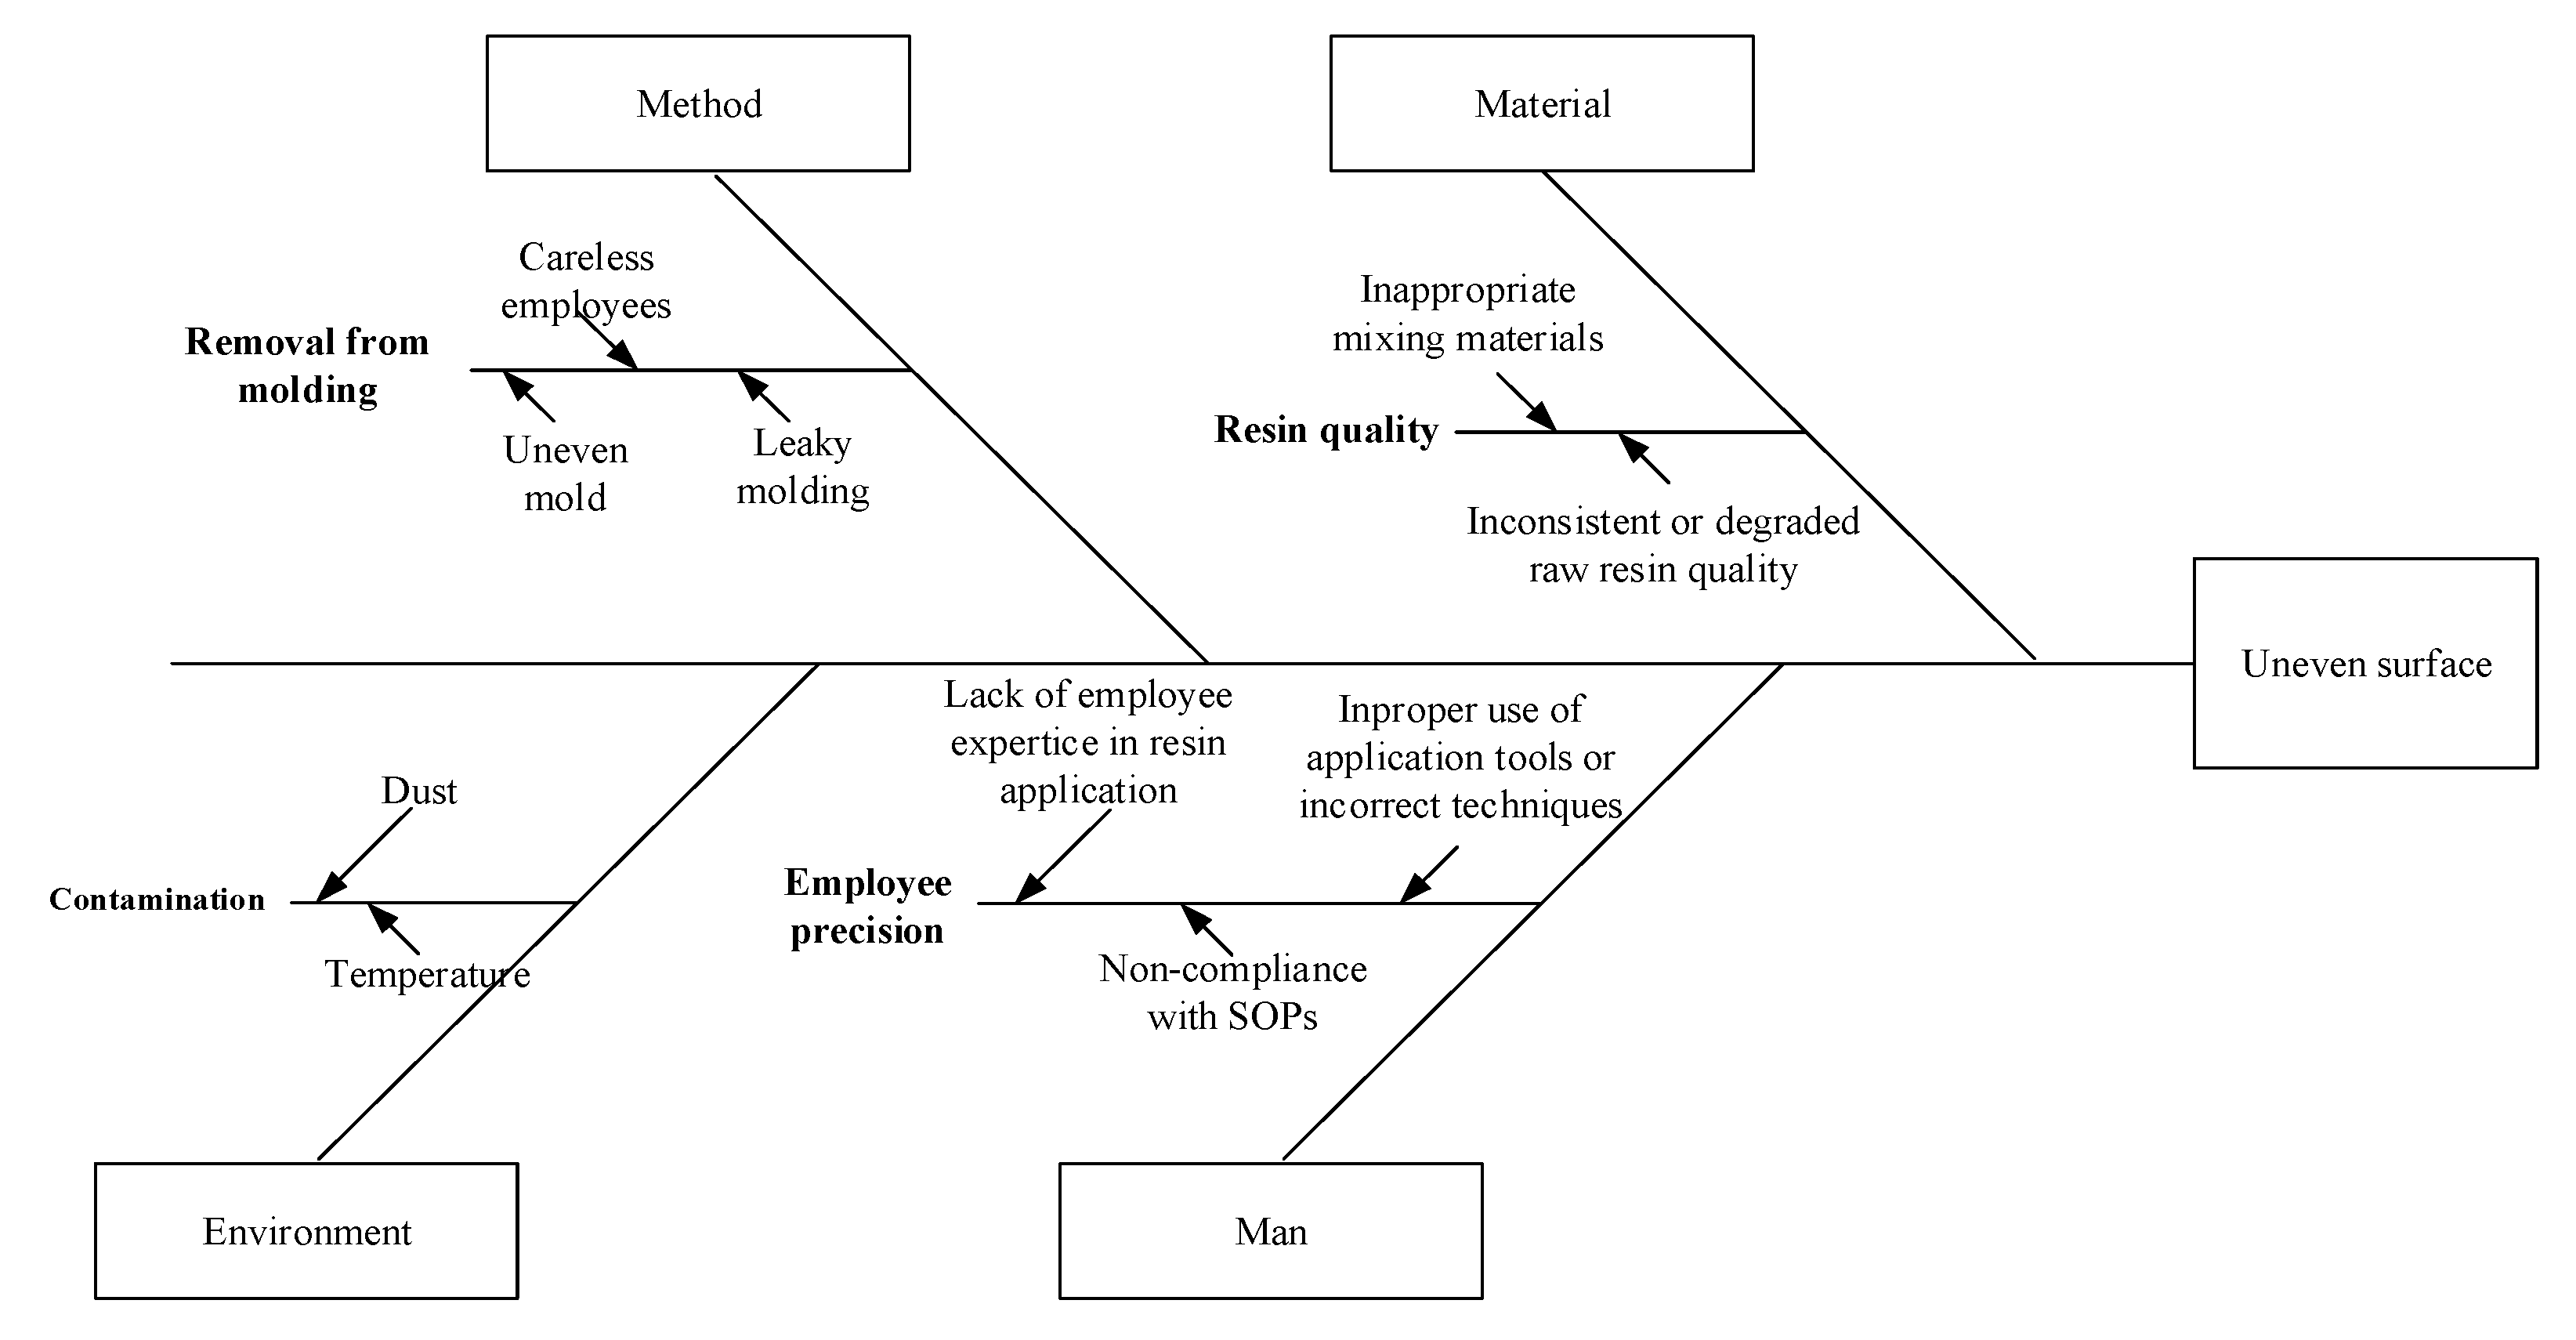
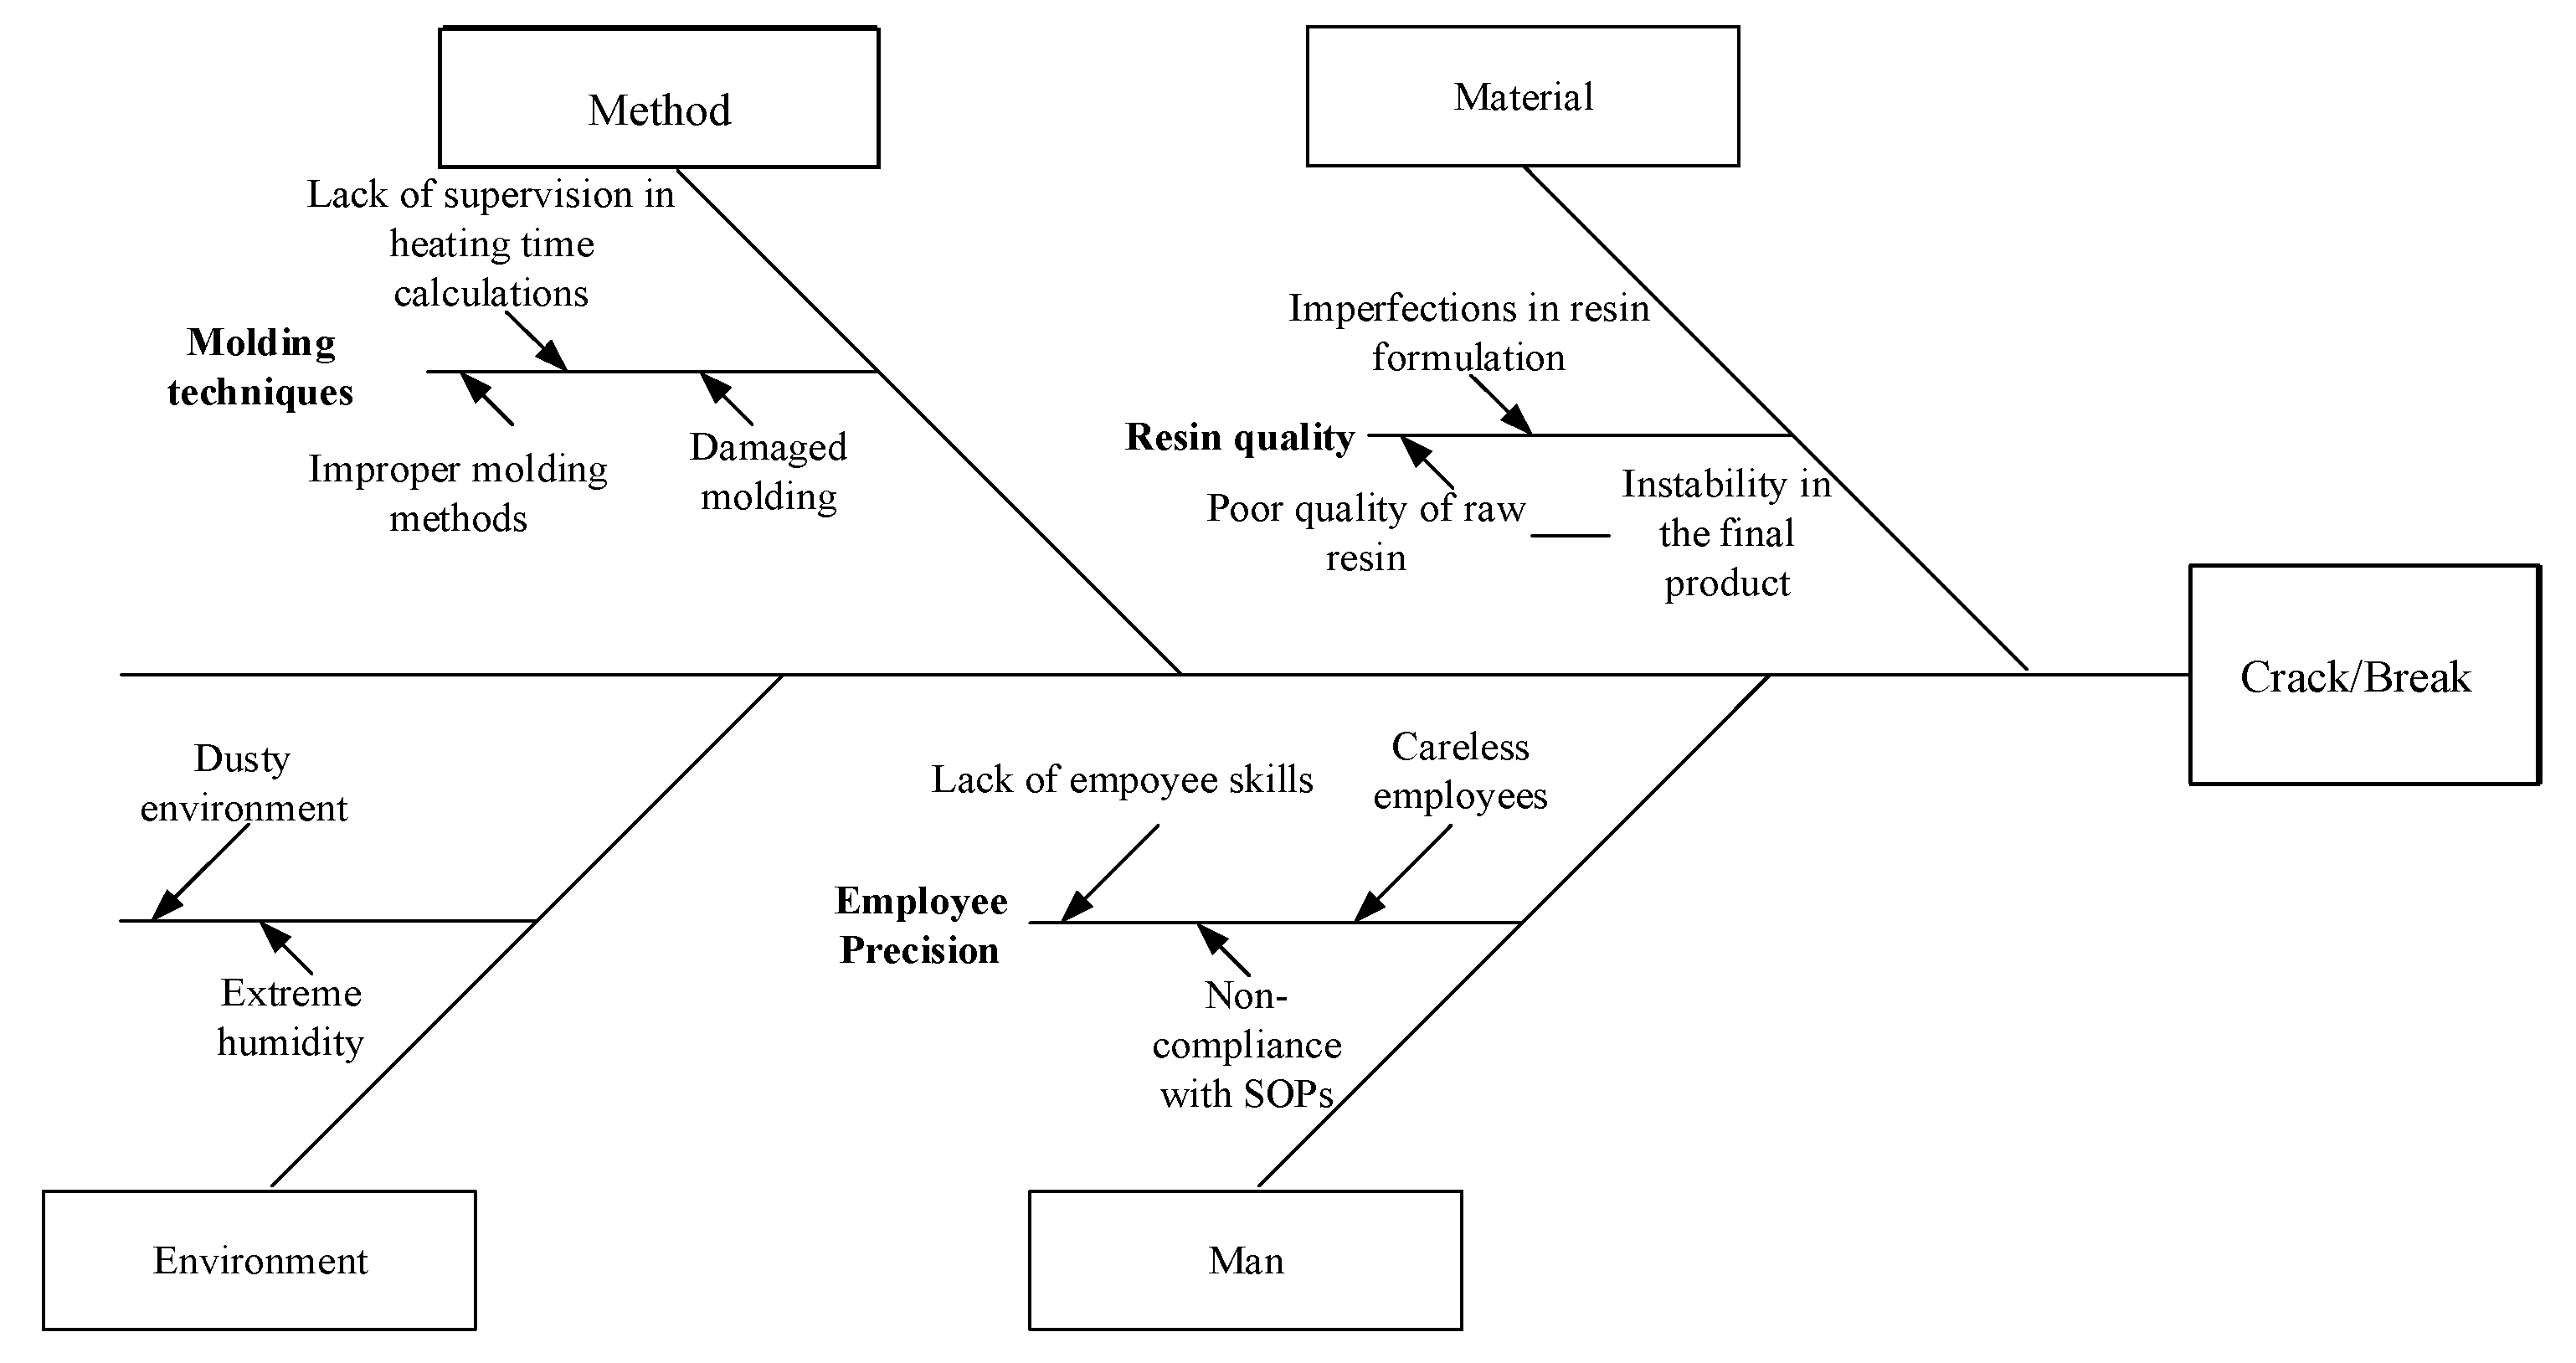
The fishbone diagram is an analytical tool for identifying the root cause of a problem or the process by which a defective product occurs. In this technique, problem identification is carried out by dividing several factors such as humans, methods, materials and the environment for defect bubble in Figure 7, defect uneven surface in Figure 8, and defect crack/break in Figure 9. In collecting data using fishbone, interviews with production parties and brainstorming are required.
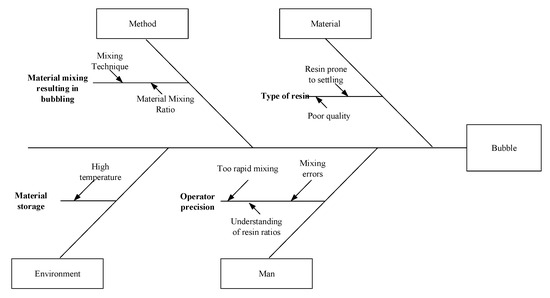
Figure 7.
Fishbone diagram for “bubbles”.
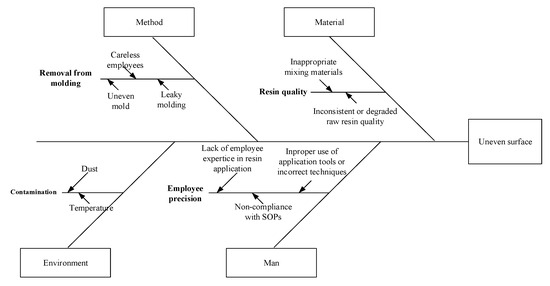
Figure 8.
Fishbone diagram for “uneven surface”.
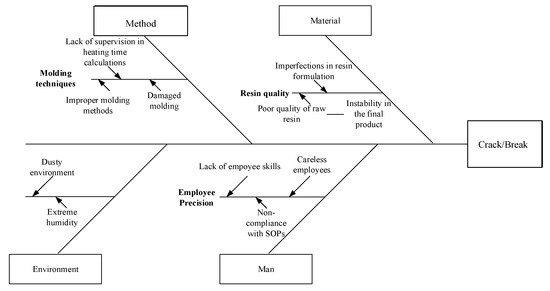
Figure 9.
Fishbone diagram for “crack/break”.
3.3.3. Failure Mode and Effect Analysis (FMEA)
Failure Mode and Effect Analysis (FMEA) is a method that is used to identify potential failures in a product or process, analyze the effects of these failures, and propose improvements to prevent or reduce them in Table 4 for defect bubble, Table 5 for defect uneven surface, and Table 6 for defect crack/break. For the FMEA data collection, interviews were conducted with one QC auditor to inquire about failure causes and with two supervisors to gain more detailed insights into the causes and to assess the severity, occurrence, and detection levels. The data obtained from these interviews are presented in the table below.
Table 4.
Bubble defects.
Table 5.
Uneven surface defects.
Table 6.
Crack/break defects.
Based on the FMEA calculations, the RPN (Risk Priority Number) results for each type of defect were as follows: For bubbling defects, the highest-ranking issue was resin mixing errors, with an RPN of 280. This is due to employees’ lack of focus and insufficient skills in resin mixing, leading to improper mixing and the formation of air bubbles. For uneven surface defects, the highest-ranking issue was manual production processes, with an RPN of 336. This resulted from high consumer demands and production targets, causing inconsistencies in the resin surface layer. For cracking defects, the highest-ranking issue was a dusty environment, with an RPN of 245, leading to employee discomfort and headaches. Based on the identification of defects and their contributing factors, the highest-ranking issues were prioritized for corrective actions to minimize failure causes.
3.4. Improve
Improve is the fourth phase in the Six Sigma methodology, which focuses on proposing improvements based on the analysis conducted in the Measure phase. Based on the FMEA, suggestions were made to minimize the causes of product failure. The proposed improvements for each type of defect are summarized in Table 7 for defect bubble, Table 8 for defect uneven surface, and Table 9.
Table 7.
Proposed improvements for “bubbles”.
Table 8.
Proposed improvements for “uneven surfaces”.
Table 9.
Proposed improvements for “cracks/breaks”.
The following section provides an explanation of the use of a rotary casting design, including its benefits and advantages, that is specifically tailored for decorative lighting products. Rotary casting in Figure 10 is a technique that is used in the production of resin-based products. This process involves slowly rotating a mold while resin is poured into it. The machine is designed to ensure an even distribution of resin within the mold, resulting in a final product that is consistent in quality and texture. By using a rotary casting machine, manufacturers can create products with greater precision and smoother surfaces compared to traditional static molding methods, and the production process becomes more efficient.
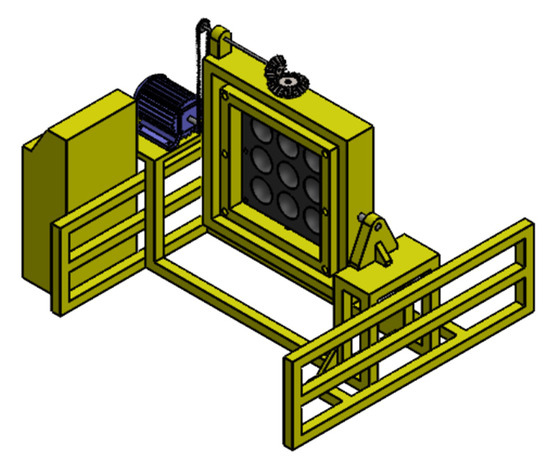
Figure 10.
Rotary Casting Design.
3.5. Control
Control is the final phase in the Six Sigma methodology, focusing on ongoing supervision and monitoring to enhance the production quality and minimize defects based on the proposed improvements:
- Provide training for employees to develop skills in resin mixing according to SOPs and conduct monthly evaluations to assess their proficiency.
- Supervisors and production managers are responsible for improving the quality on the production line by overseeing operations and updating SOPs as guidelines for employees.
- Conduct briefings for each production line before starting production to prevent miscommunication among employees and ensure that the work results meet expectations.
- Enhance monitoring, inspection, and maintenance of molding and measuring equipment before use and perform cleaning after production to ensure that the equipment is not contaminated by dust particles.
4. Conclusions
Based on the quality control study at PT XYZ, the following conclusions can be drawn:
- From January 2023 to December 2023, PT XYZ produced a total of 11,330 units, with 534 units being identified as defective. The production process revealed three types of defects: bubbling (304 units), uneven surfaces (129 units), and cracking (101 units). The average number of Defects Per Million Opportunities (DPMOs) was 14,587.89, and the average sigma level was 3.7, which aligns with the industry average in Indonesia.
- According to the FMEA calculations, the bubbling defect had the highest Risk Priority Number (RPN) of 280, attributed to resin mixing errors caused by insufficient employee focus and skill. Uneven surface defects had the highest RPN of 336, resulting from manual production processes that are driven by high consumer demands and production targets. The cracking defect had the highest RPN of 245, due to a dusty environment resulting from inadequate use of personal protective equipment (PPE) and insufficient supervision.
- Based on the FMEA findings, the following improvement measures are recommended: providing employee training, conducting pre-production briefings, evaluating each production run on a monthly basis, employing rotary casting equipment, enforcing PPE usage, and cleaning the production area after sanding.
Author Contributions
Conceptualization, A.S.P. and A.A.S.; methodology, A.S.P.; software, A.A.S.; validation, A.A.S., A.K.A.G. and S.N.; formal analysis, A.S.P.; investigation, A.A.S.; resources, A.S.P.; data curation, A.A.S.; writing—original draft preparation, A.A.S.; writing—review and editing, A.S.P.; visualization, S.N.; supervision, A.S.P.; project administration, A.K.A.G.; funding acquisition, A.S.P. All authors have read and agreed to the published version of the manuscript.
Funding
This research was funded by the Tridharma Integration Grant of Universitas Muhammadiyah Surakarta, under Grant No. 113/A.3-III/FT/III/2021.
Institutional Review Board Statement
Not applicable.
Informed Consent Statement
Not applicable.
Data Availability Statement
The data of this article are available on request from the corresponding author.
Acknowledgments
The authors would like to express their sincere gratitude to Universitas Muhammadiyah Surakarta for supporting this research through the Tridharma Integration Grant. This support has been invaluable in facilitating the successful completion of this study.
Conflicts of Interest
The authors declare no conflict of interest.
References
- Kurniawan, P.; Hartati, W.; Qodriah, S.L.; Badawi, B. From knowledge sharing to quality performance: The role of absorptive capacity, ambidexterity and innovation capability in creative industry. Manag. Sci. Lett. 2020, 10, 433–442. [Google Scholar] [CrossRef]
- Ratnawati, S. Ekonomi Kreatif dan Kaizen. J. Rekomen 2018, 1, 1–23. [Google Scholar]
- Salim, A.; Muryanto; Suwoto; Alfath, M.; Rizal, M.Z. PELATIHAN PEMBUATAN KERAJINAN RESIN SEBAGAI KETERAMPILAN UNTUK MEMBANGKITKAN KEWIRAUSAHAAN MASYARAKAT. Pros. SENANTIAS Semin. Nas. Has. Penelit. Dan PKM 2023, 4, 416–421. [Google Scholar]
- Arteaga, A.G.; Calvo, R. Experimental analysis of alternative production flow controls for high variety product manufacturing. Procedia Manuf. 2019, 41, 82–89. [Google Scholar] [CrossRef]
- Margarette, A.; Pujotomo, D. Analisis Pengendalian Kualitas Proses Produksi Kain Batik Menggunakan Metode Statistical Process Control (Spc). Ind. Eng. Online J. 2018, 6, 16–23. [Google Scholar]
- Irwanto, A.; Arifin, D.; Arifin, M.M. Peningkatan Kualitas Produk Gearbox Dengan Pendekatan Dmaic Six Sigma Pada Pt. X, Y, Z. J. KaLIBRASI—Karya Lintas Ilmu Bid. Rekayasa Arsit. Sipil Ind. 2020, 3, 1–17. [Google Scholar] [CrossRef]
- Faiq, A.; Nurhajati; Hufron, M. Analisis Pengendalian Kualitas Proses Produksi Jenang Apel Dengan Metode Statistical Process Control (SPC) Untuk Menurunkan Tingkat Kerusakan Produk (Studi di CV. Bagus Agriseta Mandiri Batu). J. Ris. Manaj. 2018, 7, 67–78. [Google Scholar]
- Huang, P.L.; Lee, B.C.Y.; Chen, C.C. The influence of service quality on customer satisfaction and loyalty in B2B technology service industry. Total Qual. Manag. Bus. Excell. 2019, 30, 1449–1465. [Google Scholar] [CrossRef]
- Rahman, Z.H.; Retno, W.; Damayanti, S.T. Implementasi Six Sigma dalam Peningkatan Kualitas Proses Produksi Style S5 di PT XYZ. In Proceedings of the Seminar dan Konferensi Nasional IDEC, Surakarta, Indonesia, 23 July 2022; pp. 1–10. [Google Scholar]
- Dewa, P.K.; Dewi, L.T. Identifikasi Human Error pada Rantai Pasok Industri Kreatif: Adopsi Model SCOR. J. Chem. Inf. Model 2018, 53, 21–25. [Google Scholar]
- Ishak, A.; Siregar, K.; Asfriyati; Naibaho, H. Quality Control with Six Sigma DMAIC and Grey Failure Mode Effect Anaysis (FMEA): A Review. IOP Conf. Ser. Mater. Sci. Eng. 2019, 505, 012057. [Google Scholar] [CrossRef]
- Widodo, A.; Soediantono, D. Benefits of the Six Sigma Method (DMAIC) and Implementation Suggestion in the Defense Industry: A Literature Review Manfaat Metode Six Sigma (DMAIC) dan Usulan Penerapan Pada Industri Pertahanan: A Literature Review. J. Soc. Manag. Stud. 2022, 3, 1–12. [Google Scholar]
- Untoro, O.B.; Iftadi, I. Six Sigma as a Method for Controlling and Improving the Quality of Bed Series Products. J. Ilm. Tek. Ind. 2020, 19, 131–141. [Google Scholar] [CrossRef]
- Sufa, M.F.; Ambarsari, R. Improving The Quality of Product Packaging Using The Six Sigma Method. In Proceedings of the International Summit on Science Technology and Humanity (ISETH) 2020, Surakarta, Indonesia, 16 December 2020; pp. 184–188. [Google Scholar]
- Ahmad, F. Six Sigma Dmaic Sebagai Metode Pengendalian Kualitas Produk Kursi Pada Ukm. JISI J. Integr. Sist. Ind. 2019, 6, 11–17. [Google Scholar]
- Kartikasari, V.; Romadhon, H. Analisa Pengendalian dan Perbaikan Kualitas Proses Pengalengan Ikan Tuna Menggunakan Metode Failure Mode And Effect Analysis (FMEA) dan Fault Tree Analysis (FTA) Studi kasus di PT XXX Jawa Timur. J. Ind. View 2019, 1, 1–10. [Google Scholar] [CrossRef]
- Djunaidi, M.; Liliana, N.E.; Fahmi, A.A.; Sufa, M.F. Quality Control of Kinasih Bread Products Using Statistical Quality Control and Failure Mode and Effect Analysis Methods. J. Ilm. Tek. Ind. 2024, 23, 40–51. [Google Scholar] [CrossRef]
- Rahman, A.; Perdana, S. Analisis Perbaikan Kualitas Produk Carton Box di PT XYZ Dengan Metode DMAIC dan FMEA. J. Optimasi Tek. Ind. 2021, 3, 33–37. [Google Scholar] [CrossRef]
- Birugo, A.U.R.; Baleh, T.; Bukittinggi, K. Analisis Kerusakan Jalan Raya Pada Lapis Permukaan Dengan Metode Pavement Condition Index (PCI) Dan Metode Bina Marga (Studi Kasus Ruas Jalan Landai Sungai Data STA 0 + 000 − STA 2 + 000). J. Ensiklopediaku 2023, 2, 167–174. [Google Scholar]
- Putri, A.A.; Marzuki, M.; Nurlaili, N. Analisis Pengendalian Kualitas Pengantongan Semen Pada PT. Solusi Bangun Andalas Menggunakan Metode Six Sigma Dengan Pendekatan DMAIC. J. Mesin Sains Terap. 2023, 7, 92–97. [Google Scholar] [CrossRef]
- Ilmi, N.; Lawi, A. Penerapan Metode Six Sigma dalam Menganalisis dan Menanggulangi Defect Rate pada Pengelasan Tubular. J. Tek. Ind. 2022, 1, 128–137. [Google Scholar]
- Pardiyono, R.; Jenderal, U.; Yani, A.; Sigma, S. Identifikasi Penyebab Cacat Dominan. Pros. Penelit. Pendidik. Dan Pengabdi. 2021, 1, 505–511. [Google Scholar]
- Lestari, A.; Mahbubah, N.A. Analisis Defect Proses Produksi Songkok Berbasis Metode FMEA dan FTA di Home—Industri Songkok GSA Lamongan. Serambi Eng. 2021, 6, 2197–2206. [Google Scholar] [CrossRef]


Disclaimer/Publisher’s Note: The statements, opinions and data contained in all publications are solely those of the individual author(s) and contributor(s) and not of MDPI and/or the editor(s). MDPI and/or the editor(s) disclaim responsibility for any injury to people or property resulting from any ideas, methods, instructions or products referred to in the content. |
© 2025 by the authors. Licensee MDPI, Basel, Switzerland. This article is an open access article distributed under the terms and conditions of the Creative Commons Attribution (CC BY) license (https://creativecommons.org/licenses/by/4.0/).