Abstract
Mass spectrometry is the most reliable and accurate approach for analyzing a complex biological sample and identifying its protein content, which is time-consuming and reasonably expensive. One possible option to overcome such limitations is to use potentiometric sensors based on transistors. However, for such technology to work, a protein database that contains information on billions of small peptides and amino acids (AA) is required. The only practical way to build such a database is to use machine learning, and this study is going to show the initial steps towards achieving this aim. This study sheds light on the possibility of a new approach for peptide sequencing combining analytical simulations with large language models (LLM) based on Sequence-2-Sequence (Seq-2-Seq) architecture built by long short-term memory (LSTM) networks. A total of 11,573 tokenized data points (voltage and capacitance cross-over points) with a vocabulary size of 504 are fed into the model; 80% of the data are used for training and validation, and 20% are used for testing. The model is tested on unseen data and the accuracy during the test is 71.74%, which is significant if compared to expensive and time-consuming conventional methods, i.e., spectrometry. In conclusion, the output results of this study show that the proposed Seq-2-Seq LLM architecture could be used to build a material database for a potentiometric sensor to replace the mass spectrometry method.
1. Introduction
Currently, mass spectrometry is considered the most reliable and accurate method for analyzing complex biological samples and identifying their protein content. However, this technique is both time-consuming and expensive. One potential solution to these limitations is the use of potentiometric sensors based on transistors [1]. For such technology to be effective, it would require a comprehensive protein database containing information on billions of small peptides and amino acids (AA). The most practical way to construct this extensive database is by employing machine learning, and this study explores the initial steps toward that goal.
This study tries to shed a light on the possibility of a novel peptide sequencing method that integrates analytical simulations with large language models (LLMs) based on a Sequence-to-Sequence (Seq-2-Seq) architecture built using long short-term memory (LSTM) networks [2,3]. The paper begins by describing how to measure the potential and capacitance of peptides and how to create a database for each peptide, including the corresponding zero cross-over points for potential and capacitance [4]. Next, it provides a detailed overview of the LSTM neural networks and the Seq-2-Seq LLM architecture used in the proposed model. Following this, the paper presents the simulation results of the model, and finally, it concludes with a discussion of future directions for research.
2. Peptide Potential and Capacitance Measurement
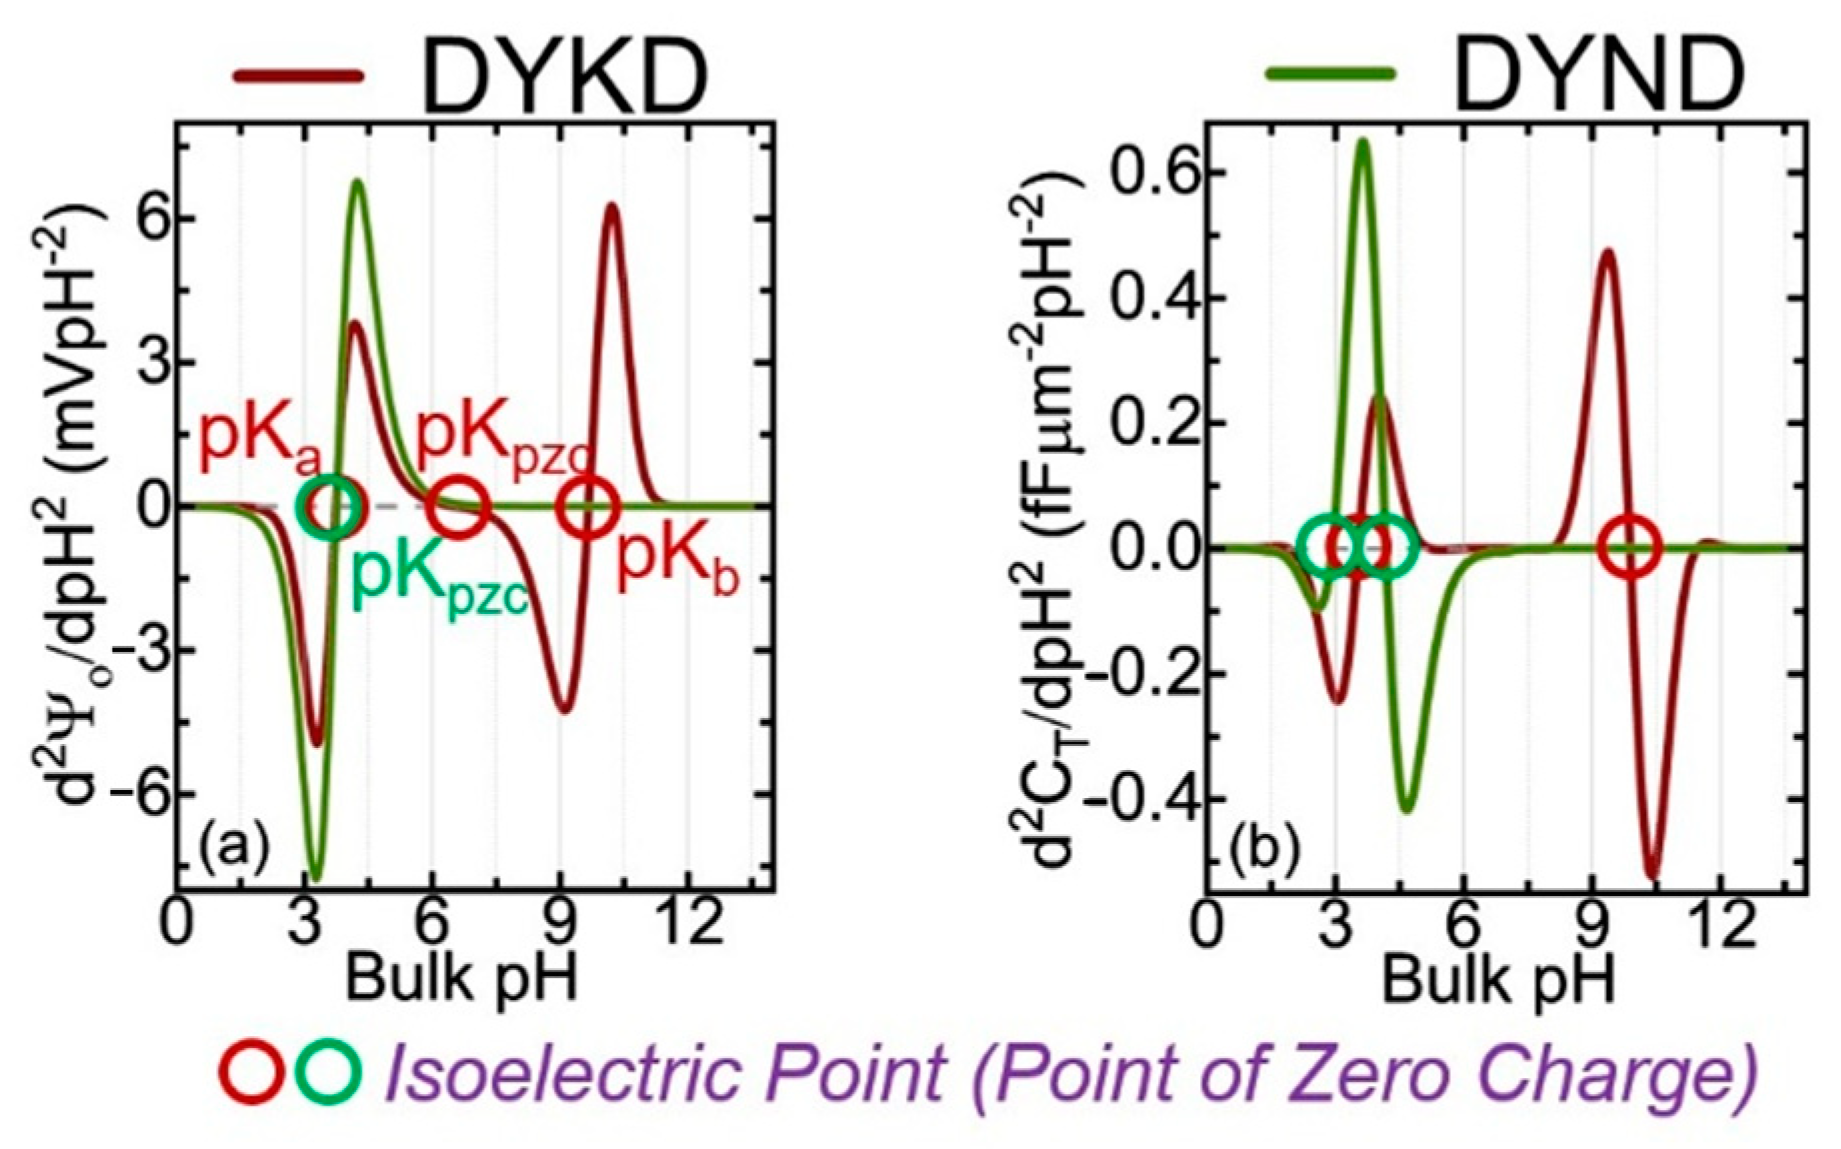
Figure 1 shows the calculated potential and capacitance for two oligopeptides made of four AAs, using the analytical approach based on the Gouy–Chapman–Stern (GCS) and site-binding models [4]. The only difference between DYKD and DYND is the presence of a mutation (change in AA) at the third position where K is replaced with N. The information presented in Figure 2 shows the cross-over points of the second derivative of the surface potential (d2Ψ0/dpH2) [4].
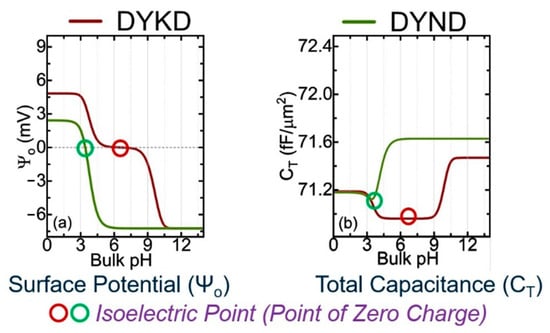
Figure 1.
Analytical results for the calculated surface potential () and total system capacitance (CT) for two oligopeptides, (a) DYKD (red line) and (b) DYND (green line). The circles are the isoelectric points that can be compared with experimental values [4].

Figure 2.
Analytically calculated 2nd derivative of the surface potential (d2Ψ0/dpH2) and total capacitance (d2CT/dpH2) as a function of pH. pKa and pKb are the dissociation constants and pKpzc is the point of zero charges for both proteins. The values can be compared with experiments [4].
In this figure, the curves cross with the zero dashed line; they represent the pKa, pKb, and pKpzc for each oligopeptide. All potential and capacitance curves have unique profiles [4].
3. LSTM
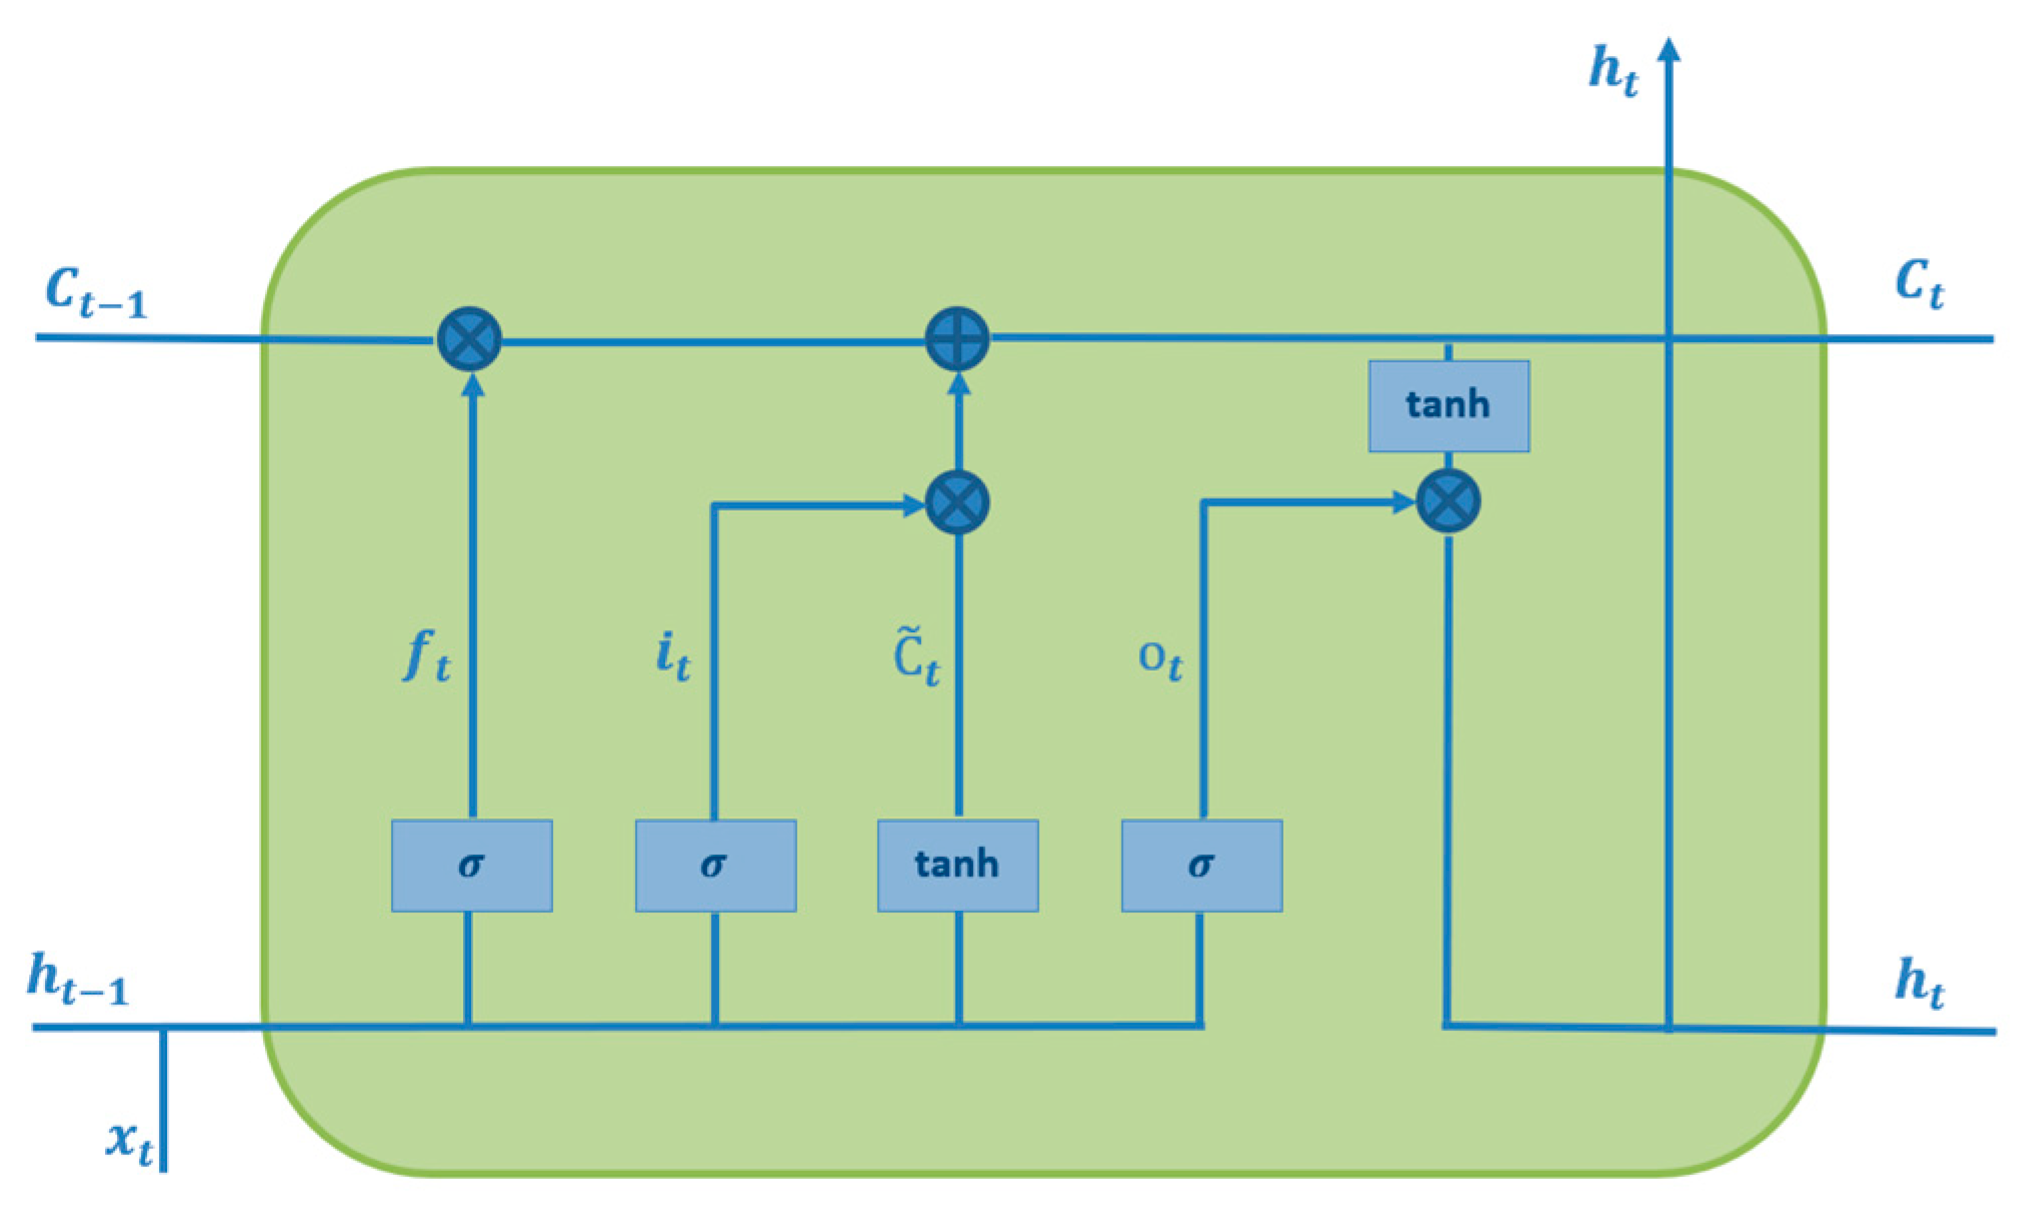
The sequential model for LSTM is demonstrated in Figure 3, sliding on the predefined sequence of input data to generate an output sequence of data points or output time series. Each cell is fed by the sequence of input time-series data points [5]. Upcoming output data points and the cell’s output are concatenated together to generate new input data points for the next data point. This repetitive procedure has been carried out to cover whole data points. F. In 1999, Gers introduced the LSTM network, a new type of RNN that consists of four main parts, namely, an input gate, input candidate gate, output gate, and forget gate [6]. The forget gate plays a key role in LSTM to forget the former non-important cell’s state and remember the crucial state, expressed as follows:
the or sigmoid is an activation function widely used for adding nonlinear features to a model as follows:
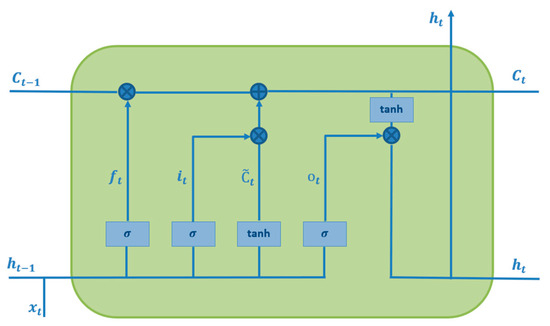
Figure 3.
Internal structure of the LSTM cell.
To generate a new cell state , the input gate and input candidate gate are activated simultaneously. This process is repeated across the entire data sequence [5]. The input gate utilizes a sigmoid function, while the input candidate gate applies a hyperbolic tangent function to compute the new cell state. Together, these gates work to update as follows:
The function is a hyperbolic tangent function that maps the input to a continuous number between −1 and 1.
4. Sequence-2-Sequence Architecture
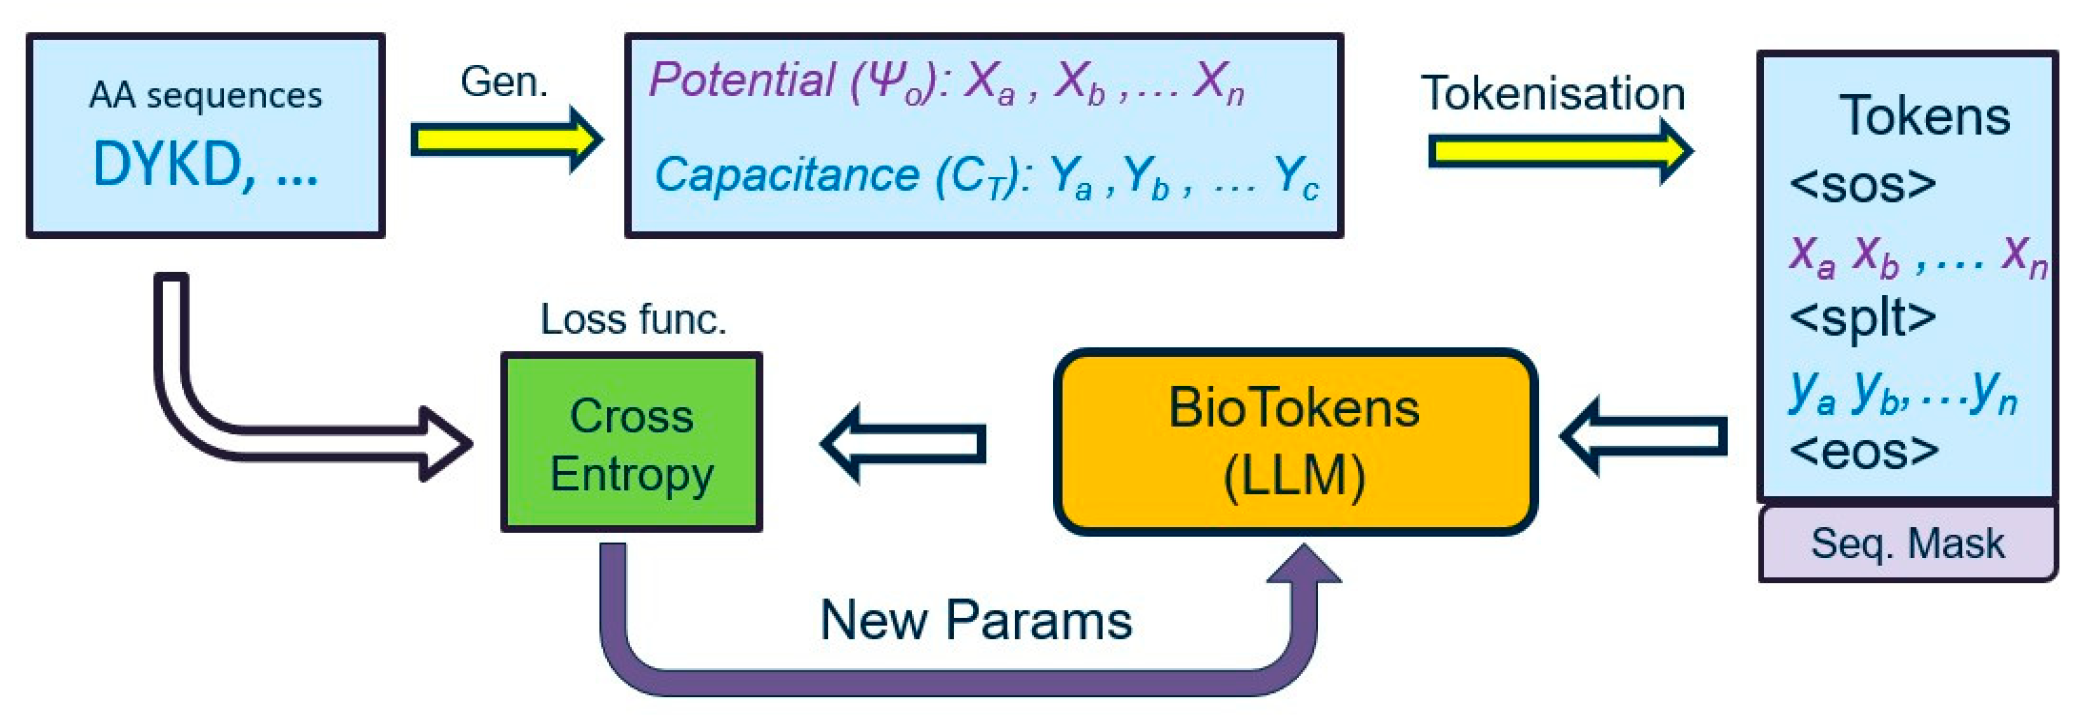
Figure 4 presents the overall data, analyzing a pipeline we considered in our proposed approach used to translate potential and capacitance measurements into the equivalent protein sequence. First, tokenization converts measurements and proteins into tokens to create a vocabulary database and then feeds tokenized data to the proposed LLM model to train, validate, and test the proposed approach.

Figure 4.
Flowchart of the data pipeline for the proposed machine learning architecture. Each protein is represented with potential and capacitance curves, and they are converted to tokens that are fed into the large language model.
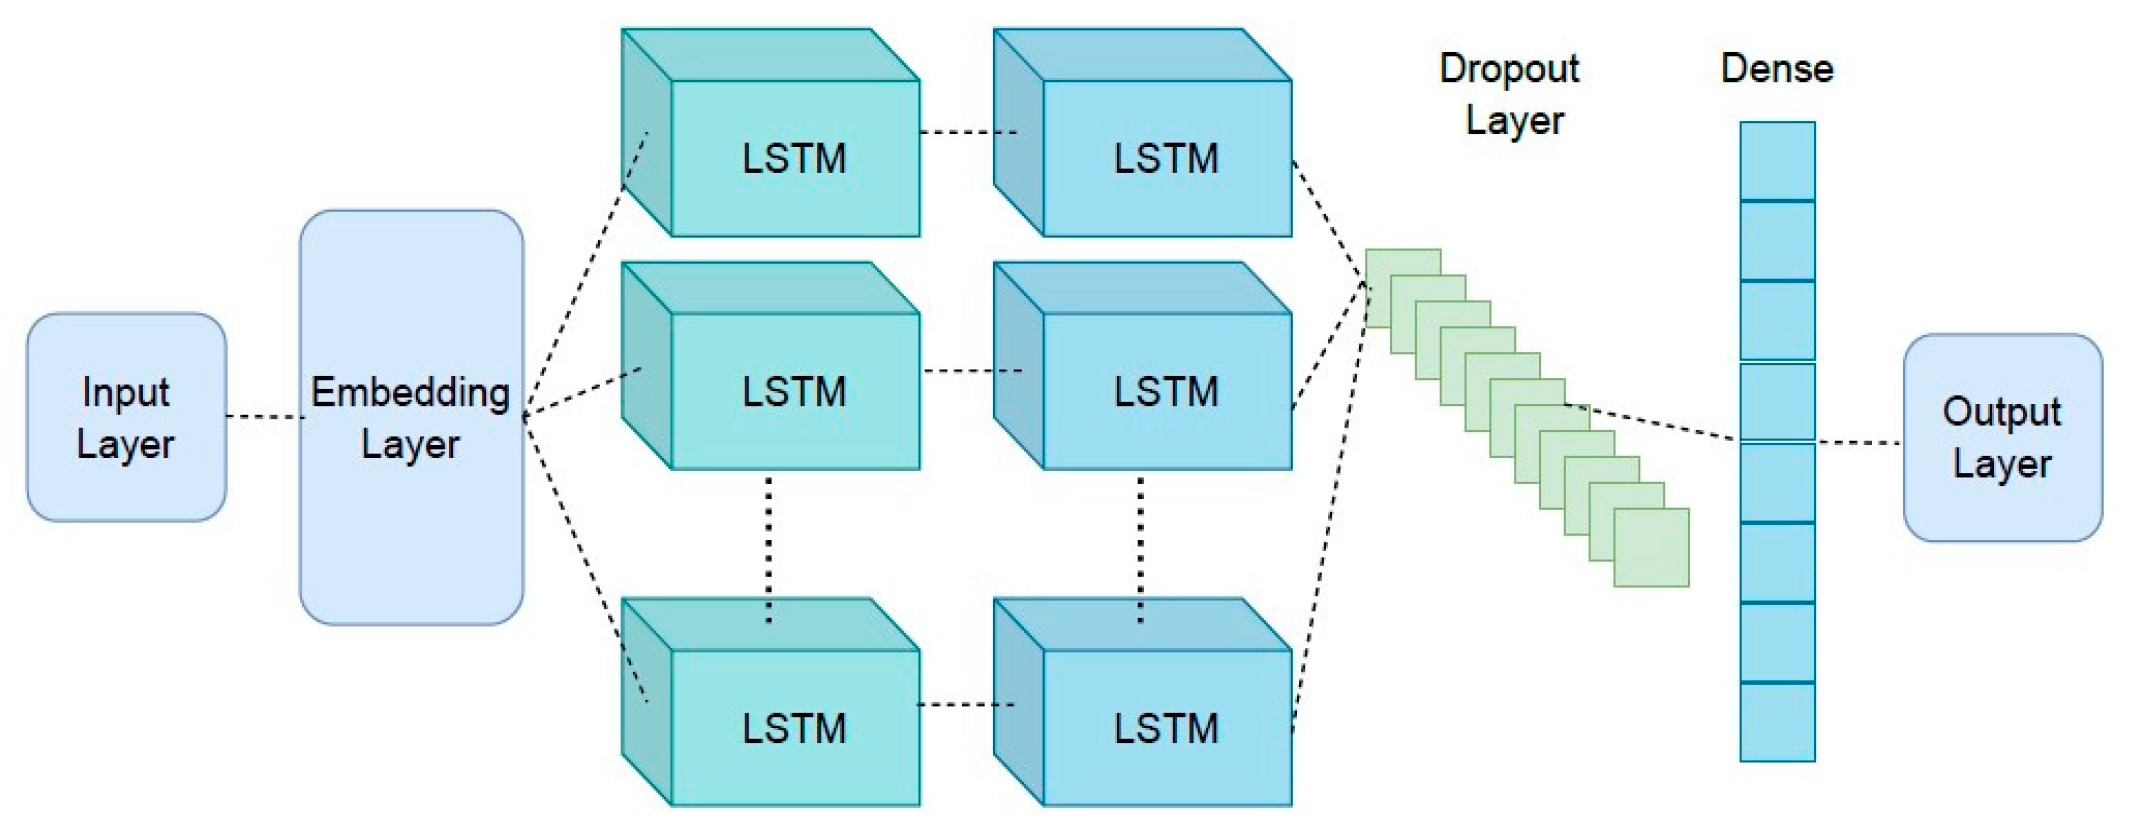
The architecture of the proposed approach is presented in Figure 5, which shows the details of layers considered in the Seq-2-Seq approach. The first layer is an embedding layer, a type of hidden layer that takes high-dimensional input data and projects them into a lower-dimensional space to allow the network to identify the relationships between the inputs better and process the data more efficiently. This layer is connected to the two LSTM layers. A dropout layer is attached to the second LSTM layer to prevent overfitting. For the last layer, a dense layer with a softmax activation function is considered to generate meaningful outputs.
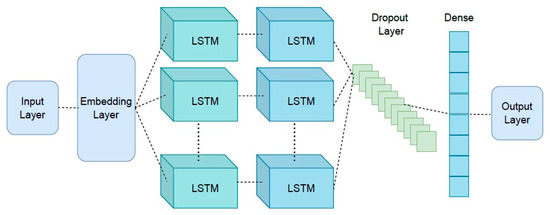
Figure 5.
Proposed Seq-2-Seq model architecture for neural machine translation with LSTM layers.
5. Simulation Results
The configuration and parameters of the proposed architecture are presented in Table 1, which shows several parameters for each layer and the total number of trainable parameters. In each iteration, all the trainable parameters, i.e., 4,468,247, should be trained, and this process will end when a specified number of iterations passes.

Table 1.
Network parameters of proposed Seq-2-Seq architecture for neural machine translation and LSTM network approach.
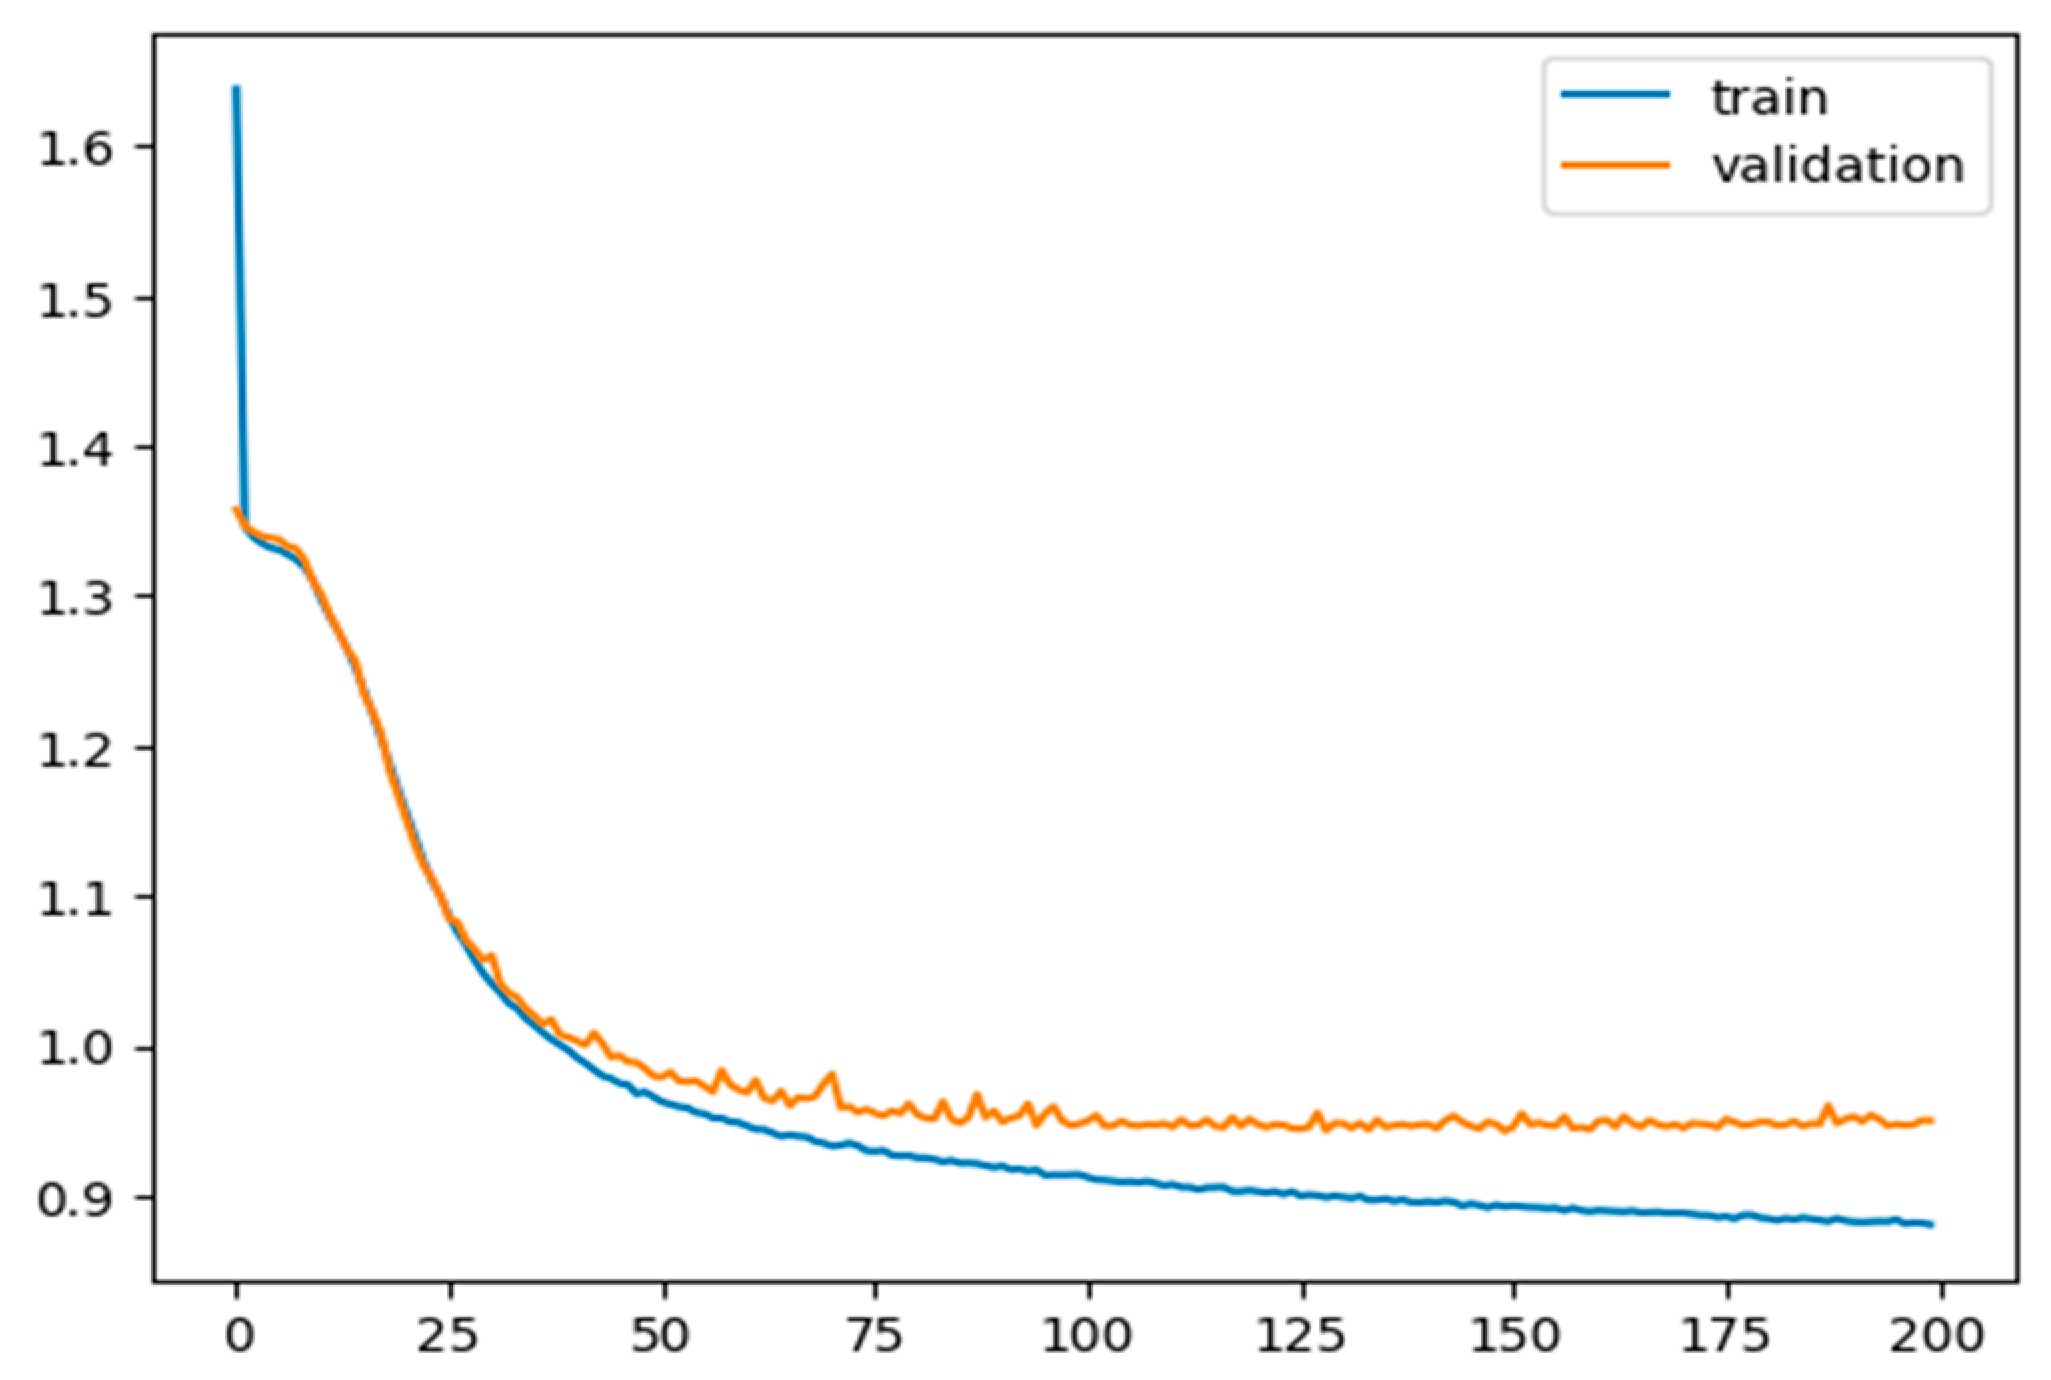
A total of 11,573 tokenized data points (voltage and capacitance cross-over points) with a vocabulary size of 504 are fed into the first layer of the model; 80% of the data are used for training and validation, and 20% are used for testing. For the optimizer, RMS is considered with a sparse categorical cross-entropy function as a loss function to train and validate the model for 200 epochs, using a learning rate of 0.0001. The model is trained for 200 epochs, and loss values during each epoch for training and validation are measured and presented in Figure 6. The model was tested on unseen data, and the accuracy during the test was 71.74%, which is significant if compared to expensive and time-consuming conventional methods, i.e., spectrometry.

Figure 6.
Training and validation loss values per each epoch step. Both curves show the expected saturated behaviour.
Table 2 compares the proposed model output and the actual output. The first column represents the actual output, and the second column represents the predicted output. From the data, the model output is accurate for most of the sequences of AAs, specifically for proteins with two and three AAs. It is evident that for proteins with three amino acids, the model predicts them accurately in a different order. In Figure 7, we compare the output data from ML and the analytical solution for the DYND oligopeptide. Both curves are identical, and the models can reproduce the fingerprints for this protein. However, the ML model can be improved further by considering not only the zero cross-over points but also the magnitude of the peaks and the valleys and the slope of the curves. Indeed, these improvements are currently being implemented in a new version of our ML model.
Table 2.
Comparison of the actual and predicted values for amino acid (AA) content of some examples of protein sequences.
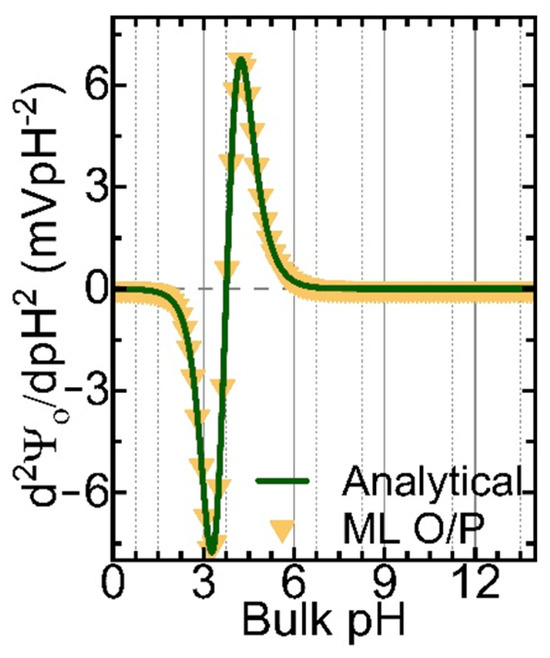
Figure 7.
The 2nd derivative of the surface potential (d2Ψ0/dpH2) for the DYND oligopeptide was calculated analytically (green solid line) and from the Seq-2-Seq LLM model (yellow triangle symbols).
6. Conclusions
In this study, a novel method for peptide sequencing using neural machine translation based on a Seq-2-Seq LLM is proposed. To this end, a Seq-2-Seq architecture based on LSTM neural networks was implemented to translate voltage and capacitance measurements into amino acid combinations. In this study, proteins with 2–4 amino acids were considered. A total of 11,573 tokenized data points (voltage and capacitance cross-over points) with a vocabulary size of 504 were fed into the model; 80% of the data were used for training and validation, and 20% were used for testing. The model was tested on unseen data and the accuracy during the test was 71.74%, which is significant if compared to expensive and time-consuming conventional methods, i.e., spectrometry.
In conclusion, the output results of this study show that the proposed Seq-2-Seq LLM architecture could be used to build a material database for a potentiometric sensor to replace the mass spectrometry method. In future work, consideration of an attention-based LLM would be a good option for improving the accuracy of the translation.
Author Contributions
Conceptualization, S.N. and V.G.; methodology, S.N., V.G. and N.K.; software, S.N. and N.K.; validation, S.N.; formal analysis, S.N. and N.K.; investigation, S.N.; resources, V.G. and N.K.; data curation, N.K.; writing—original draft preparation, S.N.; writing—review and editing, S.N. and V.G.; visualization, S.N. and V.G.; supervision, V.G.; project administration, V.G.; funding acquisition, V.G. All authors have read and agreed to the published version of the manuscript.
Funding
This research received no external funding.
Institutional Review Board Statement
Not applicable.
Informed Consent Statement
Not applicable.
Data Availability Statement
The data presented in this study are available upon request from the corresponding author.
Conflicts of Interest
The authors declare no conflict of interest.
References
- Palacio Lozano, D.C.; Thomas, M.J.; Jones, H.E.; Barrow, M.P. Petroleomics: Tools, Challenges, and Developments. Annu. Rev. Anal. Chem. 2020, 13, 405–430. [Google Scholar] [CrossRef] [PubMed]
- Yang, K.L.; Yu, F.; Teo, G.C.; Li, K.; Demichev, V.; Ralser, M.; Nesvizhskii, A.I. MSBooster: Improving peptide identification rates using deep learning-based features. Nat. Commun. 2023, 14, 4539. [Google Scholar] [CrossRef] [PubMed]
- Yilmaz, M.; Fondrie, W.E.; Bittremieux, W.; Melendez, C.F.; Nelson, R.; Ananth, V.; Oh, S.; Noble, W.S. Sequence-to-sequence translation from mass spectra to peptides with a transformer model. Nat. Commun. 2024, 15, 6427. [Google Scholar] [CrossRef] [PubMed]
- Kumar, N.; Aleksandrov, P.; Gao, Y.; Macdonald, C.; García, C.P.; Georgiev, V. Combinations of Analytical and Machine Learning Methods in a Single Simulation Framework for Amphoteric Molecules Detection. IEEE Sens. Lett. 2024, 8, 1–4. [Google Scholar] [CrossRef]
- Naderian, S. Machine learning approach for non-intrusive load monitoring in smart grids: New deep learning method based on long short-term memory and convolutional neural networks. In Proceedings of the 2022 8th Iranian Conference on Signal Processing and Intelligent Systems (ICSPIS), Behshahr, Iran, 28–29 December 2022. [Google Scholar]
- Petersen, N.C.; Rodrigues, F.; Pereira, F.C. Multi-output bus travel time prediction with convolutional lstm neural network. Expert Syst. Appl. 2019, 120, 426–435. [Google Scholar] [CrossRef]


Disclaimer/Publisher’s Note: The statements, opinions and data contained in all publications are solely those of the individual author(s) and contributor(s) and not of MDPI and/or the editor(s). MDPI and/or the editor(s) disclaim responsibility for any injury to people or property resulting from any ideas, methods, instructions or products referred to in the content. |
© 2024 by the authors. Licensee MDPI, Basel, Switzerland. This article is an open access article distributed under the terms and conditions of the Creative Commons Attribution (CC BY) license (https://creativecommons.org/licenses/by/4.0/).