Abstract
Bridges, like any other infrastructure, deteriorate over time, and the more they degrade, the more expensive it becomes to perform maintenance activities on them. Therefore, it is important to predict their deterioration and plan intervention programs from economic and functionality points of view. While deterministic models are used to predict the deterioration of a structure, they do not consider any maintenance activities carried out beforehand. In this paper, we adjusted the deterioration model to overcome those limitations and planned an intervention program for the bridges of Ontario for 2023–2025. To achieve this, we cleaned the dataset; formulated the models; ran simulations with multiple deterministic and stochastic models to find the best one; adjusted the model equation to account for various levels of previous maintenance works; formulated the intervention action requirement for the next three years by developing an algorithm to reflect previous maintenance trends and their effects on the condition ratings; prepared an equalized work requirement for each year; and prioritized the action requirements based on a proposed risk matrix. Finally, an exhaustive plan with an action requirement for all the bridges was prepared for 2023–2025. The proposed plan will help decision makers to take proper action to maintain the serviceability of the bridges.
1. Introduction
Engineering asset management (AM) can be defined as operating and maintaining a set of physical non-financial assets over their technical lifetime to ensure a proper return for the value for money of those assets and to provide the expected level of service (LOS) for the stakeholders [1]. An AM portfolio includes diverse assets like equipment, vehicles, buildings, roads, and bridges, focusing on planning, maintenance, valuation, and disposal [2].
Bridges are crucial for Canada’s connectivity, with Ontario’s Ministry of Transportation managing about 3000 key bridges out of 51,717 in Canada. Proper maintenance ensures they support the national economy and provide consistent service throughout their lifecycle [3]. However, just like any other civil infrastructure, bridges deteriorate over time due to factors like traffic, weather, chemicals, and wear. Unchecked deterioration leads to costly replacements. Regular maintenance and early damage detection reduce costs and disruptions. Continuous evaluation improves operation and maintenance by assessing conditions, identifying causes, planning rehabilitation, and budgeting effectively [4]. A comprehensive bridge management system (BMS) aids in making maintenance and repair decisions through inspection, performance evaluation, deterioration prediction, cost analysis, and strategy formulation [5]. Ontario’s BMS mandates biennial inspections, ensuring safety and identifying repair needs. Since 2007, Ontario has invested over $7.5 billion in bridge maintenance, increasing annual funding significantly [6,7,8]. The Ontario Structure Inspection Manual (OSIM) inspection process, supported by the Ministry’s BMS, involves entering data to calculate the Bridge Condition Index (BCI), ranging from 0 to 100. The BCI measures overall bridge condition, deterioration severity, and repair needs. It also helps predict future deterioration and allocate maintenance funding [9].
Over the years, many deterioration models have been developed and two important types are (i) deterministic models and (ii) stochastic models [4,10]. Deterministic models use mathematical correlations, often through regression, to predict the condition ratings of structures like bridges. Despite their structured approach, they fail to account for the unpredictable nature of deterioration. Jeong et al. used non-linear regression with the Inspection Reliability Index (IRI) to estimate bridge lifecycles. The model predicted an average service life of 70.8 years, helping to estimate the remaining useful life [11]. Bu et al. developed a backward prediction model (BPM) to recreate historical bridge condition ratings, improving prediction accuracy for performance modeling [12]. Bennetts et al. analyzed Highway England’s bridge data using decision science tools and Python scripts, identifying age, deck type, and structure type as key factors affecting condition scores [13].
Stochastic models use random variables to simulate deterioration, with state-based (e.g., Markov chain) and time-based models predicting condition indicators. Ranjith et al. utilized Markov chain models to predict timber bridge conditions in Victoria, Australia, showing high accuracy [14]. Yosri et al. developed a GA–Markov chain model for bridge deterioration, validating it with repaired and unrepaired bridge data, aiding predictive BMS rules and resource prioritization [4]. Tran et al. combined ordinal regression and Markov models for stormwater pipe functionality predictions [15].
In this paper, our objectives are to: (i) Categorize Ontario’s provincial bridges by BCI and analyze historical maintenance impacts to understand their conditions and functionalities. (ii) Identify the best deterioration model and adjust it to reflect previous maintenance to predict bridge conditions from 2023 to 2025. (iii) Prioritize and plan bridge maintenance from 2023 to 2025 using a risk-based matrix and balanced workload distribution.
2. Methodology
2.1. Data Collection and Preparation
As mentioned before, Ontario’s provincial bridges and culverts are inspected biennially using OSIM, resulting in a Bridge Condition Index (BCI) score from 0 to 100, with data available online at data.ontario.ca [16]. The dataset includes 5053 Ontario bridges and culverts, detailing ID, name, location, category, construction year, repairs, BCI scores, and many other datapoints. The dataset was filtered to include only 2993 bridges.
2.2. Categorizing the Conditions
To obtain an overview about the condition of the whole bridge network, the BCI range of 0–100 is divided into the following five the categories shown in Table 1. The condition categories of bridges in 2023 are shown in Table 2.

Table 1.
Condition category as per BCI.
Table 2.
Condition categories of bridges in 2023.
2.3. Model Formulations
As discussed in the introduction, deterministic and stochastic models are widely used for the purpose of deterioration modeling. In this paper, both of them were used to compare which one fits the best with our dataset.
2.3.1. Deterministic Models
In this paper, the following models were used: linear deterioration model (1), convex deterioration model (2), Concave Deterioration Model (3), convex–concave deterioration pattern (4), concave–convex deterioration pattern (5).
= the condition rating or BCI for the corresponding model to be calculated.
= the maximum condition rating or BCI available. In our case, = 100.
= age of the structure. In this paper, = 2022—the year of construction of the structure.
= the service life of the structure. For highway bridges in Ontario, = 88 years [17].
can be any real number. However, a too high or too low value of will provide an impractical value of .
2.3.2. Stochastic Model
A stochastic process can be regarded as a Markov process when the probability of a future state is dependent only on the current state and not on how it was obtained [18]. The transition probability matrix (P), with the order (n × n) where n is the number of condition states, represents the probability of transitioning from one state to another. The future condition vector (PT) at any time (T) can be determined as follows if the initial condition vector (Po) of the bridge element is known [19]: PT = Po × P, where for the transition matrix used in this paper
2.4. Root Mean Square Error (RMSE) Calculation
The RMSE was calculated using the following formula
where N = the total number of observations = 2993, = the predicted value for the ith observation, and = the observed value for the ith observation.
2.5. Finding Out the Optimum Values of and Selecting the Best Model Based on RMSE
Simulations were run for 2993 bridges using 51 values of β ranging from 1 to 13.5 for the convex–concave model and from 0.6 to 1.1 for concave–convex model—as the independent variable—and RMSE as the dependent variable, and the resulting diagram can be seen in Figure 1a,b. The β value for which the RMSE was lowest was 8.5 for the convex–concave and 0.94 for the concave–convex model.
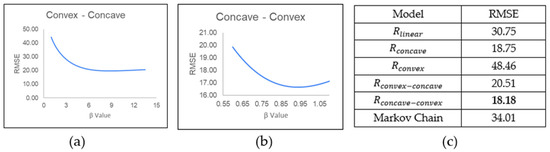
Figure 1.
(a) The simulation of RMSE values for a range of β values for the convex–concave model, (b) the simulation of RMSE values for a range of β values for the concave–convex model, and (c) the RMSE values for the five models.
Later, the RMSE was calculated for one stochastic model and five deterministic models. The values are shown in Figure 1c. was found to have the lowest RMSE. Therefore, it was selected for further analysis.
2.6. Formulation of the Initial Intervention Requirement for 2023
Before starting the formulation of the plan, we need to find out the trend and timeline of previous intervention activities and their effects on the BCI.
2.6.1. Analysis of Previous Repair Works and Their Effect on the BCI
The ministry of transportation has conducted intervention works on many bridges from time to time. From our dataset, we tried to find out the answers to two questions:
Q1: what was the BCI of the bridges when they carried out the maintenance works?
Q2: what was the improvement in BCI after the maintenance works?
For example, the bridge named “Highway 24 underpass at Highway 403” underwent repairs in 2014. Before the repairs, its BCI was 72.3 in 2012. After the repairs in 2014, its BCI increased to 81.2, an 8.9 index score improvement.
2.6.2. Analysis of the Repair Threshold and Improvement in BCI
From our analysis, as shown in Table 3, we found that there were varying degrees of intervention activities depending on the condition level of a bridge, resulting in a varying degree of BCI improvement. The intervention threshold and its effect on BCI was calculated.
Table 3.
Intervention initiation threshold and corresponding improvement in BCI.
Where, a > b > c and ka < kb < kc. It is to be noted that, for threshold BCI values ~a and ~b, incremental average BCI values ka and kb were added to the current BCI values; whereas, for the BCI values of ~c, instead of adding any incremental value, the BCI was upgraded to a value of kc.
After analyzing the dataset for intervention activities and the corresponding improvements in BCI, the information is summarized in Table 4.
Table 4.
Intervention requirement matrix.
2.6.3. Determination of Intervention Needs for 2023
Based on the BCI of the bridges in 2022, the intervention requirements for 2993 bridges (if any) in 2023 were determined as per Table 5.
Table 5.
Action requirement for 2023.
2.7. Major Limitation of the Deterministic Model
Although these models are widely used, they have some limitations such as predicting for a group of infrastructures without considering the current conditions and estimating the condition for only the “no maintenance” state [5].
In our case, although we are planning intervention activities for 2023, while calculating the BCI for 2024 and 2025, the existing deterministic model does not take into account the improvement in BCI for 2023. Therefore, to overcome the two limitations stated above, we adjusted the formula for the deterioration model to reflect the most current state of intervention.
2.8. The Adjusted Formula for the Deterministic Model to Overcome the Limitations
The concave–convex deterioration model equation can be written to reflect the condition before the intervention works:
where
= the BCI before any maintenance works.
= the maximum condition rating or BCI available for the main structure. In our case, = 100.
= the age of the structure. In this paper, = 2022—the year of construction of the structure.
= the service life of the structure. For highway bridges in Ontario, = 88 years [17].
= the optimum value found from Section 2.5.
After the repair or major repair works are completed in year n, the BCI increases by k in the year n + 1, where
After rehabilitation works are completed in year n, the BCI increases to k in the year n + 1 where
To reflect the BCI increment after the maintenance works, the model equation can be adjusted to
where:
= the BCI calculated after any intervention works.
= the maximum condition rating or BCI available for the increment.
= the age of the structure. In this paper, = plan year—the year of intervention works.
Combining Equations (6) and (7) we obtain the adjusted formula.
The adjusted rating for nth year is
Subject to
2.9. Intervention Action Requirement for 2023–2025
Using Equation (8), the BCI values for 2993 bridges were calculated for 2024 and 2025. Later, the action requirement was created based on the intervention requirement matrix.
The conditions of the 2993 bridges for 2023, 2024, and 2025 are shown in Table 6.
Table 6.
Conditions of bridges in 2023–2025.
Based on the calculated BCI values, the action requirements for 2023, 2024, and 2025 are shown in Table 7.
Table 7.
Action requirements for 2023–2025.
As per this action plan, shown in Table 7, a significant number of bridges went through rehabilitation and major repairs. As a result, most of the bridges in 2024 and 2025 were in excellent or in good condition, no longer needing any repairs. However, it is not economically feasible to rehabilitate all the bridges in a single year. That is why risk-based prioritization was performed to allocate the rehabilitating and major repair activities among 2023, 2024, and 2025.
2.10. Risk-Based Prioritization
The risk scale for any element is measured based on two components: the condition scale and the consequence scale. The condition scale for 2023 was calculated based on the current BCI and is shown in Table 8. The consequence scale, shown in Table 9, was calculated based on the area of the bridge. The reasoning is that the larger the area, the higher the repair cost. Therefore, the larger the area, the earlier it needs to be repaired to avoid any additional cost due to further deterioration.
Table 8.
Condition scale index.
Table 9.
Consequence scale.
After combining the condition scale and consequence scale, the risk matrix is shown in Table 10:
Table 10.
Risk Matrix.
Based on the matrices and scales developed in this section, the risk matrix for the bridges for three years was measured and is shown in Table 11.
Table 11.
Risk level of bridges.
2.11. Generating an Equalized Work Volume for Three Years
Since bridges vary greatly by length and width, any plan based on “number of bridges” can be misleading as it does not enumerate the “volume of work”. Therefore, “number of bridges” was converted to “bridge deck area (m2)”. After combining all the activities from Section 2.1, Section 2.2, Section 2.3, Section 2.4, Section 2.5, Section 2.6, Section 2.7, Section 2.8, Section 2.9, Section 2.10, an equalized maintenance area plan was created where each year was allocated an equal area for each maintenance category based on the risk level.
2.12. Final Plan for 2023–2025
Finally, a holistic plan for the management of 2993 bridges was created for 2023–2025. Subject to the constraints of maintenance area per year discussed before, action plan for all the 2993 bridges was created by scheduling the number of bridges equivalent to the total maintenance area quota for each category and each year.
3. Result
3.1. Action Requirement Based on Risk–Based Prioritization
After combining the condition-based actions and the risk-based prioritization, an action requirement for 2023–2025 is shown in Table 12.
Table 12.
Relationship of Risk Level and Condition-Based Actions in Number of Bridges and in Bridge Area.
However, as the lengths and widths of bridges vary, it is more appropriate to translate the number of bridges into bridge area (m2) to arrive at the whole picture for the volume of activity.
3.2. Generating an Equalized Maintenance Work Volume for Three Years
As shown in Table 12, maintenance actions are required for large bridge areas in 2023, which is not economically feasible. On the other hand, much less activity is found for 2024 and 2025. To make the maintenance process more feasible, the maintenance requirement is equally divided among the three years following risk-based prioritization. For example, the total rehabilitation requirement for 2023 is 1,034,490 m2. If this activity is divided among the three years, each year will be allocated 344,830 m2. For 2023 there is a very high-risk area of 57,987 m2 and a high-risk area of 195,356 m2—in total, 253,343 m2. To make up the allocation of 344,830 m2, a 91,487 m2 area is taken from the medium risk category and the rest of the area is equally divided and allotted to 2024 and 2025. A similar strategy was followed for other risk levels and condition-based actions. The yearly area-based plan for actions is shown in Table 13:
Table 13.
Final (Area-Based) Maintenance Plan.
In the above table, we can observe that each year has the same maintenance area (511,933 m2) to be taken care of. Moreover, each maintenance category for each year has been allocated an equal area. For example, the total rehabilitation work for each of 2023, 2024, and 2025 is 344,830 m2.
3.3. Final Plan
Subject to the equalized area maintenance plan generated above for each year, the action plan for all the 2993 bridges was created depending on their risk levels. Table 14 is an excerpt of that final plan. Bridges with a higher risk index were scheduled to be repaired in 2023, the rest were scheduled for 2024 and 2025, based on a descending order of risk level while meeting the year quota for each type of intervention activity. The whole plan is provided in the supplementary document.
Table 14.
Final Maintenance Plan (by Number of Bridges).
4. Conclusions and Discussion
In our paper, we analyzed the present conditions of the 2993 bridges of Ontario and created an action plan for 2023–2025. To find out the deterioration rate, five models were tested and the concave–convex model was found to have the lowest RMSE. Next, we analyzed the maintenance trend and found four possible interventions based on the current BCI: if the BCI ≥ 70, no action is required; if it is 65 ≤ BCI < 70, repairs are required that will result in a 7.77 point increase in BCI; if 60 ≤ BCI < 65, major repairs are required, resulting in a 25 point increase in BCI; if the BCI < 60, rehabilitation is suggested, leading to the restoration of the BCI value to 100. After calculating the BCI of the bridges for 2023 using the concave–convex model and applying the above algorithm, the intervention requirement for 2023 was generated. It was found that around 35% of the bridges need rehabilitating in 2023. Since one of the main limitations of the deterministic model is that it does not take into account the previous maintenance work, the model equation was adjusted based on four BCI conditions to reflect any earlier repair activities. Later, condition ratings and corresponding repair requirements for 2024 and 2025 were calculated using the adjusted equation. As the 2023 requirement showed that too many bridges need interventions, which is not financially feasible, a risk-based approach was taken to select which bridges are to be prioritized. However, “number of bridges” was converted to “bridge deck area (m2)” to reflect the actual volume of intervention work. Then, a risk matrix was created where both condition and consequence scales comprised five classes. The consequence scale was based on the area of the bridge, assuming that the larger the area, the higher the delayed intervention cost will be. Similarly, the failure of a larger area bridge will have a greater economic, social, and environmental impact. Based on the risk matrix, an equal maintenance work area for each category of action for each year was created. Subject to that equalized work area, bridges with higher risk index were scheduled to be repaired in 2023, and the rest were scheduled for 2024 and 2025 based on a descending order of risk level. Finally, a balanced intervention plan for 2023–2025 was created for each of the 2993 bridges.
Author Contributions
C.S.-U.-Z.: investigation, methodology, literature review, and writing; M.A.K.: simulation and writing; G.K.: supervision. All authors have read and agreed to the published version of the manuscript.
Funding
This research received no external funding.
Institutional Review Board Statement
Not applicable.
Informed Consent Statement
Not applicable.
Data Availability Statement
Data will be available upon request.
Conflicts of Interest
The authors declare that they have no conflicts of interest.
References
- Schneider, J.; Gaul, A.J.; Neumann, C.; Hogräfer, J.; Wellßow, W.; Schwan, M.; Schnettler, A. Asset Management Techniques. Electr. Power Energy Syst. 2006, 28, 643–654. [Google Scholar] [CrossRef]
- Amadi-Echendu, J.E.; Willett, R.; Brown, K.; Hope, T.; Lee, J.; Mathew, J.; Vya, N.; Yang, B.-S. What Is Engineering Asset Management? In Definitions, Concepts and Scope of Engineering Asset Management; Amadi-Echendu, J.E., Brown, K., Willett, R., Mathew, J., International Society of Engineering Asset Management, World Congress on Engineering Asset Management, Eds.; Engineering Asset Management Review; Springer: Berlin/Heidelberg, Germany, 2010; Volume 1, pp. 3–16. ISBN 1282972863. [Google Scholar]
- Statistics Canada Canada’s Core Public Infrastructure Survey: Roads, Bridges and Tunnels. 2018. Available online: https://www150.statcan.gc.ca/n1/daily-quotidien/201026/dq201026a-eng.htm (accessed on 16 December 2022).
- Yosri, A.; Elleathy, Y.; Hassini, S.; El-Dakhakhni, W. Genetic Algorithm-Markovian Model for Predictive Bridge Asset Management. J. Bridge Eng. 2021, 26, 8. [Google Scholar] [CrossRef]
- Morcous, G.; Rivard, H.; Hanna, A.M. Modeling Bridge Deterioration Using Case-Based Reasoning. J. Infrastruct. Syst. 2002, 8, 86–95. [Google Scholar] [CrossRef]
- Ministry of Transportation. Ontario Structure Inspection Manual (OSIM) 2008; Ministry of Transportation: St. Catharines, ON, USA, 2008.
- Public Transportation and Highway Improvement Act, R.S.O. 1990; c. P.50. Available online: https://www.ontario.ca/laws/statute/90p50 (accessed on 16 December 2022).
- Office of the Auditor General of Ontario. Value for Money Audit: Inspection and Maintenance of the Province’s Bridges and Culverts; Office of the Auditor General of Ontario: Toronto, ON, Canada, 2021.
- Taghaddos, M.; Mohamed, Y. Predicting Bridge Conditions in Ontario: A Case Study. In Proceedings of the 36th International Symposium on Automation and Robotics in Construction, Banff, AB, Canada, 21–24 May 2019. [Google Scholar]
- Wang, R.; Ma, L.; Yan, C.; Mathew, J. Condition Deterioration Prediction of Bridge Elements Using Dynamic Bayesian Networks (DBNs). In Proceedings of the 2012 International Conference on Quality, Reliability, Risk, Maintenance, and Safety Engineering, Chengdu, China, 15–18 June 2012; IEEE: Piscataway, NJ, USA, 2012; pp. 566–571. [Google Scholar]
- Jeong, Y.; Kim, W.; Lee, I.; Lee, J. Bridge Service Life Estimation Considering Inspection Reliability. KSCE J. Civ. Eng. 2017, 21, 1882–1893. [Google Scholar] [CrossRef]
- Bu, G.P.; Son, J.B.; Lee, J.H.; Guan, H.; Blumenstein, M.; Loo, Y.C. Typical Deterministic and Stochastic Bridge Deterioration Modelling Incorporating Backward Prediction Model. J. Civ. Struct. Health Monit. 2013, 3, 141–152. [Google Scholar] [CrossRef][Green Version]
- Bennetts, J.; Webb, G.T.; Vardanega, P.J.; Denton, S.R.; Loudon, N. Using Data to Explore Trends in Bridge Performance. Proc. Inst. Civ. Eng. Smart Infrastruct. Constr. 2018, 171, 14–28. [Google Scholar] [CrossRef]
- Ranjith, S.; Setunge, S.; Gravina, R.; Venkatesan, S. Deterioration Prediction of Timber Bridge Elements Using the Markov Chain. J. Perform. Constr. Facil. 2013, 27, 319–325. [Google Scholar] [CrossRef]
- Tran, D.H.; Ng, A.W.M.; McManus, K.J.; Burn, S. Prediction Models for Serviceability Deterioration of Stormwater Pipes. Struct. Infrastruct. Eng. 2008, 4, 287–295. [Google Scholar] [CrossRef]
- Bridge Conditions. Available online: https://data.ontario.ca/en/dataset/bridge-conditions (accessed on 17 December 2022).
- Government of Canada Statistics Table 34-10-0169-01 Average Expected Useful Life of New Publicly Owned Bridge and Tunnel Assets, Infrastructure Canada. Available online: https://www150.statcan.gc.ca/t1/tbl1/en/tv.action?pid=3410016901 (accessed on 17 December 2022).
- Parzen, E. On Estimation of a Probability Density Function and Mode. Ann. Math. Stat. 1962, 33, 1065–1076. [Google Scholar] [CrossRef]
- Morcous, G.; Lounis, Z.; Mirza, M.S. Life-Cycle Assessment of Highway Bridges. In Proceedings of the 2002 Taiwan-Canada Workshop on Bridges, Taipei, Taiwan, 8 April 2002; pp. 61–82. [Google Scholar]

Disclaimer/Publisher’s Note: The statements, opinions and data contained in all publications are solely those of the individual author(s) and contributor(s) and not of MDPI and/or the editor(s). MDPI and/or the editor(s) disclaim responsibility for any injury to people or property resulting from any ideas, methods, instructions or products referred to in the content. |
© 2024 by the authors. Licensee MDPI, Basel, Switzerland. This article is an open access article distributed under the terms and conditions of the Creative Commons Attribution (CC BY) license (https://creativecommons.org/licenses/by/4.0/).