Abstract
This study combines additive manufacturing, discrete event simulation, and central composite design to address the challenges of enhancing throughput and tackling bottlenecks in prosthodontic services Particularly in ambulatory surgical units (ASUs). By performing systematic experiments and optimizing parameters, we aimed to smoothen workflow and improve bottlenecks. The findings reveal a noticeable increase in throughput, with the optimized model exhibiting a throughput of 2.35833 compared to 0.975 for the base model and 1.03333 for the alternative model. A balanced workload for servers was observed, with utilization rates ranging from 31.1407% to 88.4426%. Our approach significantly improves system performance by increasing the throughput of the system and addresses critical issues of workload distribution in prosthodontic service delivery.
1. Introduction
Improving the throughput of prosthodontic services particularly those that focus on ambulatory surgical units (ASUs) outpatient care, emergency patients, and elective procedures, using technologies like additive manufacturing is essential for enhancing patient care and optimizing resource utilization. To tackle this, it is crucial to explore key methodologies such as discrete event simulation (DES), simulation-based optimization, and design of experiments (DOE) in the context of dental healthcare. DES, as examined by [1,2], has proven instrumental in identifying and resolving resource allocation issues in hospital settings, and its application in dental services, as demonstrated in [3], aids in comprehending patient flow dynamics. Simulation-based optimization, as represented in [4], offers a robust approach to addressing complex problems, as evidenced by its successful implementation in healthcare decision-making and noted in [5]. The DOE used in [6,7], enables the systematic examination of multiple factors influencing service speed in prosthodontics. Combining DOE with DES, as proposed in [8], enhances our understanding of system dynamics and strengthens optimization efforts. In addition, sustainability considerations, emphasized in [9,10], are essential to the optimization process, ensuring eco-friendly and cost-effective practices. This sets the groundwork for exploring how additive manufacturing, DES, DOE, and simulation-based optimization can collectively improve the speed and quality of prosthodontic services while prioritizing sustainability.
Our paper’s novelty lies in introducing additive manufacturing and replacing traditional methods. Next, we applied DOE using a central composite design approach to optimize the flow with this new technology there by ensuring enhanced throughput and reduced bottlenecks for patients in dental clinics.
2. Methodology
The main goal of this study was to improve the workflow and increase throughput in prosthodontic services using additive manufacturing, discrete event simulation (DES), and central composite design (CCD).
2.1. Nomenclature
Table 1 shows the Nomenclature and distribution for the input data

Table 1.
Nomenclature and Distribution.
2.2. Work Design
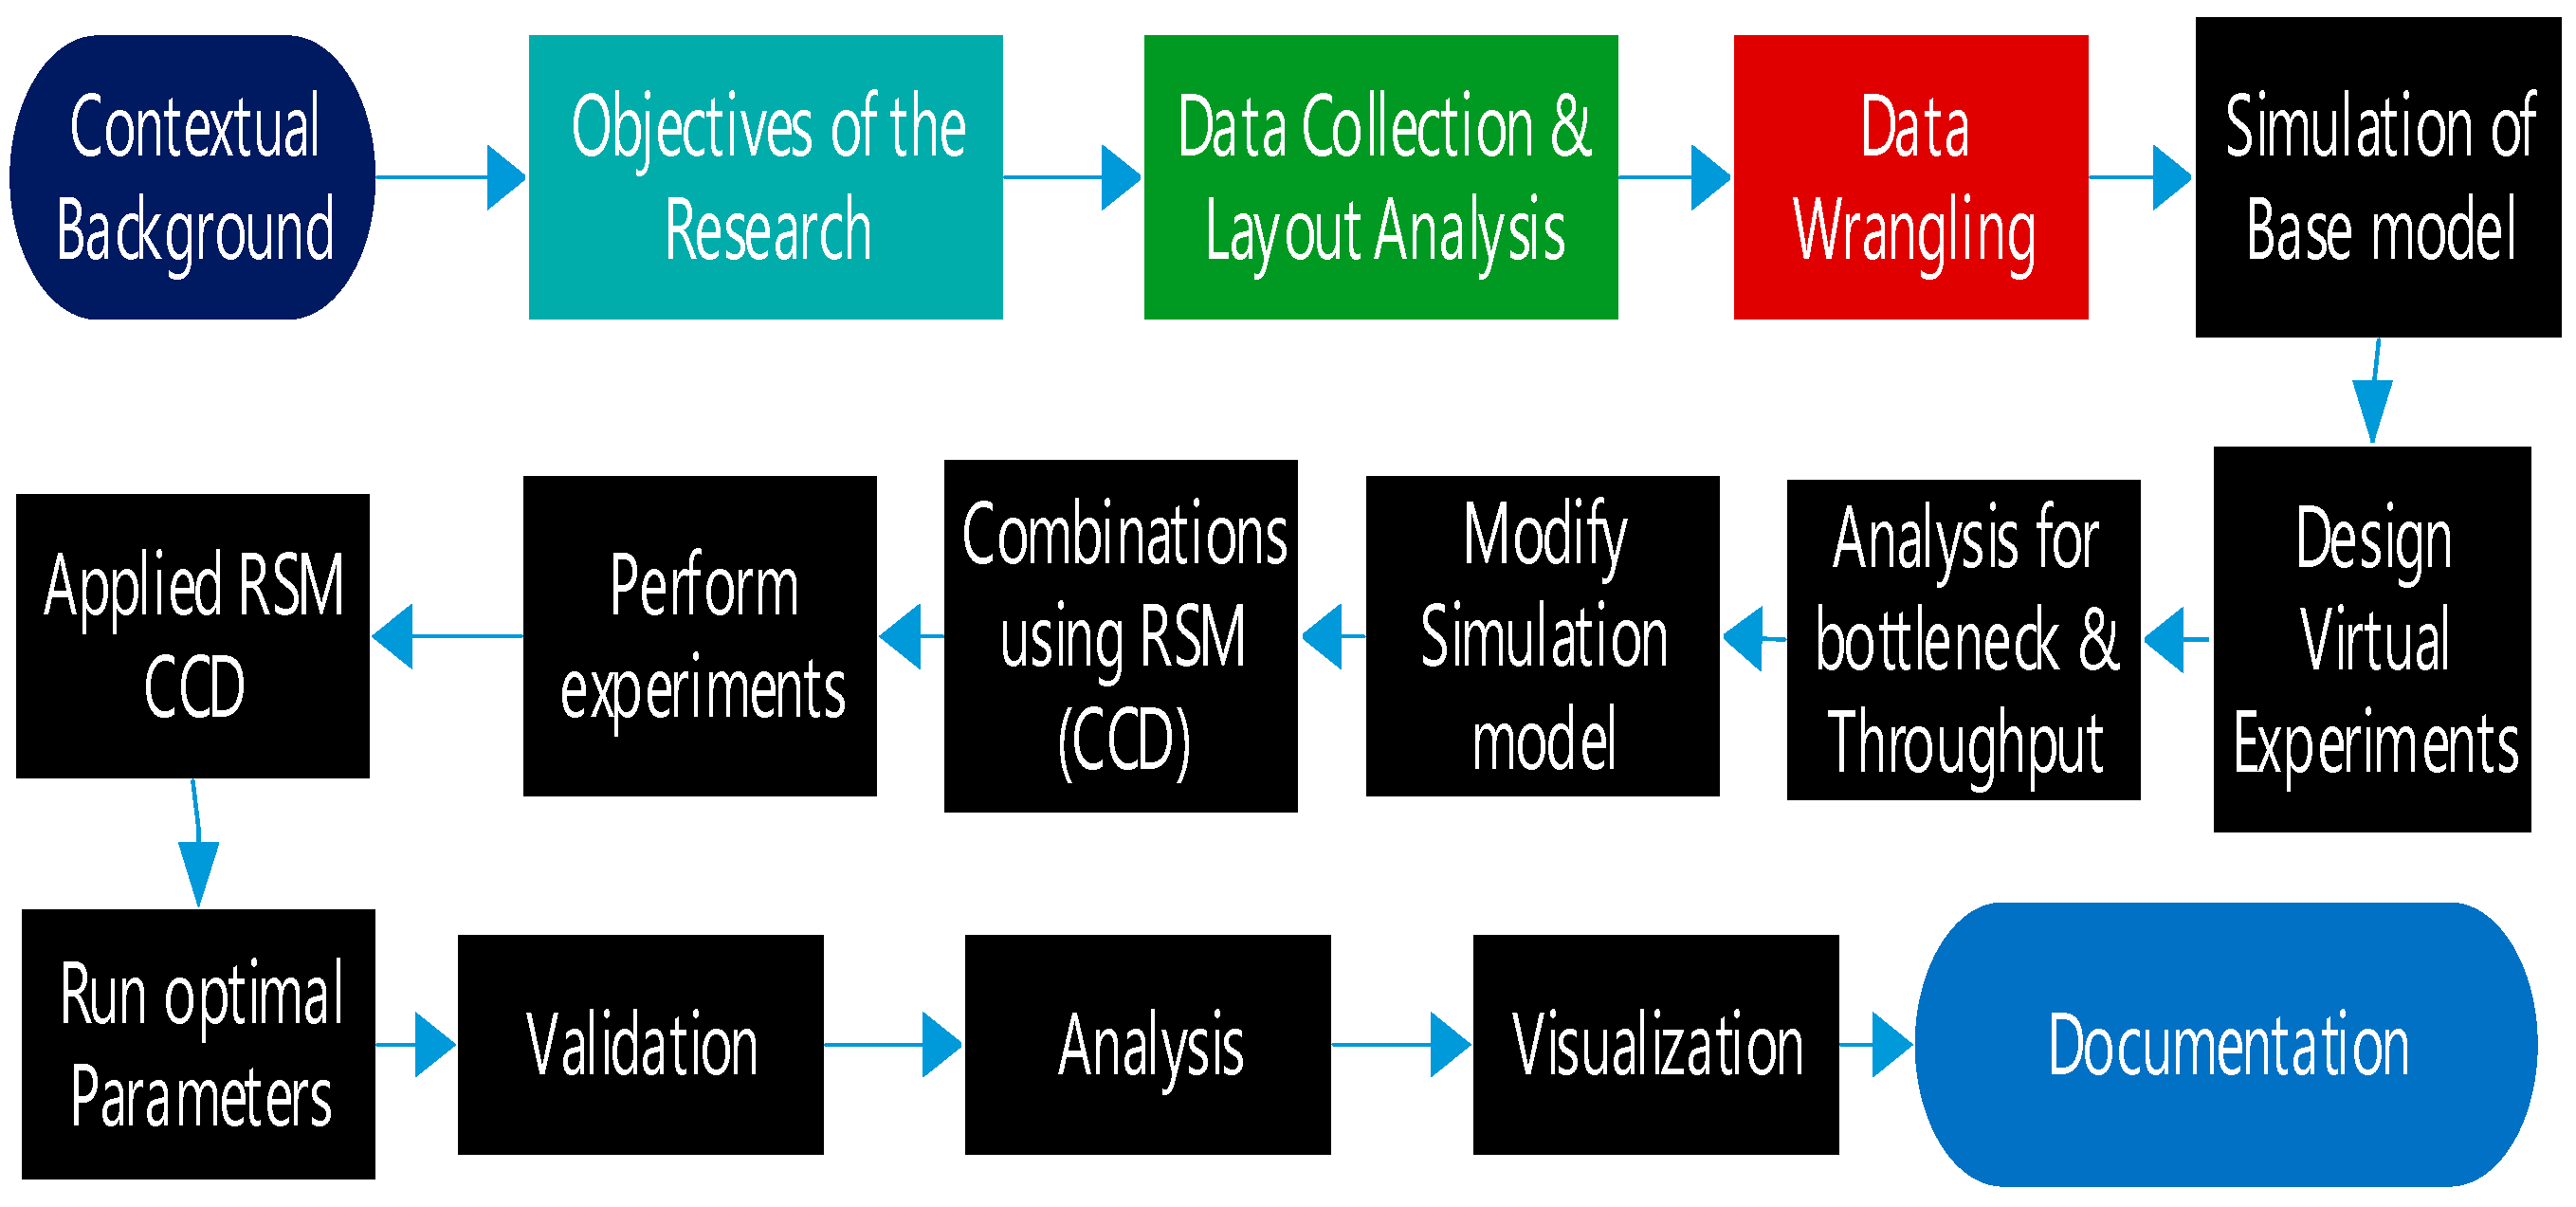
Our work design in Figure 1 began with an assessment of the current state of prosthodontic services followed by setting clear goals to make the workflow more efficient and increase throughput. To understand the system’s operation, we gathered and analyzed data over 2 weeks by physically visiting the site. We determined the distributions of each input using expert Fit after the data wrangling process and then used these distributions as input for various parameters based on the intrinsic syntax of simio. We used these data to build a base model with DES to understand the current system’s performance. Next, we examined the simulation to identify bottlenecks and measure throughput, helping us design virtual experiments to test different scenarios. For improvement purposes, we introduced additive manufacturing into the system to smoothen workflow and throughput. We used RSM and, composite design to find the best settings for our new process. We then performed experiments with these setting. After determining the best parameters, we implemented them in the prosthodontic system and checked to see if the performance improved by comparing before and after data. We analyzed the results to understand the impact on bottlenecks and throughput and created visual aids to share our findings.

Figure 1.
Work Design.
2.3. Base Model
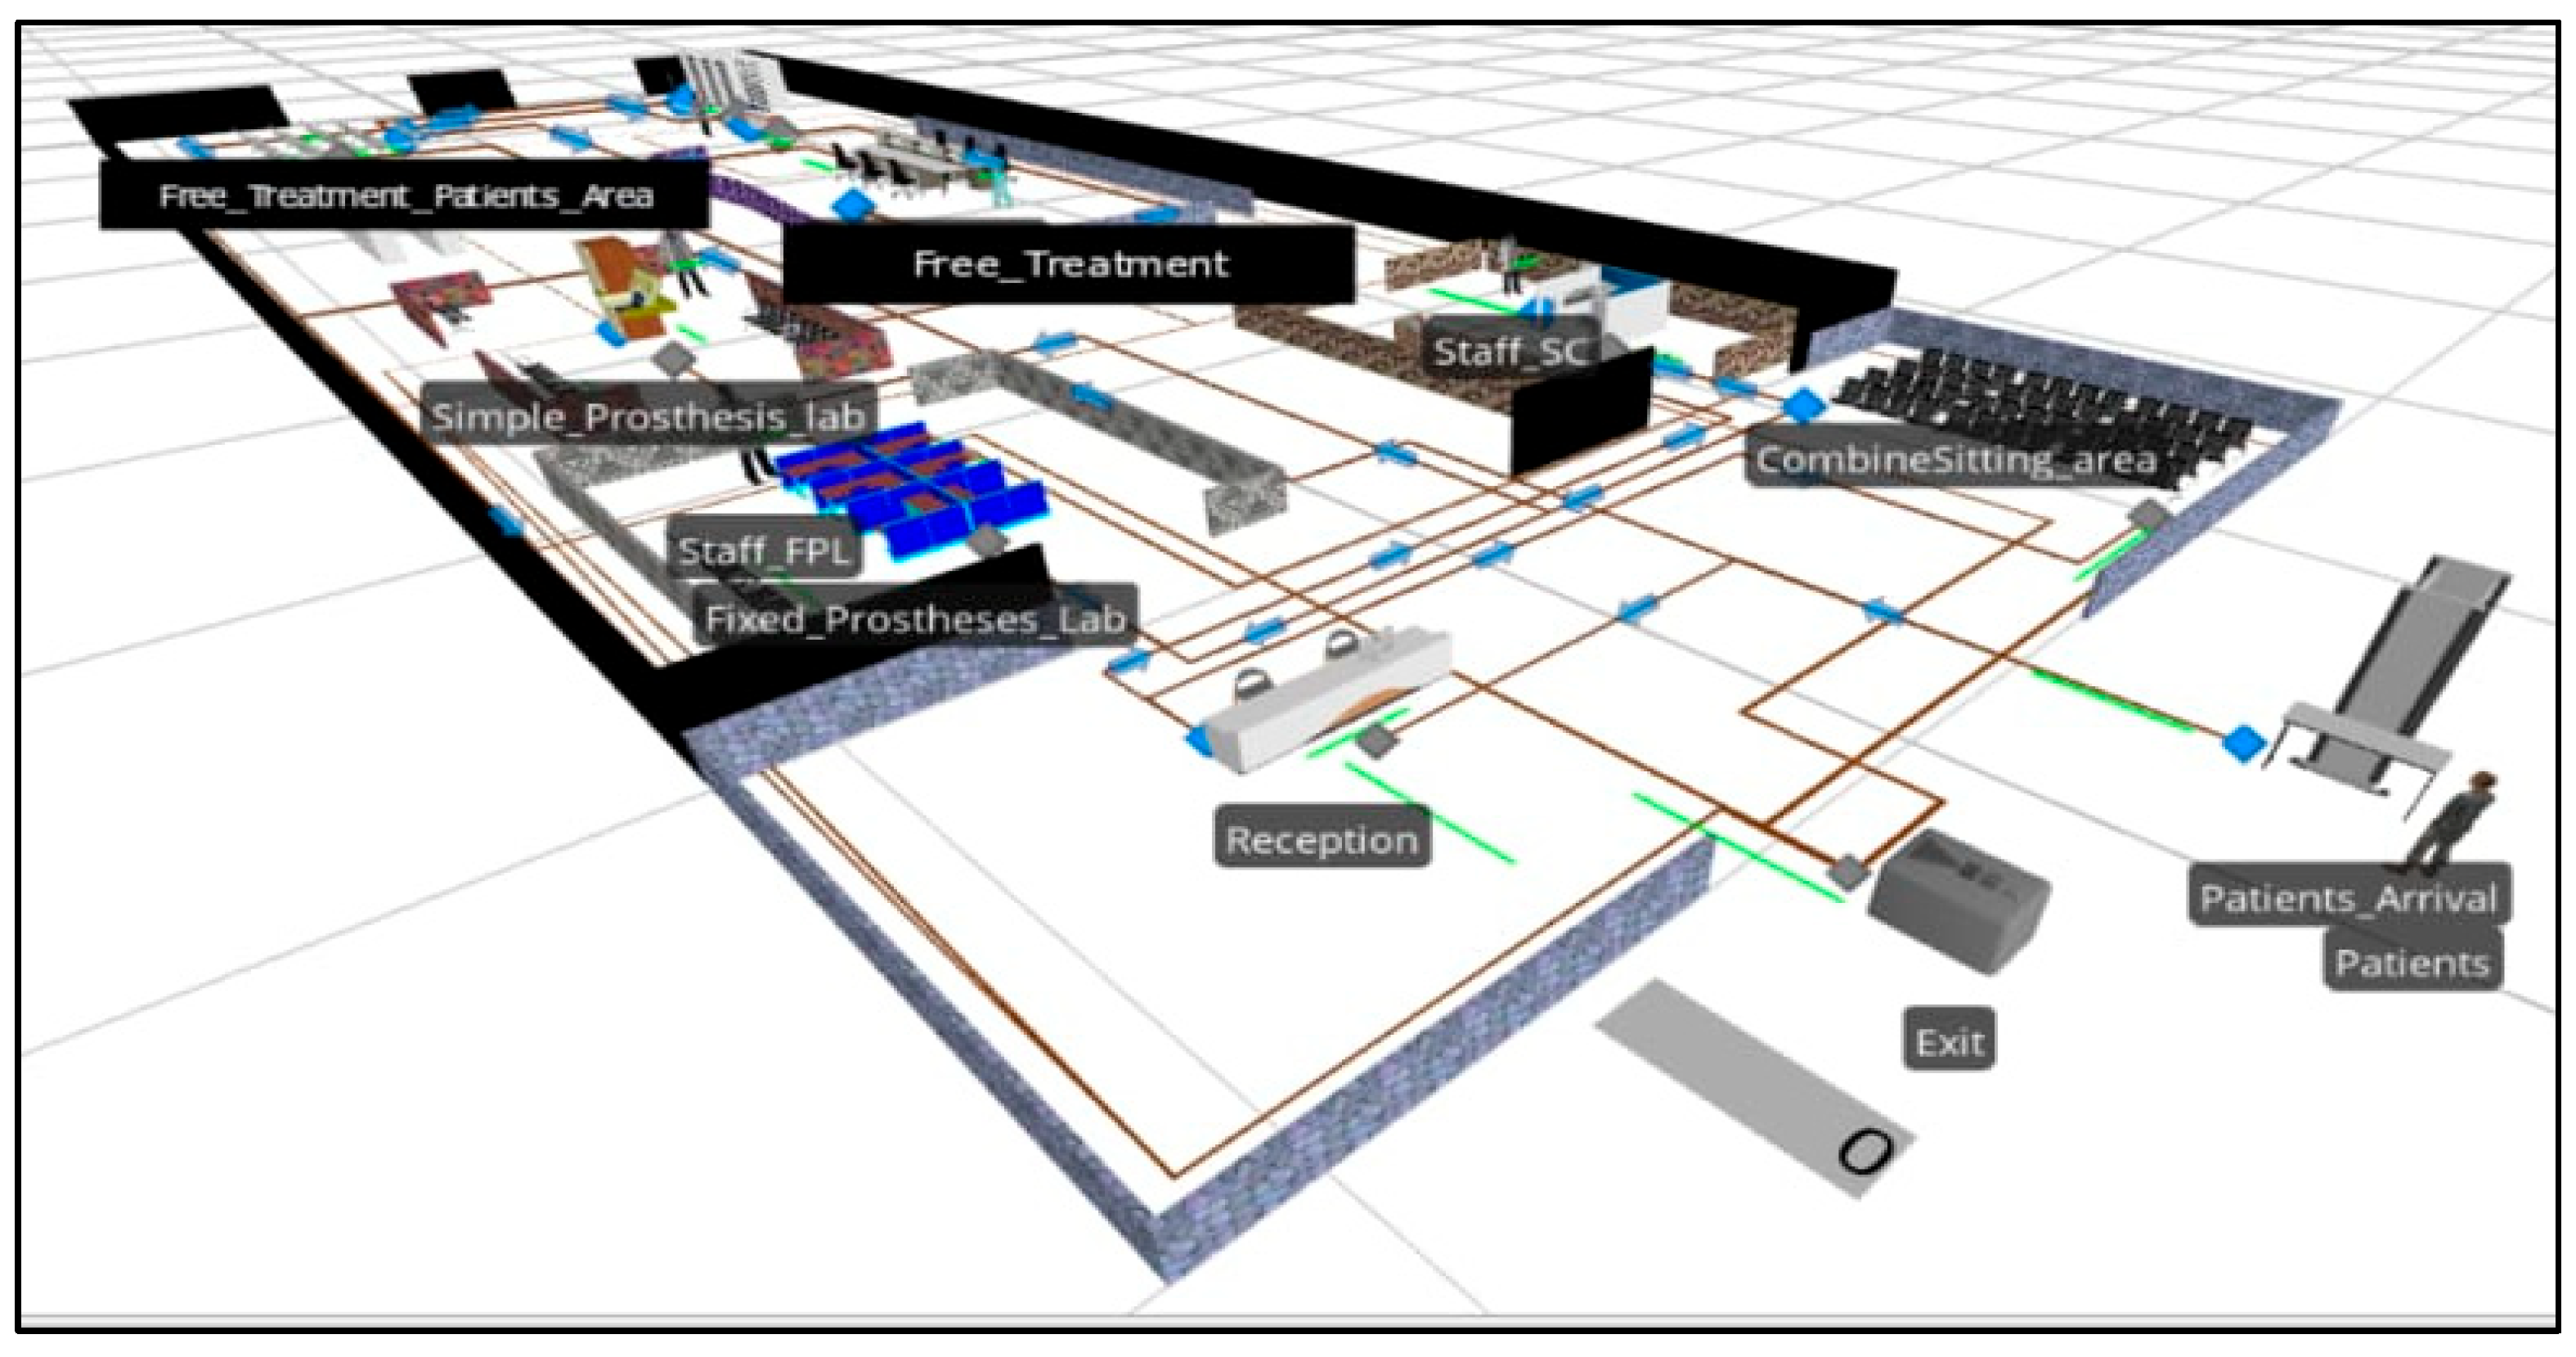
Figure 2 outlines the framework of a prosthodontic services clinic, showing the dynamic interplay between patients and staff as they flow through the facility. Patients enter the system at the entry point and progress sequentially through various service points, labelled Server 1 to 6. Each service point performs tasks manually with different capacities and parameters, and is attended to by dedicated staff members labelled Staff 1 to 6. Before proceeding, patients are provided access to sitting areas and combined sitting areas for their convenience. Washrooms are accessible as needed. The flow paths, depicted using directional arrows, shows the chronological order of their interactions within the clinic. This model serves as a representation of the clinic’s workflow and interactions, and provides the it groundwork for identifying bottlenecks and optimizing throughput.
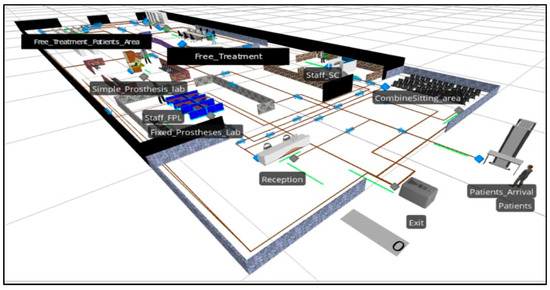
Figure 2.
Base Model.
2.3.1. Model Assumptions
- The time required for each service at Servers A to F is constant or follows a known distribution.
- Staff members are always available at their respective servers and are not interrupted by other tasks.
- Patients are processed on a first-come, first-served basis without prioritization.
- All servers and staff are fully utilized during operating hours, and there is no downtime due to equipment failure or staff breaks.
- Interaction times between staff and patients, as well as between staff members, are negligible and do not affect overall service time.
- Washroom usage doesn’t significantly impact the flow and timing.
2.3.2. Base Model Stats
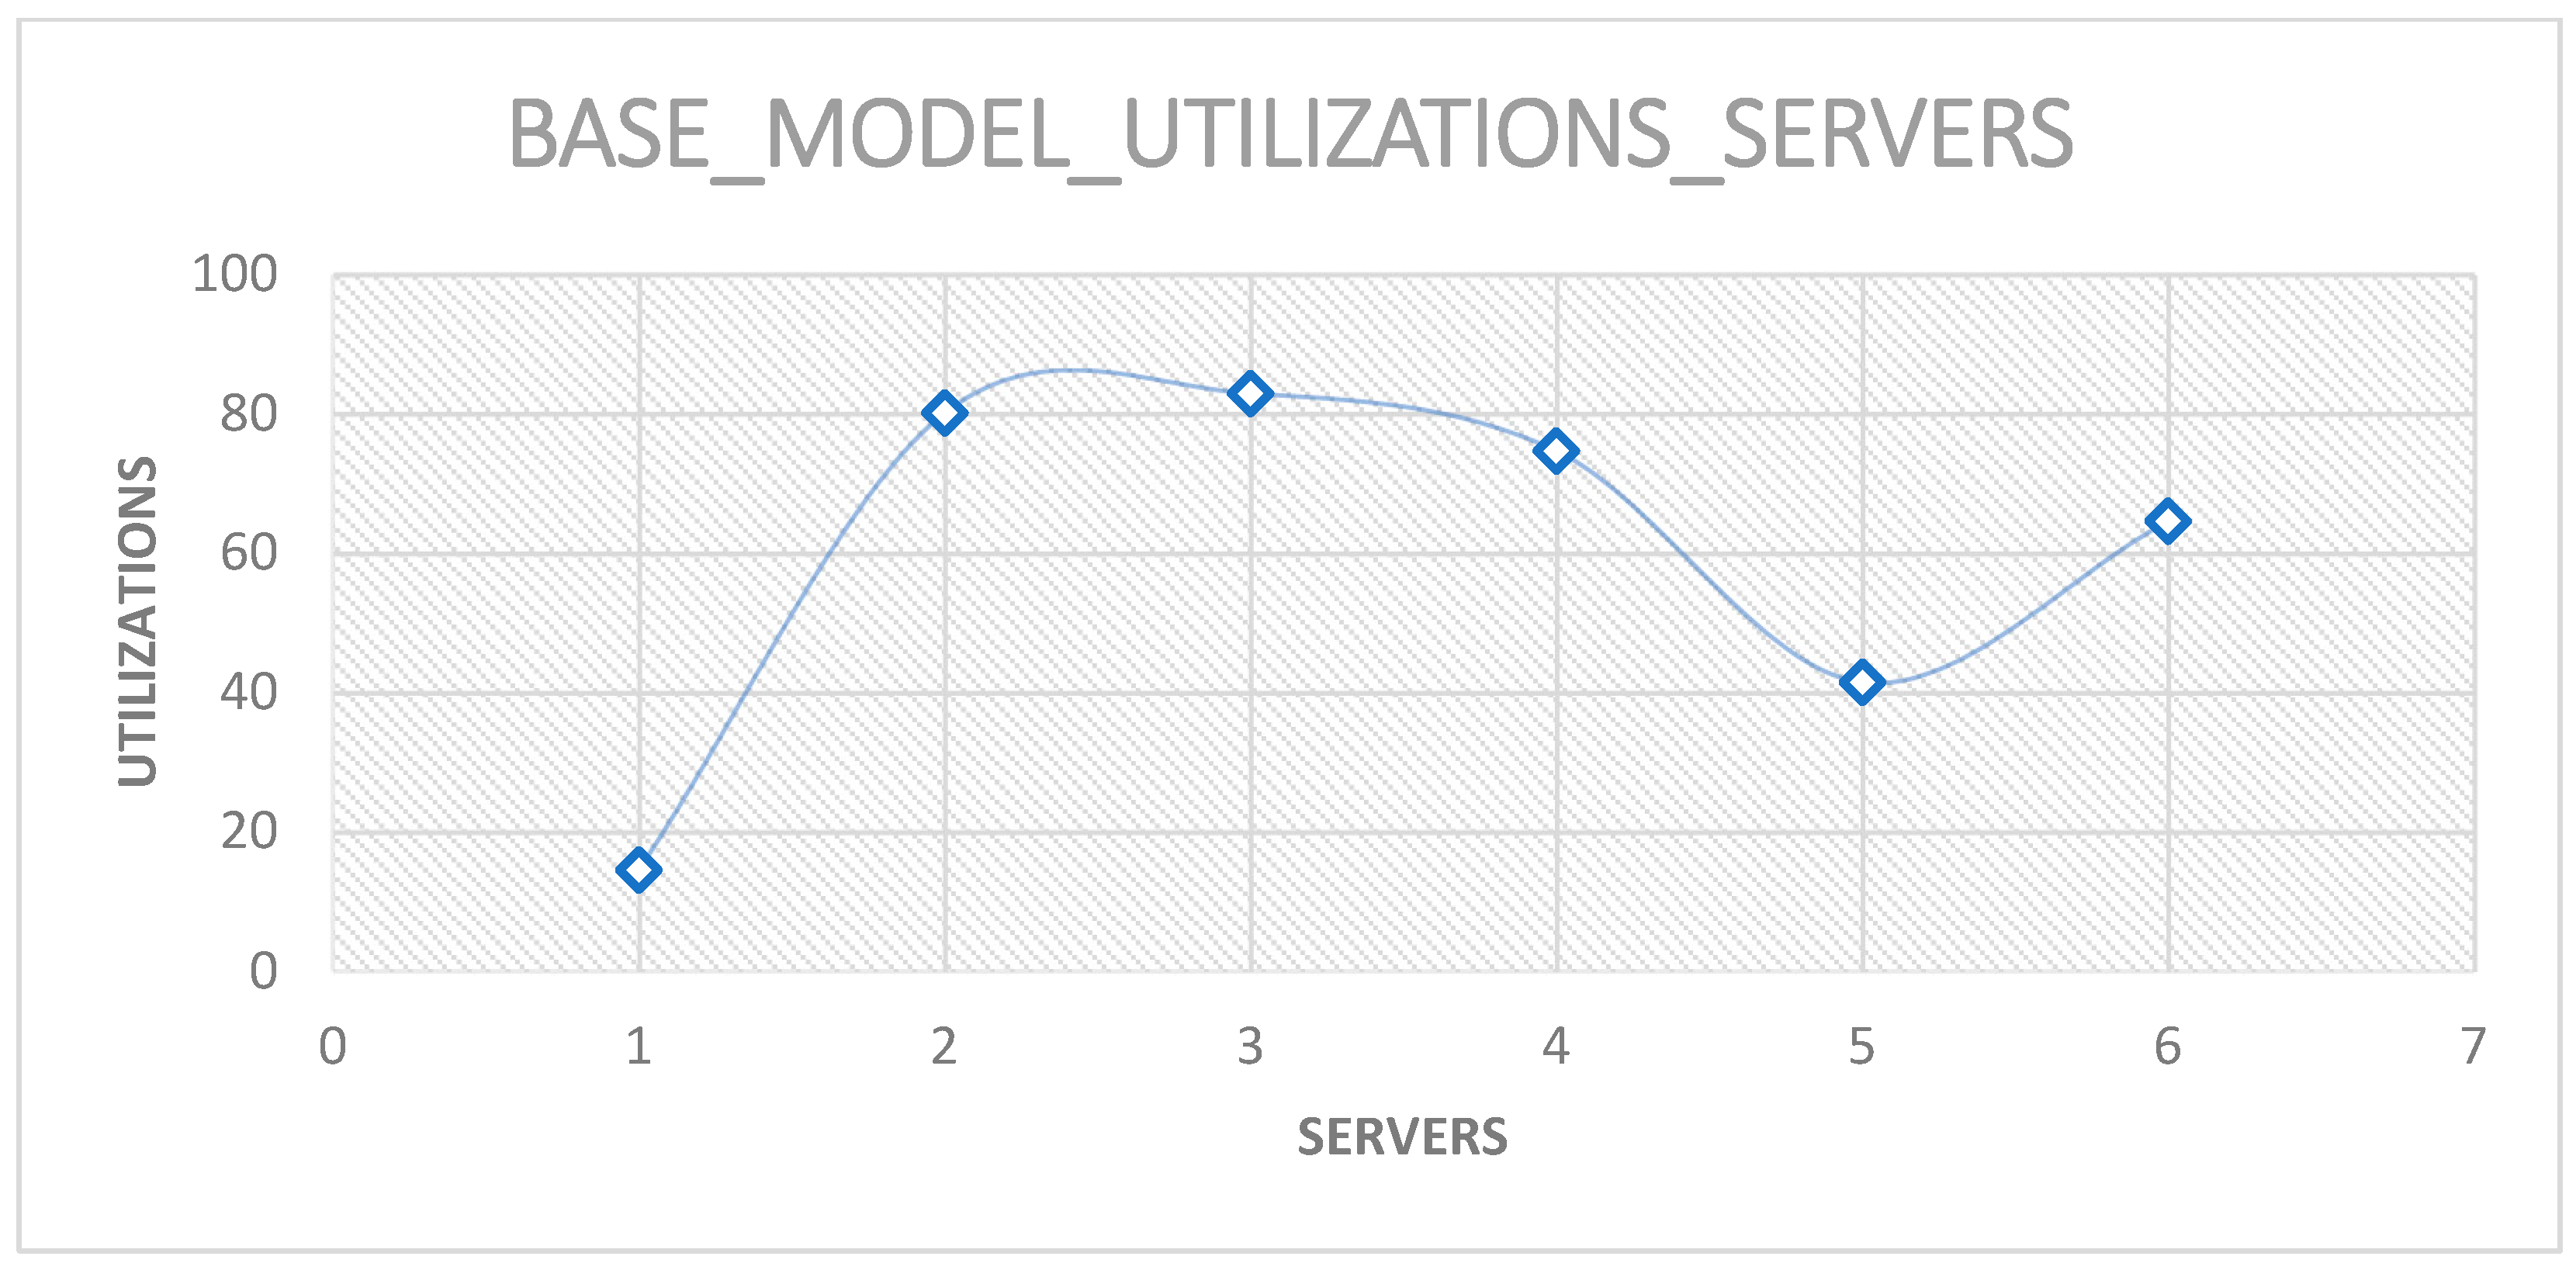
The base model analysis in Figure 3 identifies 2, 3, and 4 with high utilization rates, indicating that bottlenecks at these levels exceed 70% and the significant demand for their services. These findings indicate the need to optimize workflow management to enhance the system. The base model’s throughput of 0.975 provides a benchmark for assessing current performance.
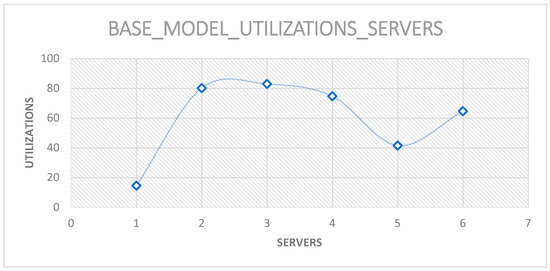
Figure 3.
Results of the Base Model.
2.4. Bottle Neck Identification
Servers 2, 3 and 4 were identified as bottlenecks in the base model due to their high utilization rates, which indicated that they were busy servers. To solve this issue and to achieve the desired objective, we have developed an alternative model by introducing some new technology in the system.
2.5. Alternative Model
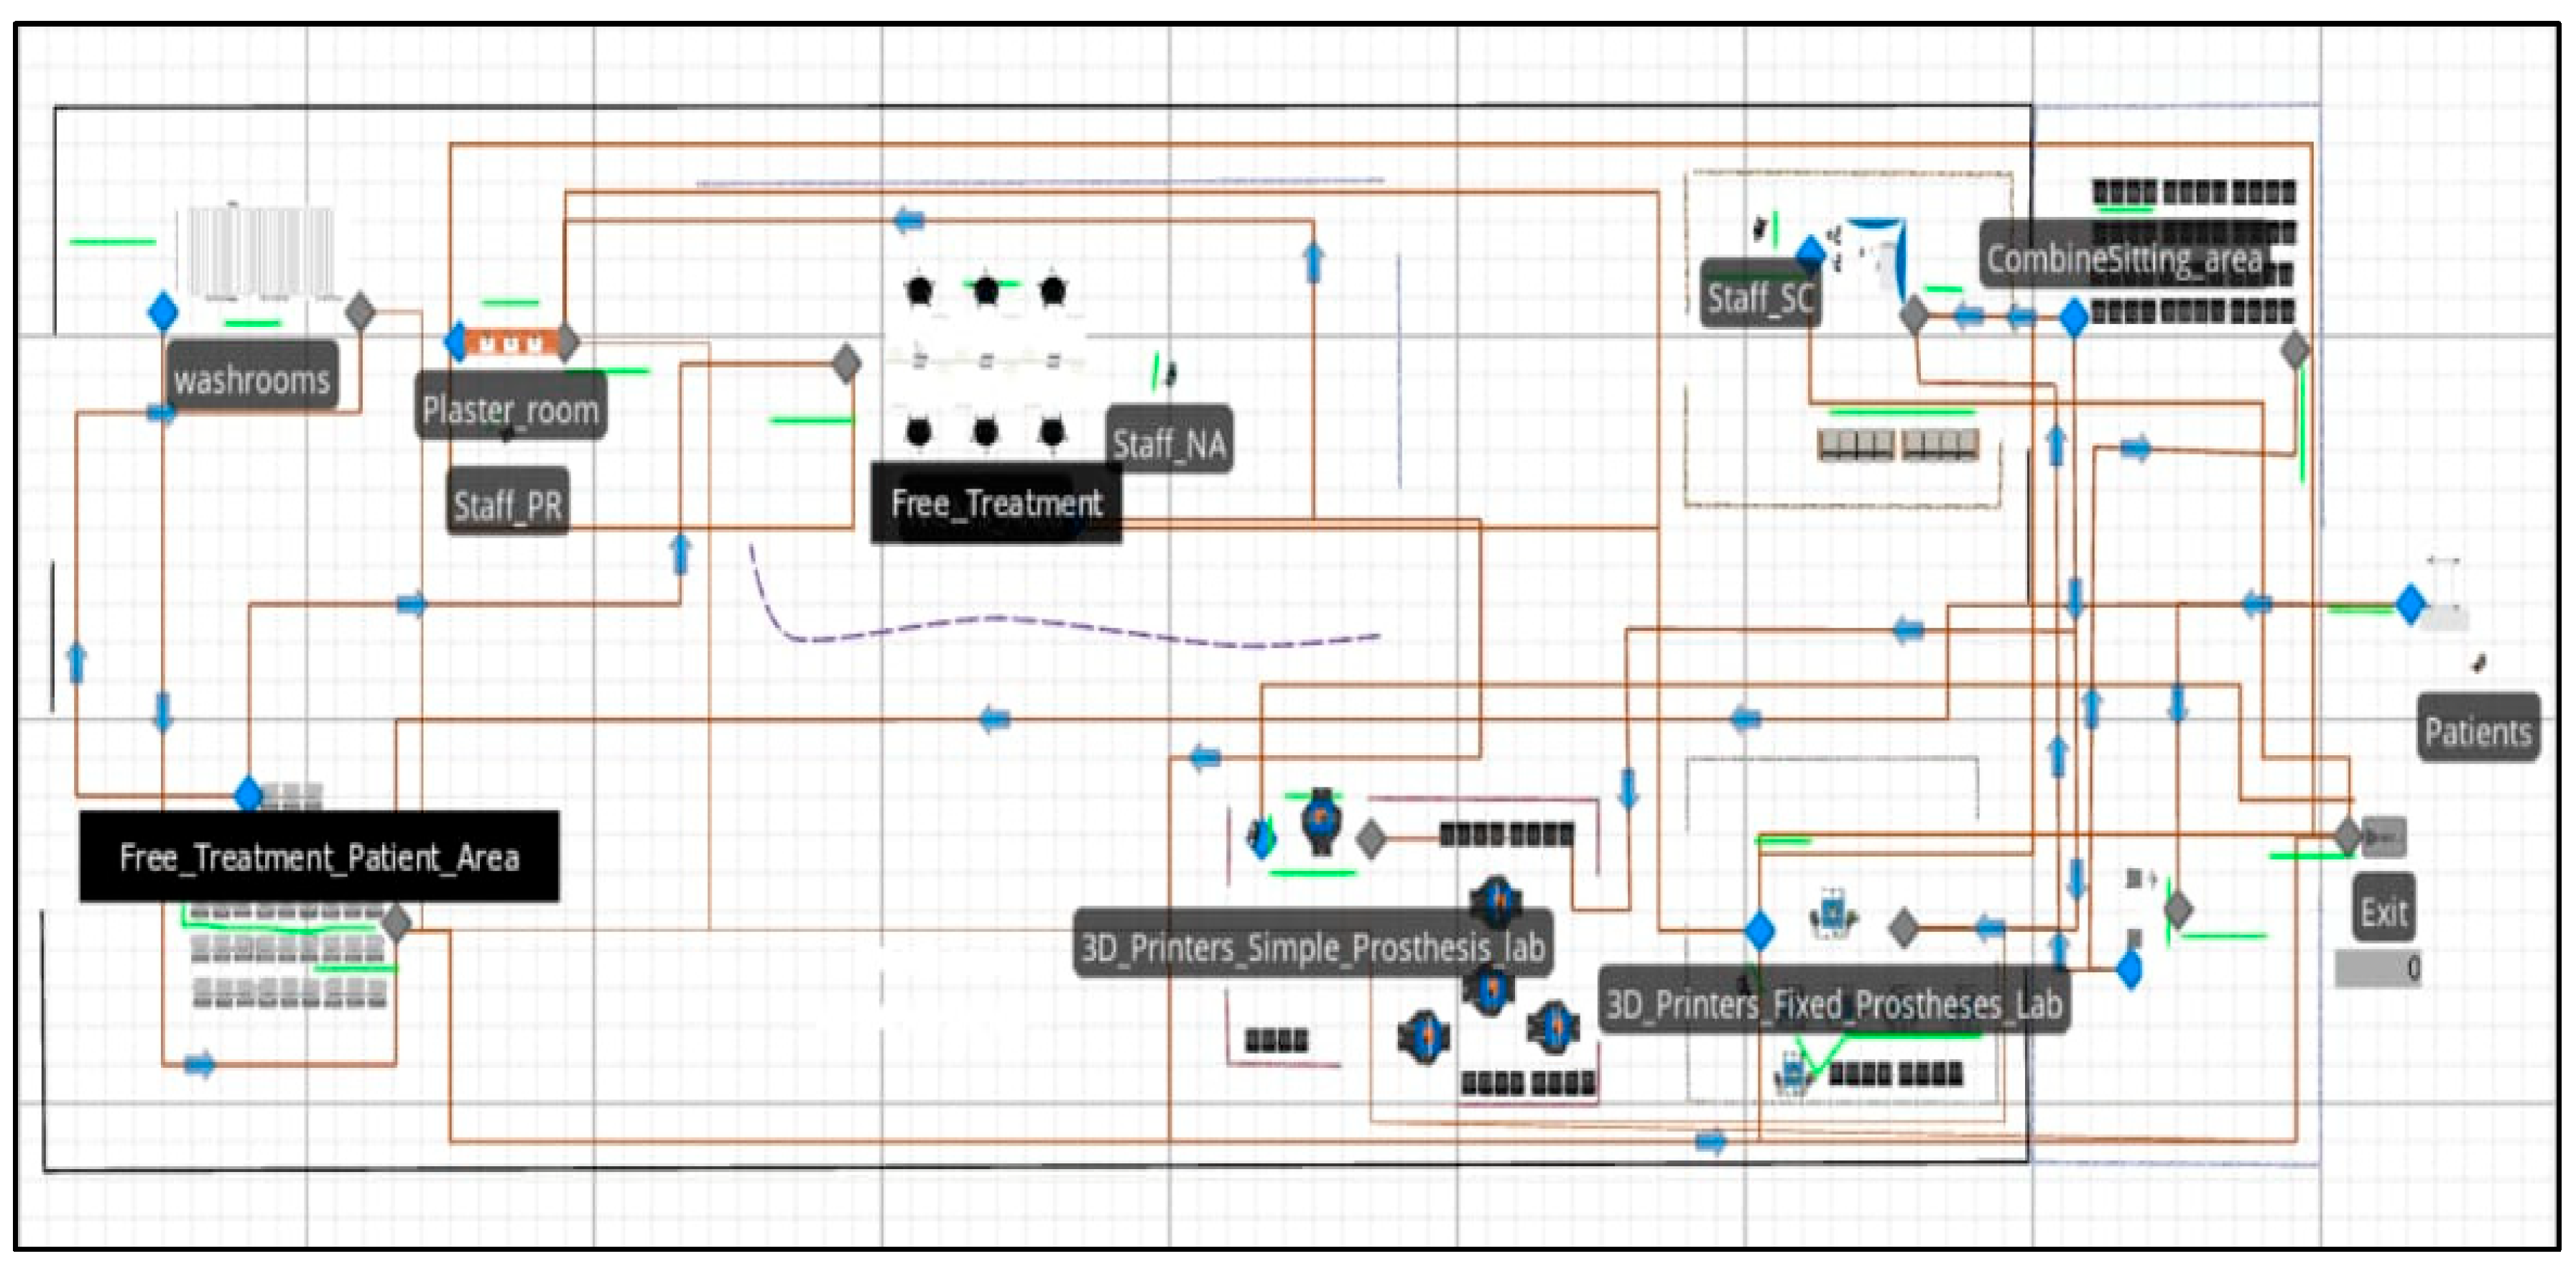
In the alternative model, we made some changes by replacing manual tasks at Servers 2 and 4 with 3D printing technology. This technology offers high efficiency and is expected to enhance the process. To reduce the load on Server 3, we assigned a staff member to help. Patients still follow the same path from entering to leaving, but these changes make the flow smoother. In this new model, we used technology and staff in smarter ways (Figure 4).
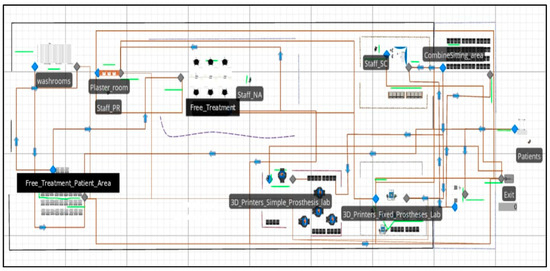
Figure 4.
The Alternative Model.
Alternative Model Stats
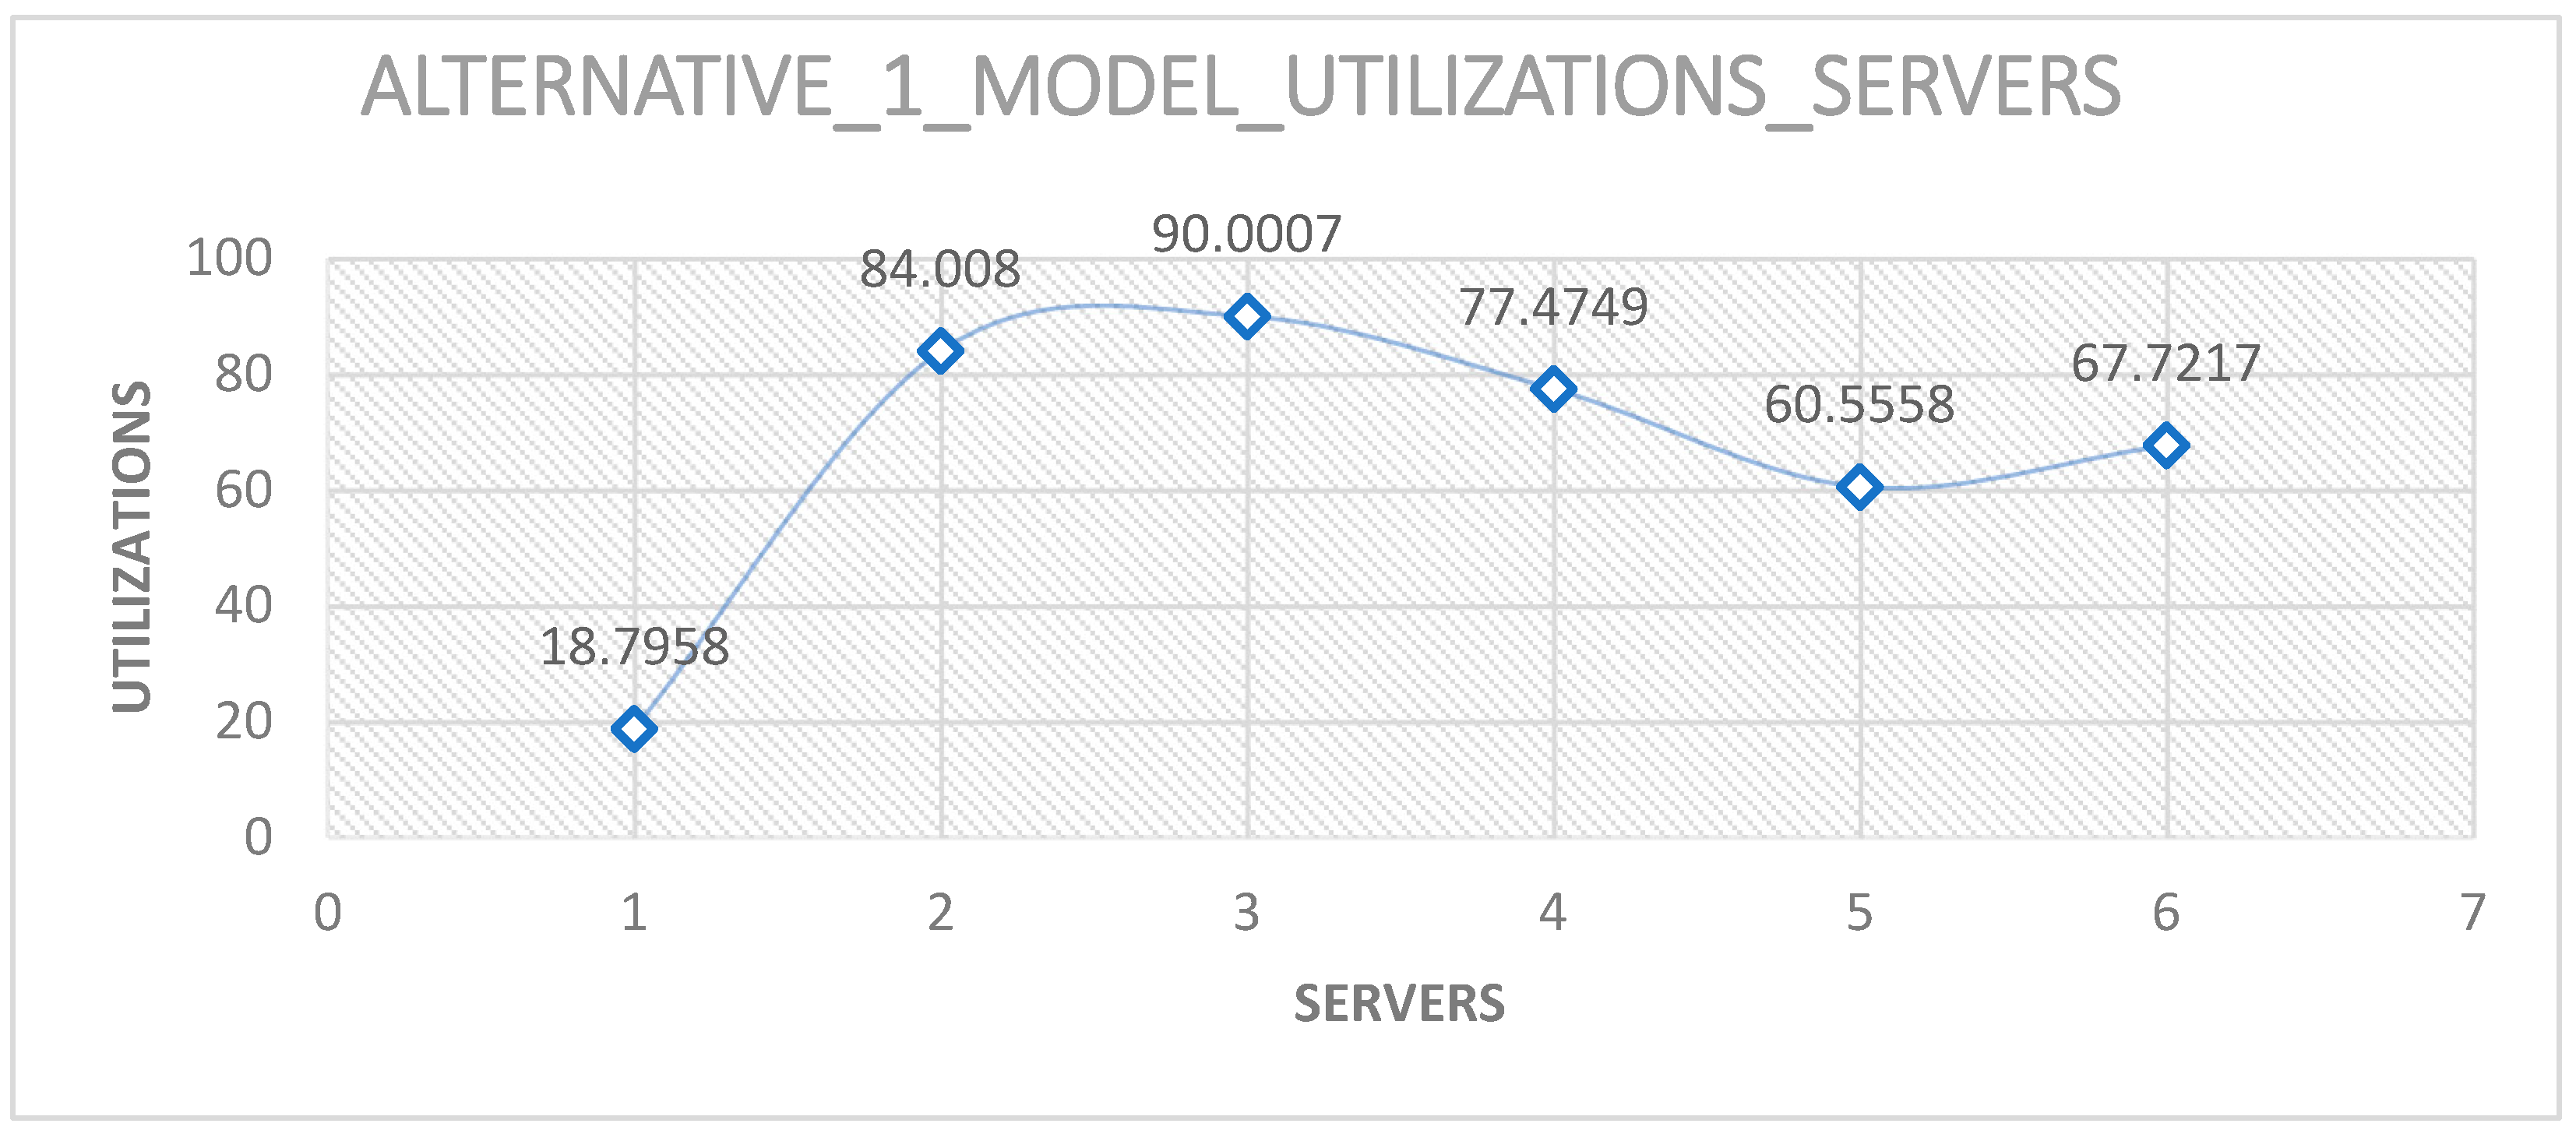
In the alternative model, Servers 2 and 4 use 3D printing, with 84.008% and 77.4749% utilization rates, respectively, while Server 3, which has extra help, exhibits a utilization rate of 90.0007% (Figure 5). The changes resulted in a high a throughput of 1.03, showing improved service quality. However, high utilization of the previous models’ bottlenecks is still observed.

Figure 5.
Alternative Model Results.
3. Design of Experiments in the Alternative Model Simulation Run
We employed design of experiments using CCD to improve the flow, as illustrated in Table 2. Using response surface methodology with a half-fractional central composite design, we performed 58 experimental runs shown in Figure 6 6 in Minitab. The parameters included the operators of Server 3, the capacity of Servers 2 and 4, and the process time of Servers 2 and 4 at various levels. The results provided data on server utilization and system throughput as response variables.
Table 2.
Design of Experiments using CCD.
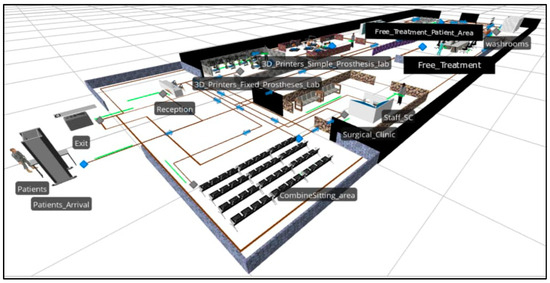
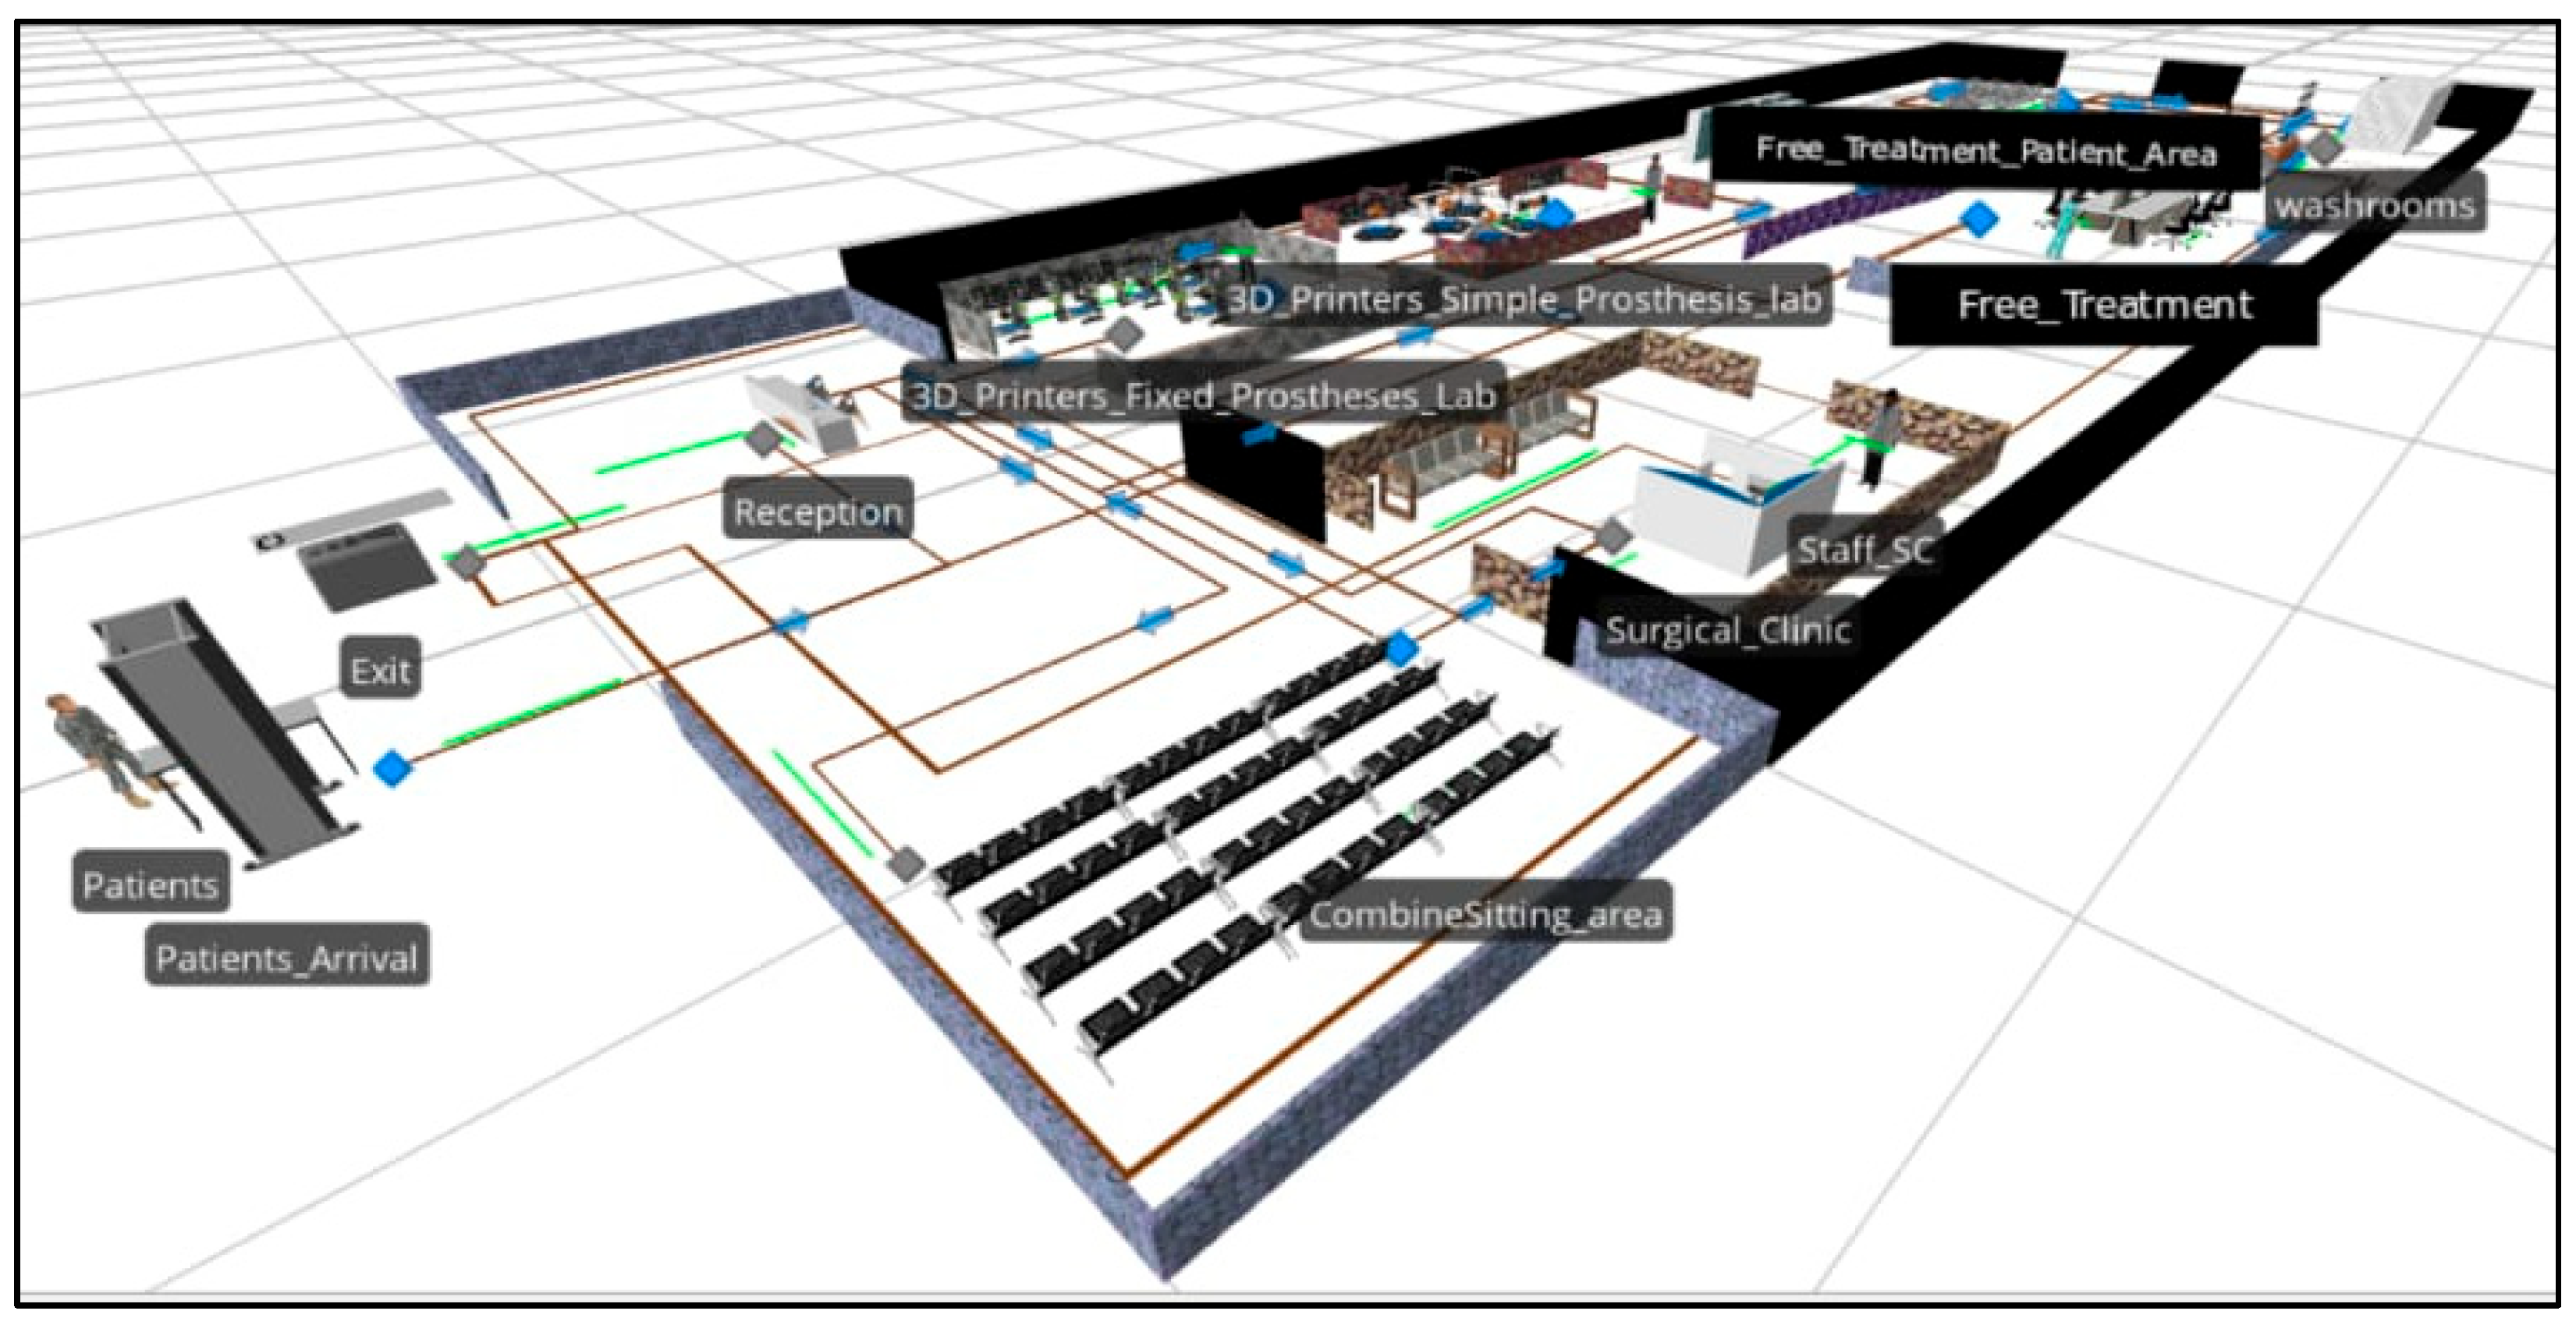
Figure 6.
Alternative Model 3D view.
Table 2 shows the design of experiments using central composite design for the simulation run for optimization purposes.
Utilization of Servers and Throughput of System Versus Experimental Runs
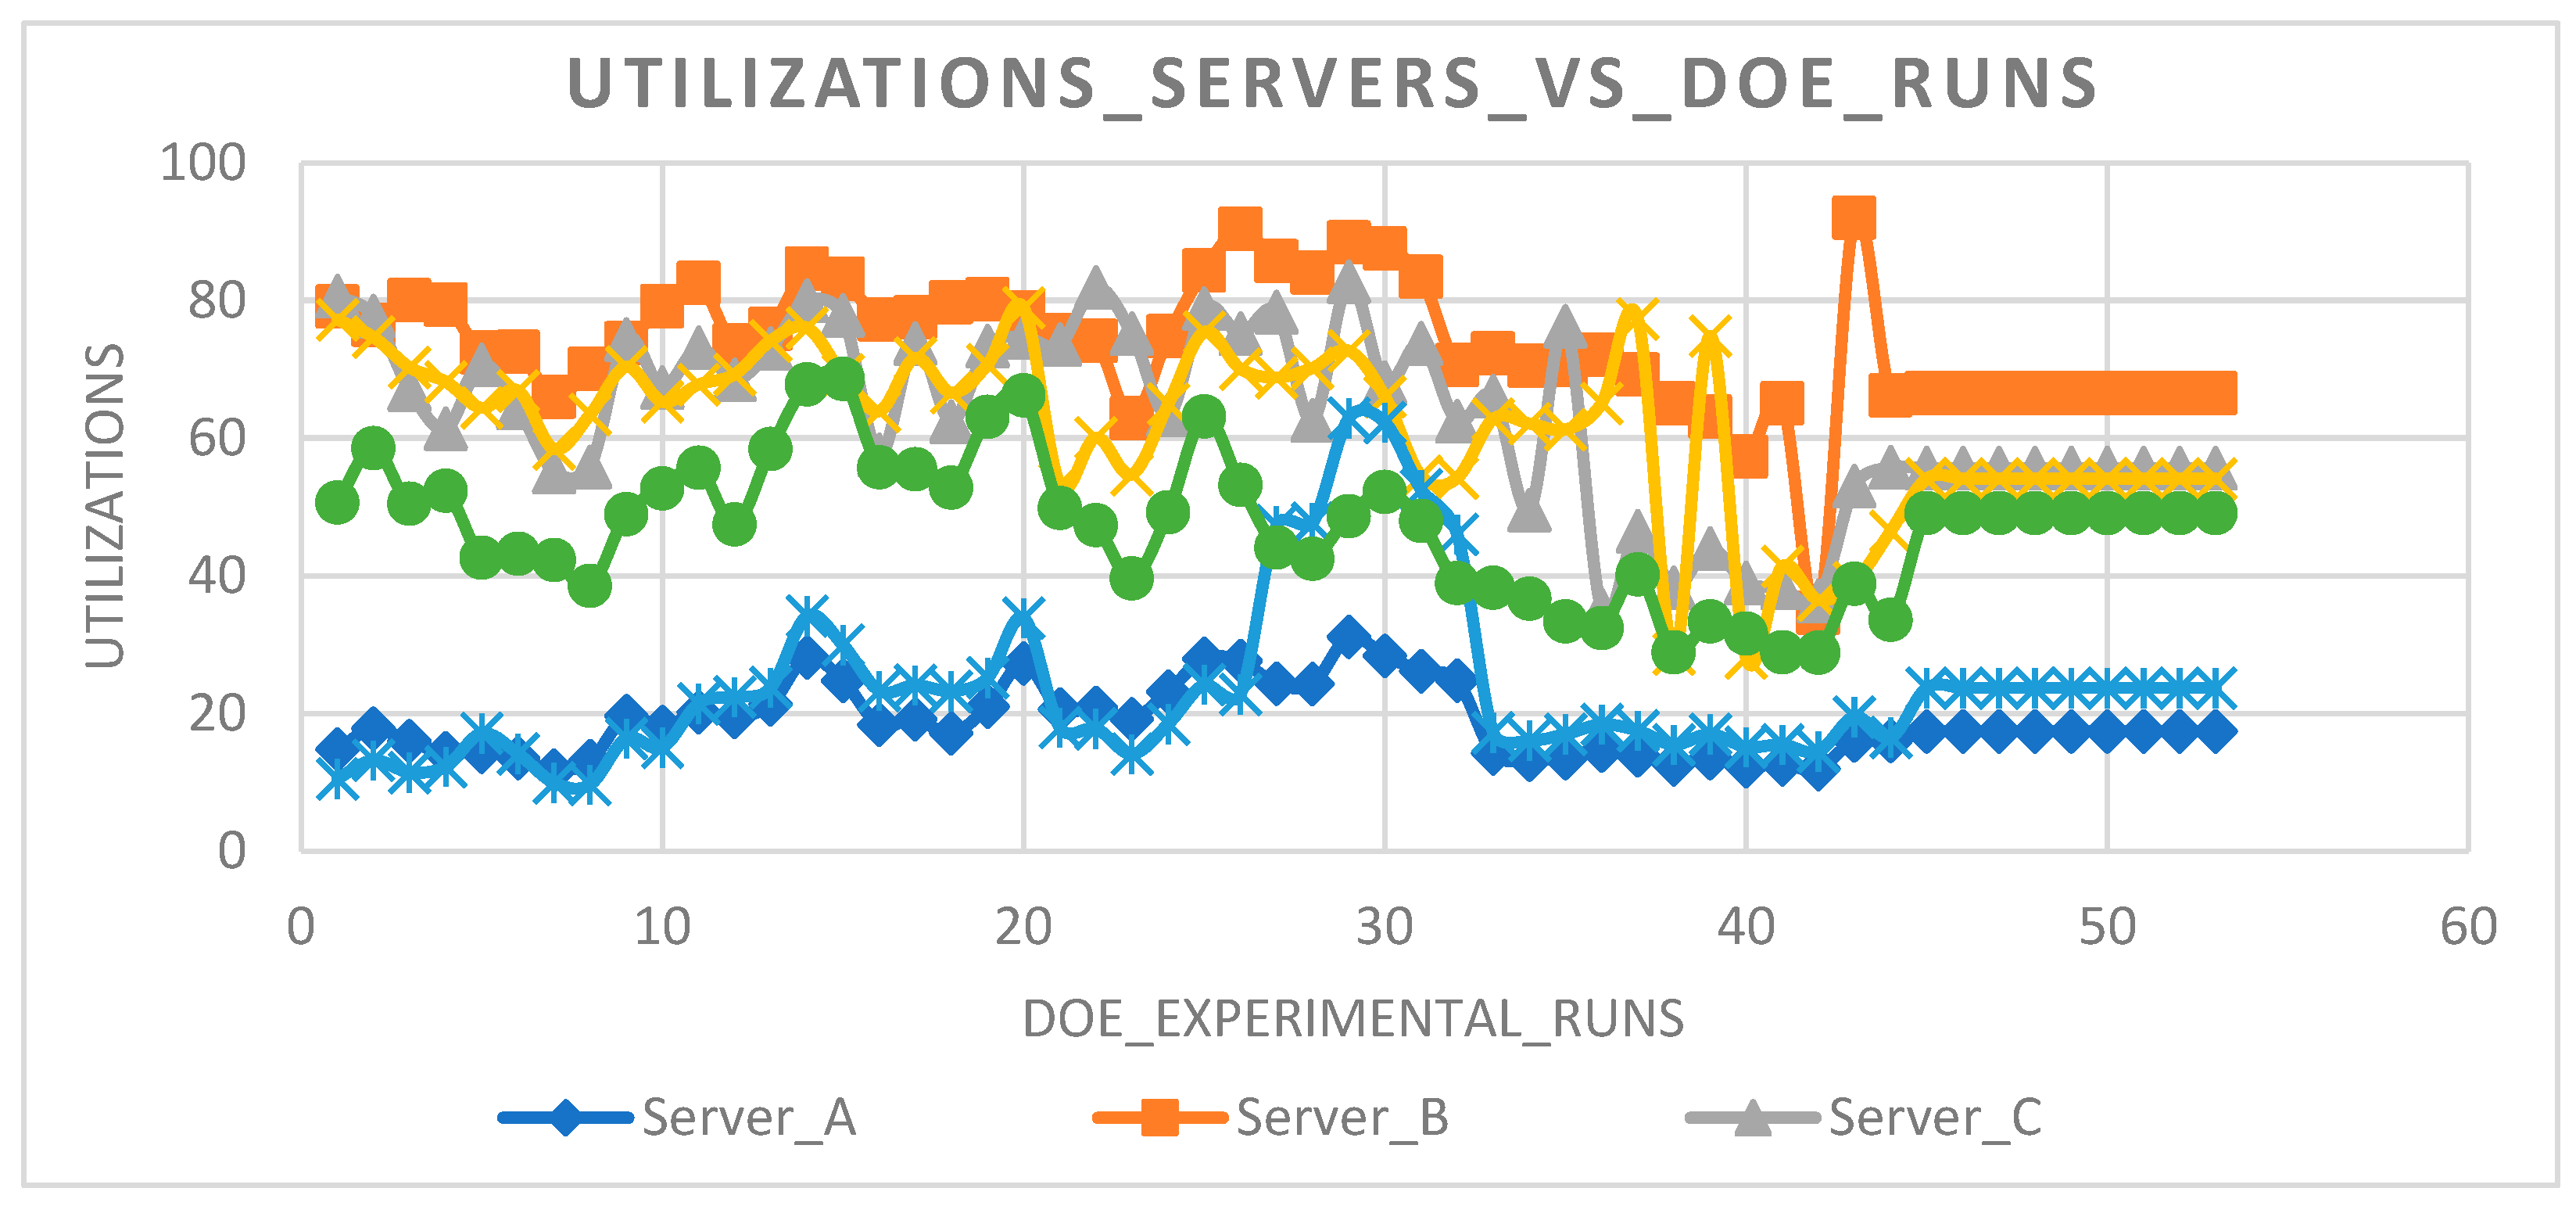
Figure 7 shows the results of utilization of servers in the graphical form for all the 53 combinations made by DOE using CCD with the parameters discussed above.
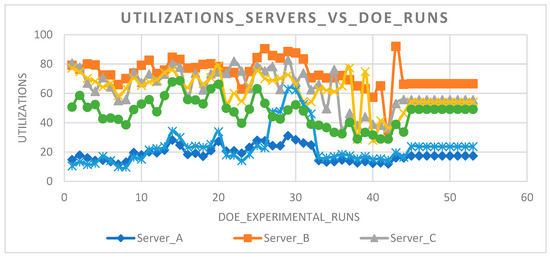
Figure 7.
Server Utilization Versus Experimental Runs.
Figure 8 shows the throughput results for all the 58 combinations made by DOE using CCD. The results are presented in graphical form, highlighting the variations across different parameter values.
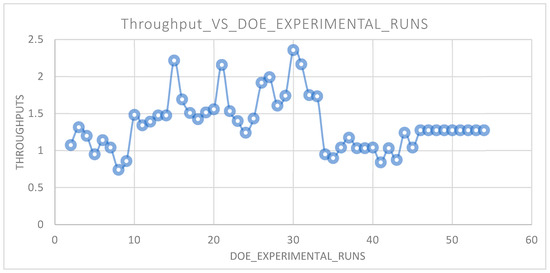
Figure 8.
Throughput Versus Experimental Runs.
4. Optimized Model
After conducting 53 experiments, we found the optimal parameter combination. These data are presented in Table 3. This setup achieved the highest throughput with evenly distributed workloads across all servers.
Table 3.
Optimized Parameters.
Comparison of Models
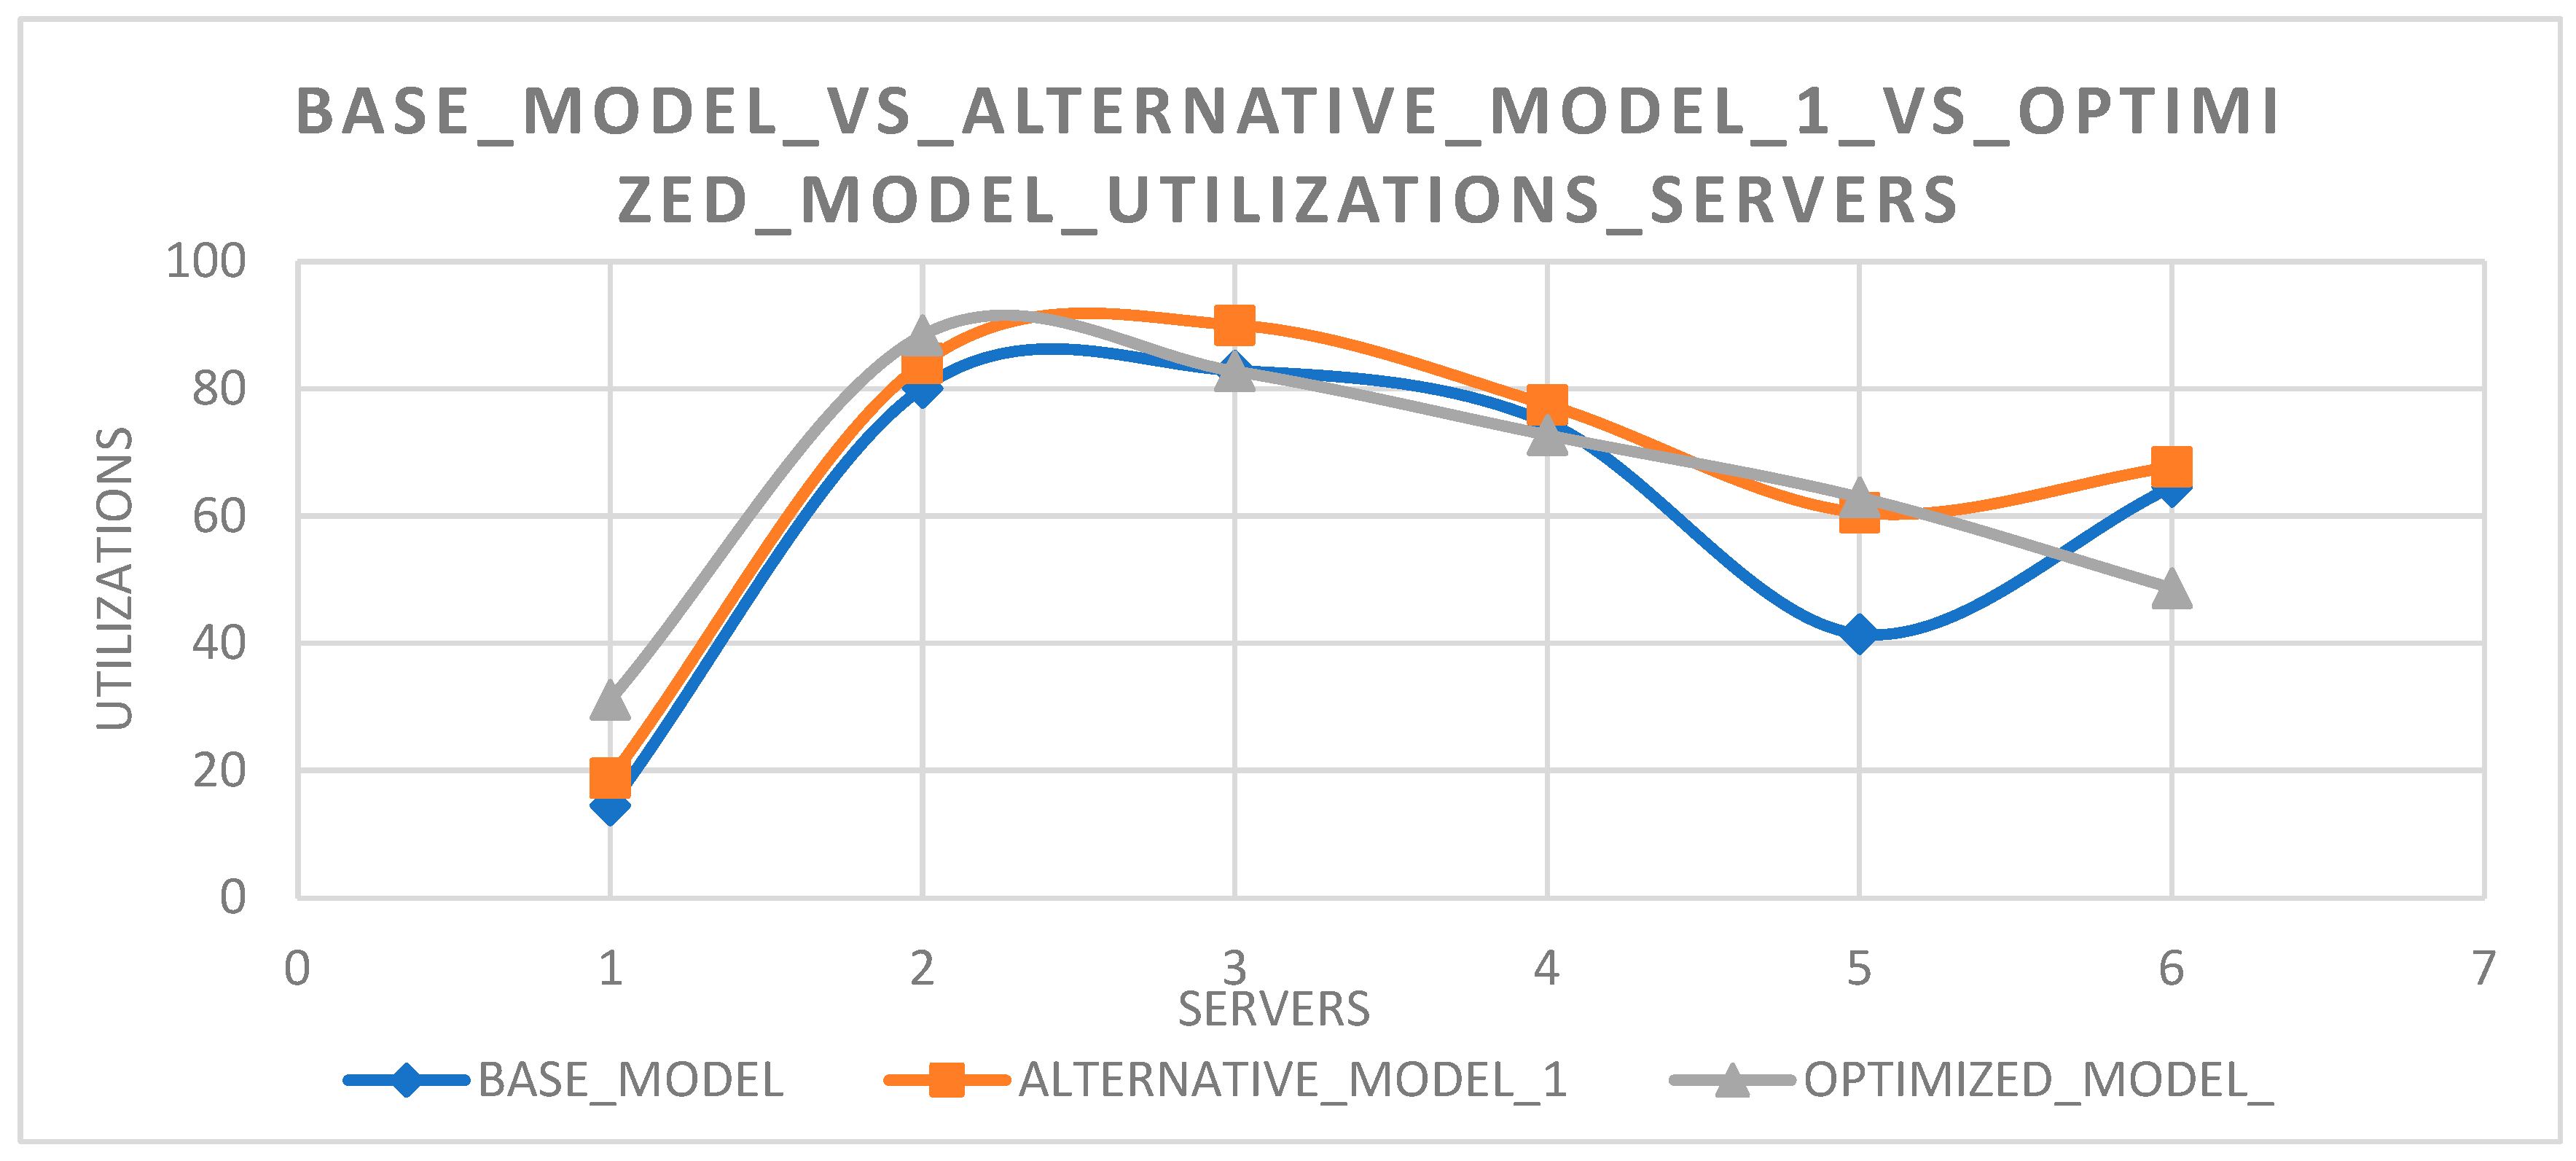
Figure 9 and Figure 10 show the results of the optimized model compared with the previous two models using utilization and throughput as response variables.
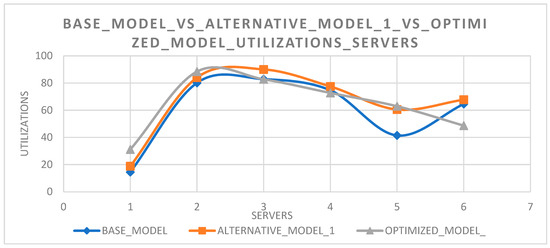
Figure 9.
Comparison of Model Utilization.
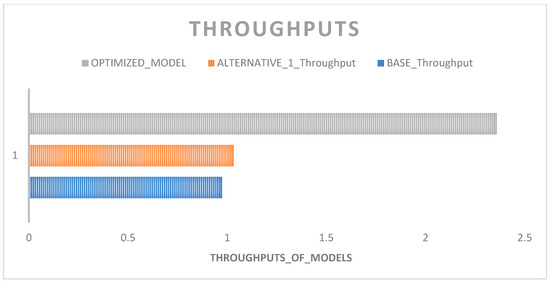
Figure 10.
Comparison of Model Throughput.
5. Conclusions
The optimized model outperformed the base and alternative models based on comparisons of throughput and server utilization. The improvement is characterized by a higher throughput of 2.3 in comparison to 0.9 for the base model and 1.03 for the alternative model. The optimized model has more balanced workload across Servers 1, 2, 3, 4, 5, and 6 with utilization rates of 31.1407%, 88.4426%, 82.7617%, 72.7216%, 62.9483%, and 48.6785%, respectively. This indicates that the optimized model is the best choice among all three models.
Author Contributions
G.A.M.: Conceptualization, technical writing, literature, data collection, simulation modeling, design of experiments, and analysis. S.S.: Literature review, technical writing, simulation modeling, design of experiments, analysis, and formatting. U.S.: Final review. G.S.: Data collection, vector design, formatting, and editing. R.A.M.: Data collection, formatting. All authors have read and agreed to the published version of the manuscript.
Funding
This research received no external funding.
Institutional Review Board Statement
Not applicable.
Informed Consent Statement
Not applicable.
Data Availability Statement
Data are contained within the article.
Conflicts of Interest
The authors declare no conflicts of interest.
References
- Banks, J.; Carson, J.S.; Nelson, B.L.; Nicol, D.M. Discrete-Event System Simulation; Pearson Prentice Hall: Hoboken, NJ, USA, 2023. [Google Scholar]
- Sinha, A.; Das, S. Optimizing real-world factory flows using aggregated discrete event simulation modelling. Flex. Serv. Manuf. J. 2023, 35, 123–140. [Google Scholar]
- Kumar, R.; Gupta, R. Exploring additive manufacturing as a high-throughput screening tool in prosthodontics. Addit. Manuf. 2023, 42, 101–115. [Google Scholar]
- Zhou, X.; Lee, M. Design of Experiments in Healthcare: Applications of Central Composite Design. J. Healthc. Eng. 2023, 24, 234–250. [Google Scholar]
- Patel, B.; Singh, P. Enhancing Throughput in Prosthodontics Using Additive Manufacturing and Discrete Event Simulation. J. Prosthet. Dent. 2023, 130, 101–110. [Google Scholar]
- Abideen, A.; Mohamad, F.B. Improving the performance of a Malaysian pharmaceutical warehouse supply chain by integrating value stream mapping and discrete event simulation. J. Model. Manag. 2021, 16, 70–102. [Google Scholar] [CrossRef]
- Berleant, D. Discrete-Event Simulation in Healthcare Settings: A Review. Modelling 2022, 3, 417–433. [Google Scholar] [CrossRef]
- Intini, F.; Merla, P.; Pagliara, R.; Partipilo, M.; Stigliano, G.; Veneto, D. Discrete Event Simulation for the Analysis and Re-Engineering of Production and Logistics Cycles: The Case of Master Italy Company; Springer Nature Switzerland: Cham, Switzerland, 2021. [Google Scholar]
- Vázquez-Serrano, J.I.; Peimbert-García, R.E.; Cárdenas-Barrón, L.E. Discrete-Event Simulation Modeling in Healthcare: A Comprehensive Review. Int. J. Environ. Res. Public Health 2021, 18, 12262. [Google Scholar] [CrossRef] [PubMed]
- Omogbai, O.; Salonitis, K. Manufacturing system lean improvement design using discrete event simulation. Procedia CIRP 2021, 57, 195–200. [Google Scholar] [CrossRef]


Disclaimer/Publisher’s Note: The statements, opinions and data contained in all publications are solely those of the individual author(s) and contributor(s) and not of MDPI and/or the editor(s). MDPI and/or the editor(s) disclaim responsibility for any injury to people or property resulting from any ideas, methods, instructions or products referred to in the content. |
© 2024 by the authors. Licensee MDPI, Basel, Switzerland. This article is an open access article distributed under the terms and conditions of the Creative Commons Attribution (CC BY) license (https://creativecommons.org/licenses/by/4.0/).