Abstract
High-quality drinking water is an essential need of every modern settlement. Typical analysis applies the EPANET to calculate the water age and the chlorine distribution. However, it cannot cope with diffusion or three-dimensional effects. This study aims to find the potential cases where the traditional modelling needs adjustment or improvements. This study uses computational fluid dynamics to analyse how non-reacting contaminants (e.g., fluoride, chloride, metal oxides, and micropollutants) spread in water distribution networks.
1. Introduction
The traditional approach to the mixing of any substance in water distribution networks is to apply complete mixing. Although the dominating hydraulic software, EPANET, uses complete mixing for junctions and for tanks as well, some publications have already pointed out its limitations and inaccuracies [1]. Experimental and computational fluid dynamic (CFD) simulations were performed to develop analytic models to correct the mixing models [2,3]. Although the effect of the Reynolds number (or the diameters and flow rates) is usually considered, the angle of the junctions is assumed to be perpendicular to each other [4].
This study further expands the modelling options by including different angle variations of junctions. The idea is to run a set of CFD simulations, which creates the opportunity to fit a multivariable function considering the angle as input parameter. Moreover, an axisymmetric pressure stabiliser tank (there is no direct chlorine injection, only through inflowing water) is analysed with CFD simulation. The question is how fast the incoming chlorinated water is mixing in the tank, and how accurate it is to assume a perfectly mixed outflow if the flow conditions are changed and the tank is being emptied? Since the simulations cover a short a period in time and are small spatially, the chlorine decay is not yet modelled during the simulations, i.e., the chlorine acts as a non-reacting substance with the water.
2. Materials and Methods
The 2D junction parameter space is evaluated using the DAKOTA framework and OpenFOAM as the transient CFD solver. The junction consists of a horizontal main branch and a secondary branch with varying connection angles ranging from 15 to 90 degrees, see Figure 1. The main inlet volumetric flow rate corresponds to a Reynolds number of 1000, and the same rate is set for the main outlet, that is, the left and right branches respectively. A second parameter is the flow rate on the secondary inlet, with a portion of the main inlet value ranging from 0.1 to 1.0. Water is treated as an incompressible fluid with a kinematic viscosity of 1.3 × 10⁻⁶ (m2/s), and substance is modelled using a passive scalar set to 1 on the main and 0 on the secondary inlet. The 2D mesh is automatically generated using polyhedral cells incorporating a boundary layer mesh. Our goal function is the difference between the area-weighted average of the main and secondary outlet, where approaching 0 would represent a complete mixing.
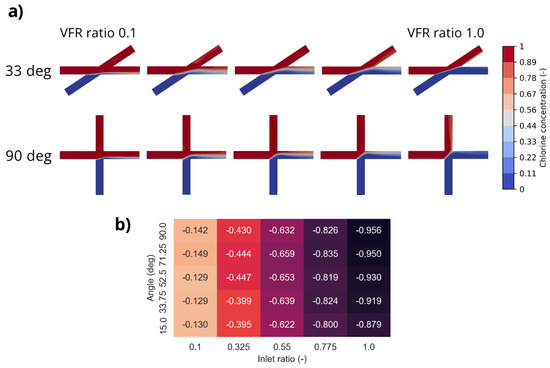
Figure 1.
Chlorine distribution in junctions in relation to the angle and the volume flow rate ratio. (a) Contour plots for the 33- and 90-degree cases, and (b) heatmap of the concentration difference between right and top outlet.
The tank simulation is carried out using ANSYS Fluent and the VOF model in an axisymmetric case using hexahedral cells. Substance is treated similarly as a passive scalar set to 1 on the inlet. The tank geometry is chosen using a 1 m diameter and 5 m height with a 0.4 m diameter inlet–outlet tube. The simulations are initialised using a 2 m water level height, and the inlet flow rate is set according to the curve shown in Figure 2b, modelling daily consumption. However, due to limiting the computational time, the simulation is scaled to an hour from a full day.
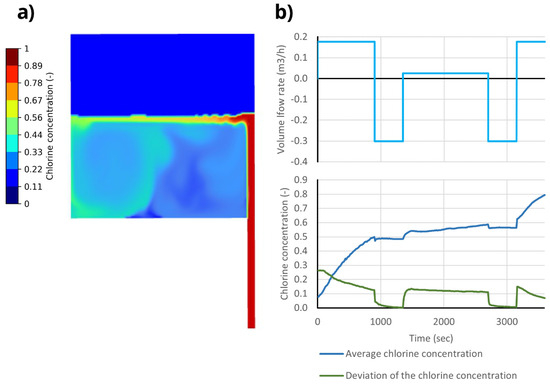
Figure 2.
Chlorine distribution in a tank. (a) Contour plot of chlorine distribution in the tank for t = 500 s, and (b) curve of the volume flow rate on the inlet, the average chlorine concentration in water, and the deviation of the chlorine concentration with respect to time.
3. Results
Figure 1 presents the results of the junction simulations. The top side shows two angle and five flow rate ratio scenarios, and the concentration colours the geometry. The results clearly show how inaccurately a complete mixing model would predict the outflowing concentrations. A simple perpendicular junction with the same inflow (bottom right figure) shows an almost perfect deflection of the incoming streams. The bottom side collects every result. The columns represent different flow rate ratios, and the rows stand for the angles. While the flow rate ratio has a crucial effect to the outflows, the angle only slightly affects it.
Figure 2 shows the results of the tank simulations. The left side captures a snapshot with an incoming flow with high chlorine concentration. The large blue area represents the air above the water level without any chlorine. The top right side shows the boundary condition of the inflow, and the bottom the average and standard deviation of the chlorine inside the tank. While the average quickly increases from zero during the first stage of high inflow, it does not decrease significantly during morning peak hours. However, the deviation drops to zero rapidly, i.e., the outflow has an equalizer effect.
4. Discussion and Conclusions
This study presented the mixing of a non-reacting chlorine distribution in a junction with four pipelines and in a pressure stabilizer tank. While the former considers different volumetric flow rate ratios and angle scenarios, the tank simulation is transient, modelling a daily consumption curve scaled to an hour.
The junction simulations highlight how inaccurate a complete mixing approach could be if there are two incoming and two outflowing pipelines. However, they also highlight the significant effect of the inflow ratios and the minor influence of the angle. Moreover, simulating the tank predicts a quick mixing of the inflowing chlorinated water.
Author Contributions
Conceptualization, R.W., L.S., G.R.A. and A.O.; methodology, L.S., Á.H. and G.B.; software L.S., Á.H. and G.B.; formal analysis, R.W., L.S., Á.H. and G.B.; resources, R.W. and L.S.; writing—original draft preparation, R.W. and L.S.; writing—review and editing, G.R.A. and A.O.; visualization, Á.H. and G.B.; supervision, A.O.; project administration, R.W. and A.O.; funding acquisition, R.W., L.S. and A.O. All authors have read and agreed to the published version of the manuscript.
Funding
Project no. TKP-6-6/PALY-2021 has been implemented with the support provided by the Ministry of Culture and Innovation of Hungary from the National Research, Development and Innovation Fund, financed under the TKP2021-NVA funding scheme. This project was also supported by the OTKA Grant K-135436 of Csaba Hős.
Institutional Review Board Statement
Not applicable.
Informed Consent Statement
Not applicable.
Data Availability Statement
The simulations are available by request from the authors.
Conflicts of Interest
The authors declare no conflicts of interest.
References
- Ho, C.K.; Orear, L.; Wright, J.L.; Mckenna, S.A. Contaminant Mixing at Pipe Joints: Comparison Between Laboratory Flow Experiments and Computational Fluid Dynamics Models. In Proceedings of the Water Distribution Systems Analysis Symposium, Cincinnati, OH, USA, 27–30 August 2006. [Google Scholar]
- Austin, R.G.; Van Bloemen Waanders, B.; Mckenna, S.; Choi, C.Y. Mixing at Cross Junctions in Water Distribution Systems. II: Experimental Study. J. Water Resour. Plan. Manag. 2008, 134, 295–302. [Google Scholar] [CrossRef]
- Yu, T.C.; Shao, Y.; Shen, C. Mixing at Cross Joints with Different Pipe Sizes in Water Distribution Systems. J. Water Resour. Plan. Manag. 2014, 140, 658–665. [Google Scholar] [CrossRef]
- Yousefian, R.; Duchesne, S. Improving incomplete mixing modeling for junctions of water distribution networks. J. Hydroinformatics 2024, 26, 351–367. [Google Scholar] [CrossRef]

Disclaimer/Publisher’s Note: The statements, opinions and data contained in all publications are solely those of the individual author(s) and contributor(s) and not of MDPI and/or the editor(s). MDPI and/or the editor(s) disclaim responsibility for any injury to people or property resulting from any ideas, methods, instructions or products referred to in the content. |
© 2024 by the authors. Licensee MDPI, Basel, Switzerland. This article is an open access article distributed under the terms and conditions of the Creative Commons Attribution (CC BY) license (https://creativecommons.org/licenses/by/4.0/).