
Area Leakage Estimation in Water Distribution Systems: A Focus on Background Leakage †


Abstract
1. Introduction
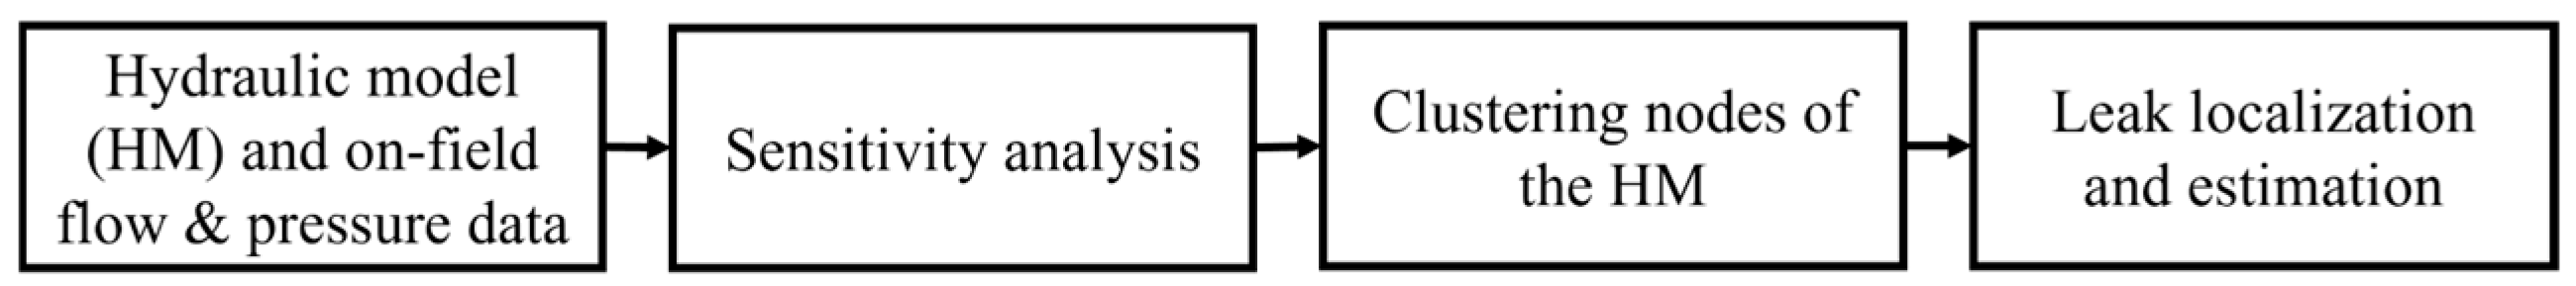
2. Methodology
2.1. Sensitivity Analysis
2.2. Clustering of Nodes
2.3. Leak Localization and Estimation
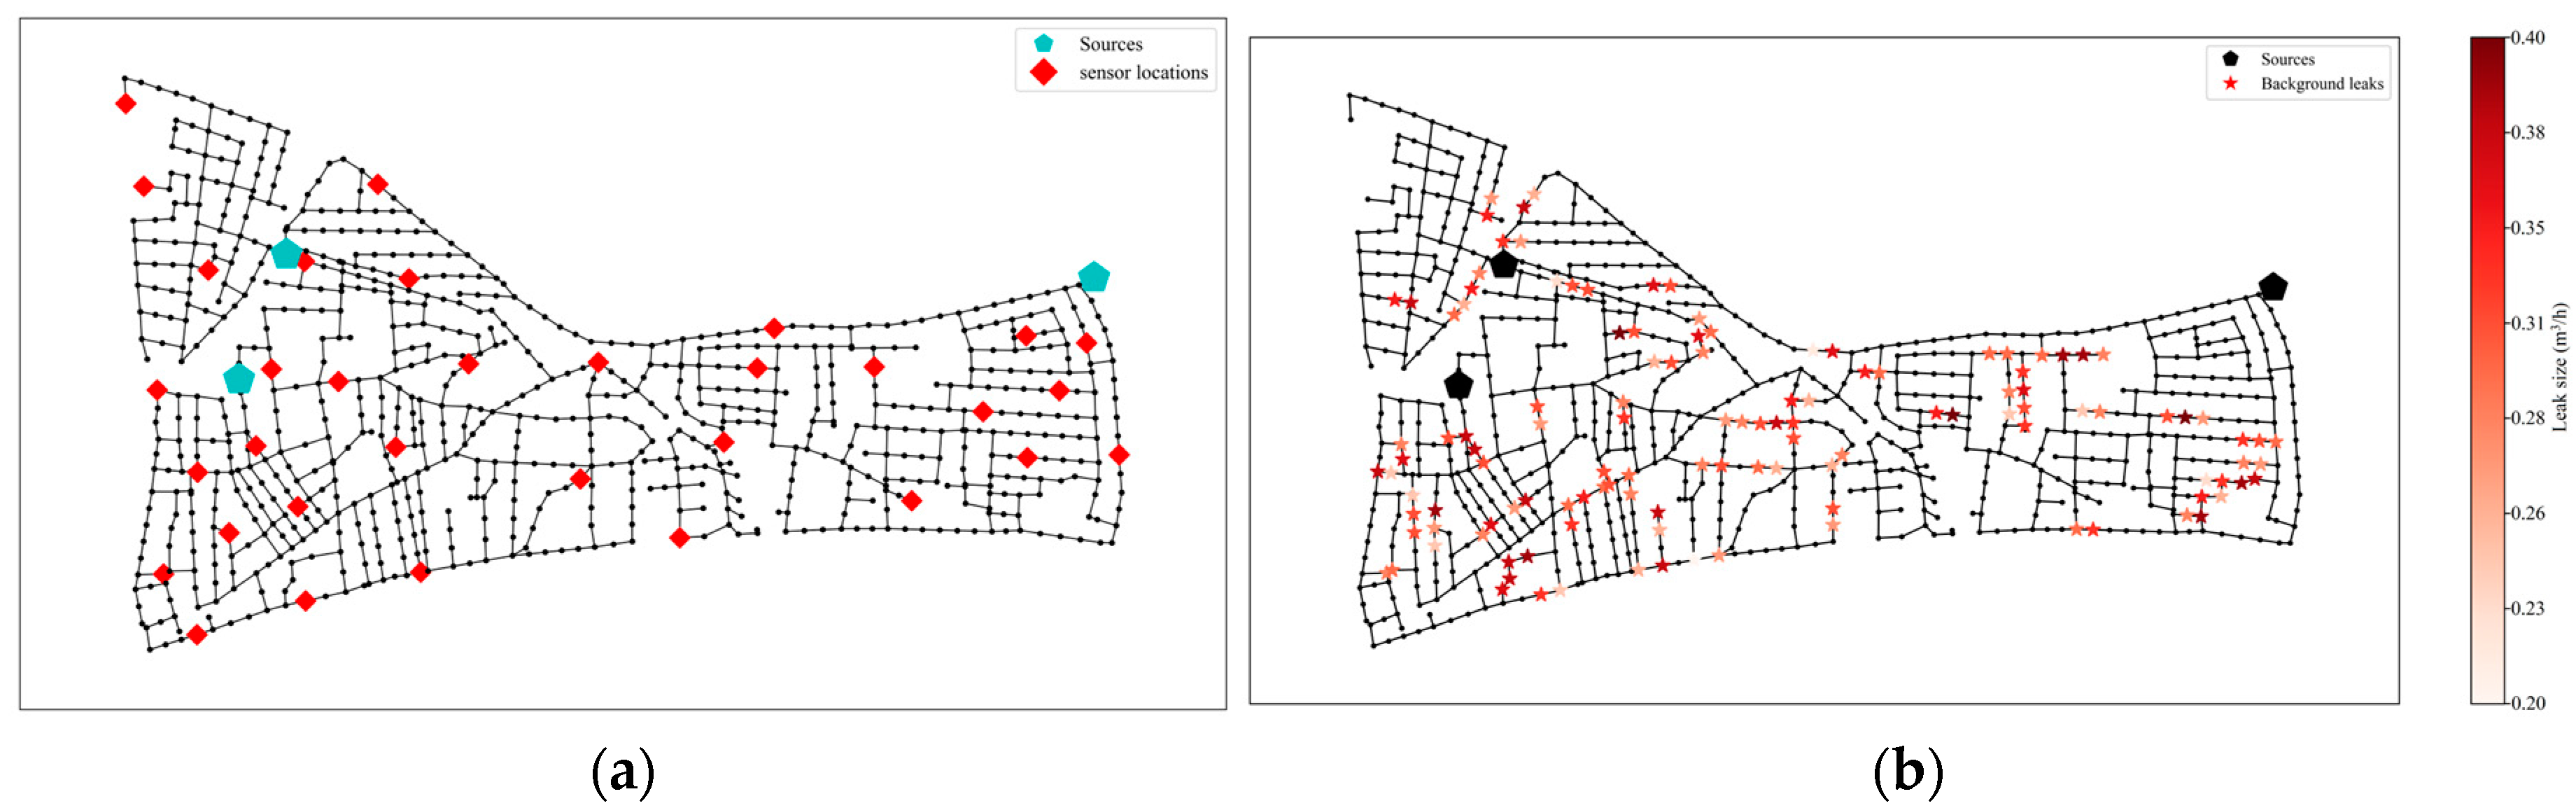
3. Case Study and Dataset
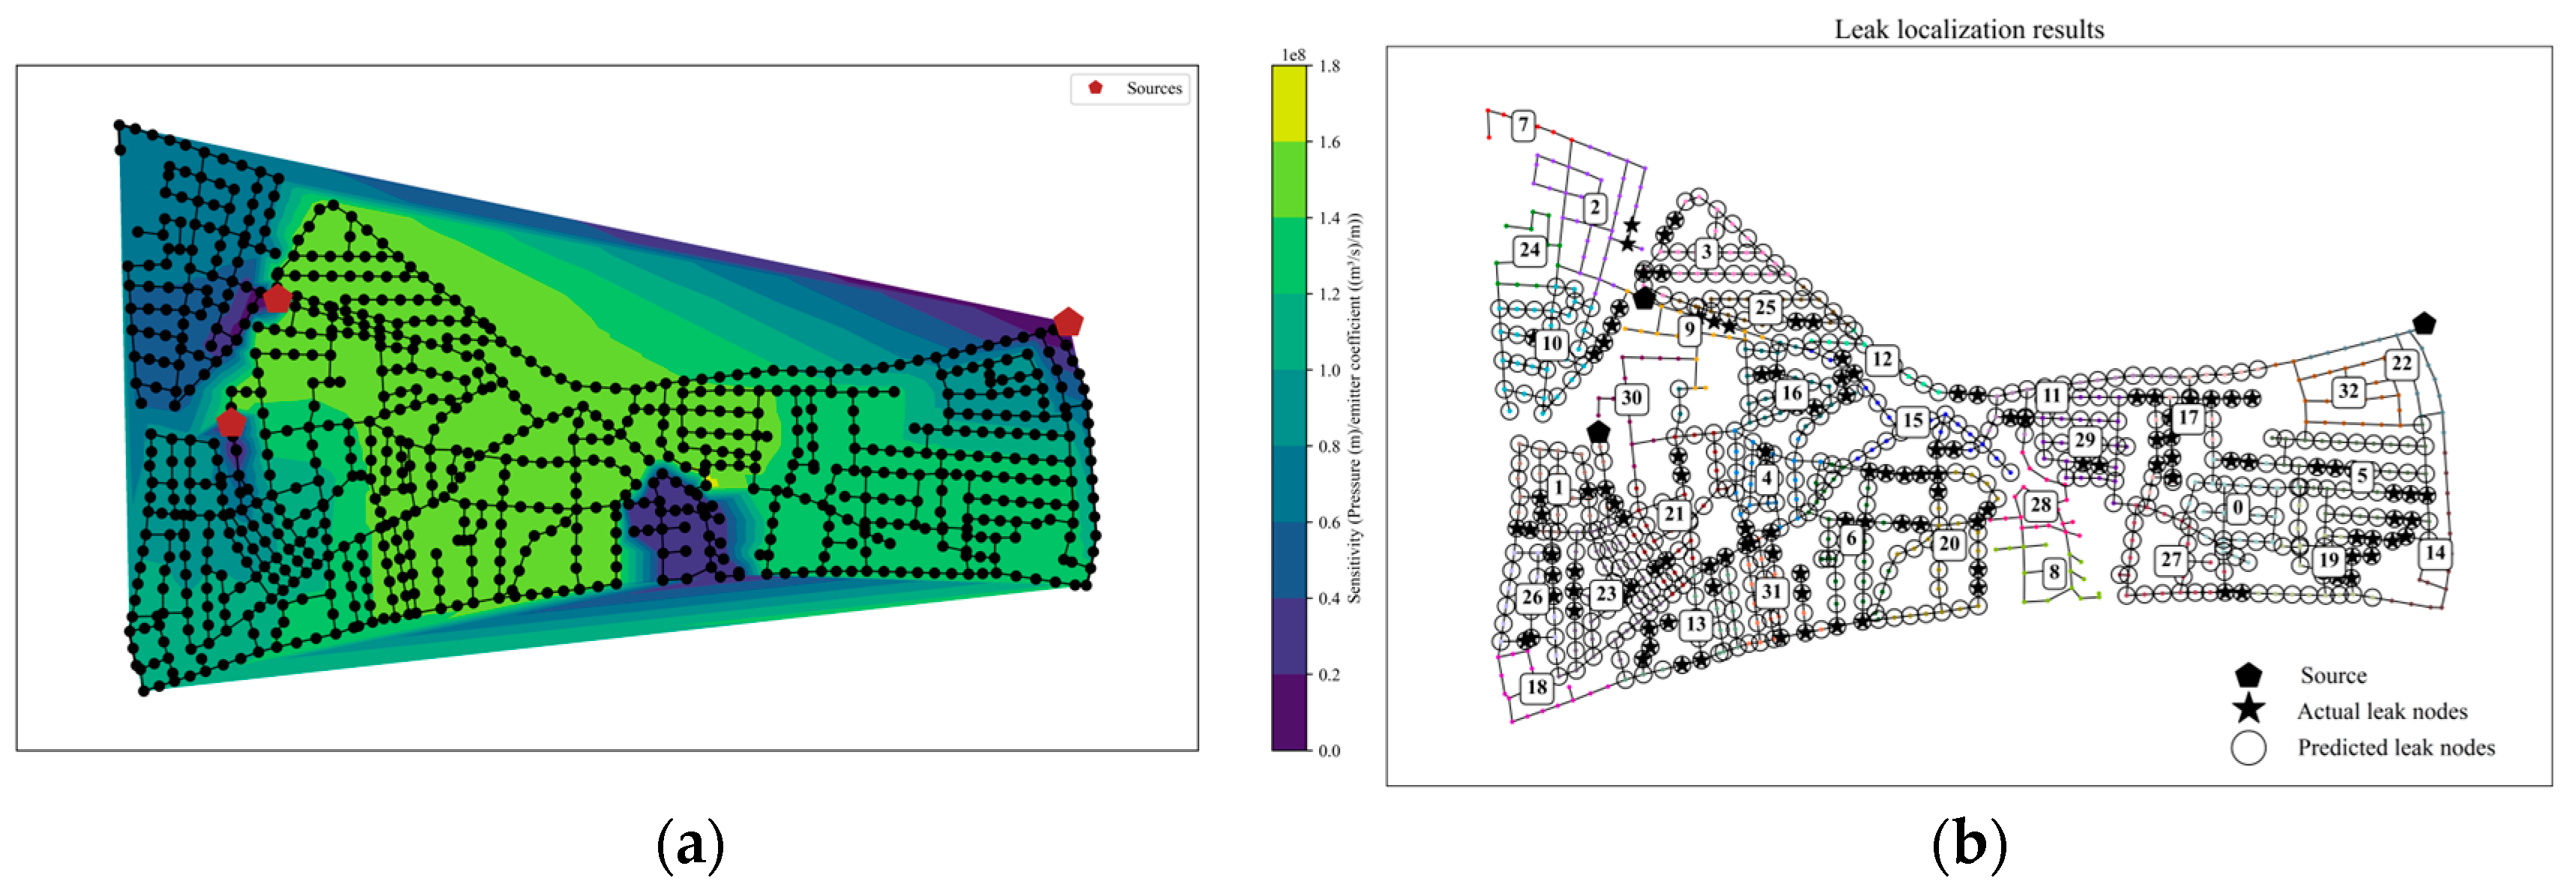
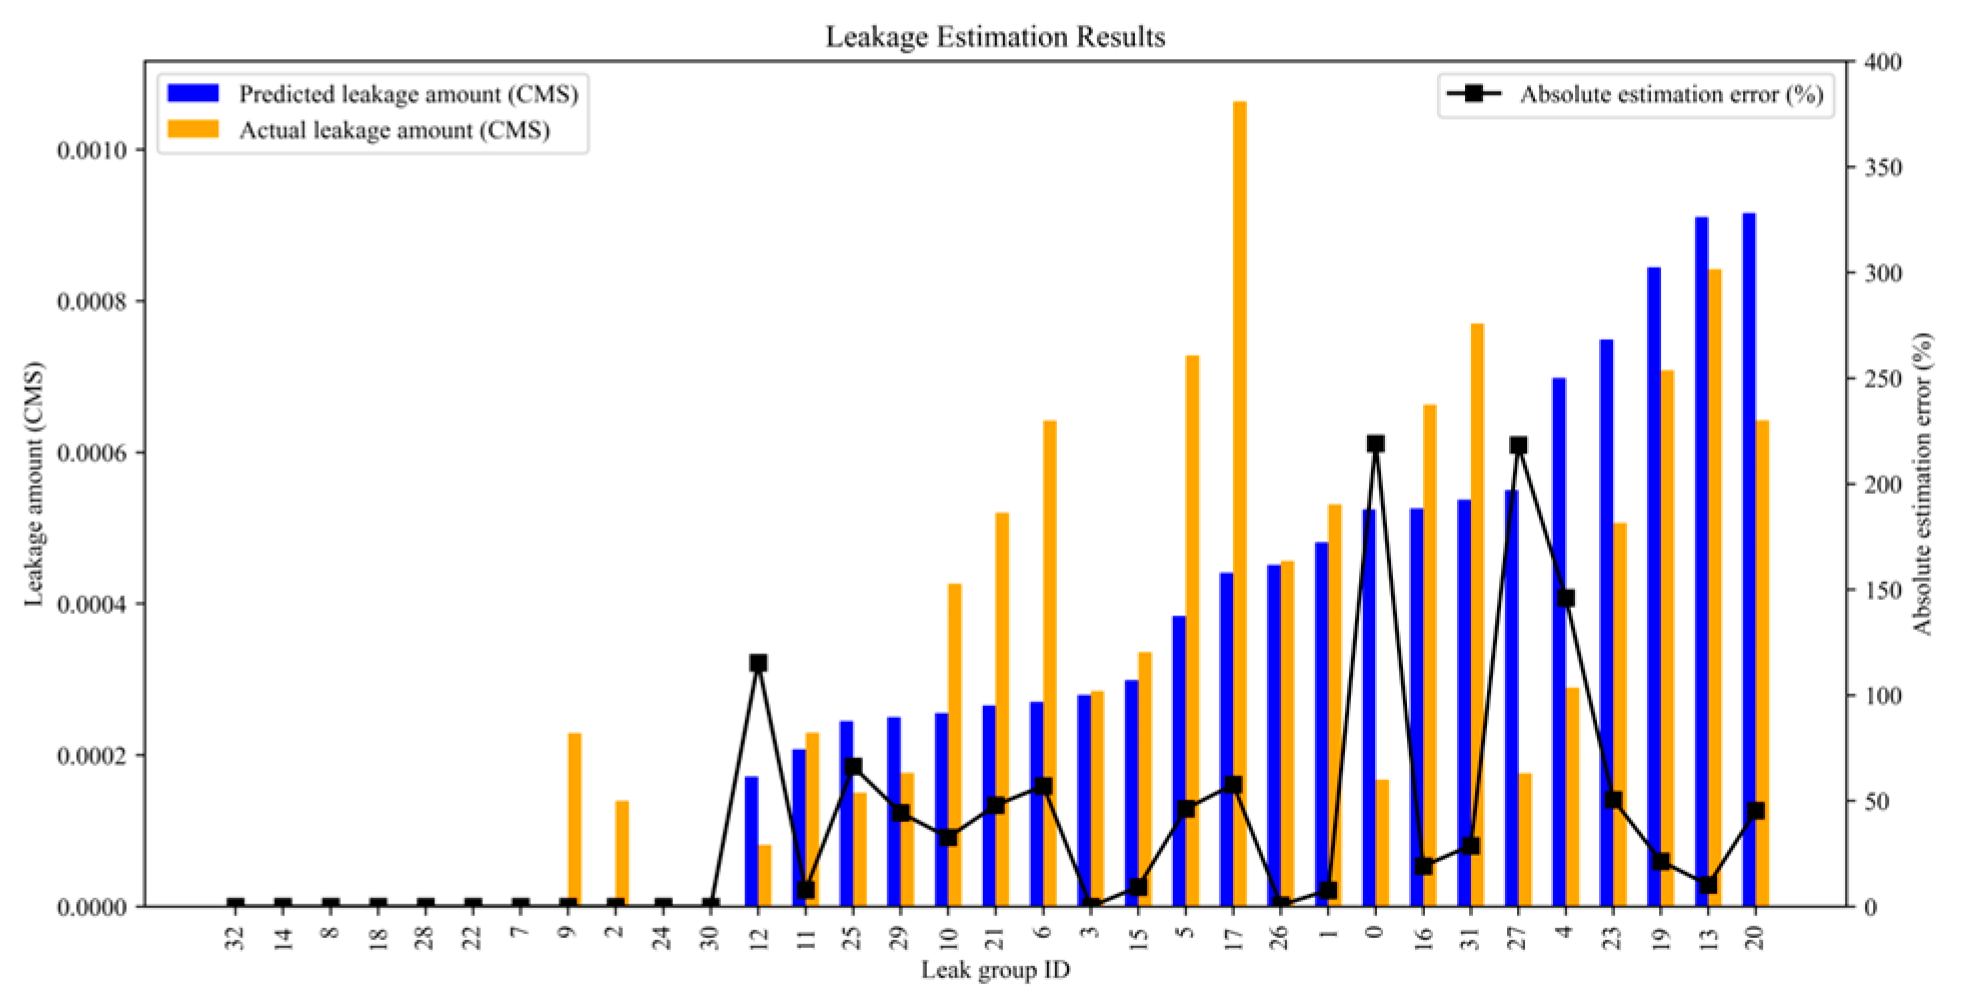
4. Results
5. Conclusions
Author Contributions
Funding
Institutional Review Board Statement
Informed Consent Statement
Data Availability Statement
Conflicts of Interest
References
- Levinas, D.; Perelman, G.; Ostfeld, A. Water leak localization using high-resolution pressure sensors. Water 2021, 13, 591. [Google Scholar] [CrossRef]
- Rajakumar, A.G.; Cornelio, A.A.; Mohan Kumar, M.S. Leak management in district metered areas with internal pressure reducing valves. Urban Water J. 2020, 17, 714–722. [Google Scholar] [CrossRef]
- Wan, X.; Kuhanestani, P.K.; Farmani, R.; Keedwell, E. Literature review of data analytics for leak detection in water distribution networks: A focus on pressure and flow smart sensors. J. Water Resour. Plan. Manag. 2022, 148, 03122002. [Google Scholar] [CrossRef]
- Romero-Ben, L.; Alves, D.; Blesa, J.; Cembrano, G.; Puig, V.; Duviella, E. Leak detection and localization in water distribution networks: Review and perspective. Annu. Rev. Control 2023, 55, 392–419. [Google Scholar] [CrossRef]
- Greyvenstein, B.; Van Zyl, J.E. An experimental investigation into the pressure-leakage relationship of some failed water pipes. J. Water Supply Res. Technol.—AQUA 2007, 56, 117–124. [Google Scholar] [CrossRef]
- Morosini, A.F.; Costanzo, F.; Veltri, P.; Savić, D. Identification of measurement points for calibration of water distribution network models. Procedia Eng. 2014, 89, 693–701. [Google Scholar] [CrossRef]
- Fang, Q.; Zhao, H.; Xie, C.; Chen, T. A method for water supply network DMA partitioning planning based on improved spectral clustering. Water Supply 2023, 23, 3432–3452. [Google Scholar] [CrossRef]
- Pedregosa, F.; Varoquaux, G.; Gramfort, A.; Michel, V.; Thirion, B.; Grisel, O.; Duchesnay, É. Scikit-learn: Machine learning in Python. J. Mach. Learn. Res. 2011, 12, 2825–2830. [Google Scholar]
- Vrachimis, S.G.; Kyriakou, M.S. LeakDB: A benchmark dataset for leakage diagnosis in water distribution networks. WDSA/CCWI Jt. Conf. Proc. 2018, 1, 146–153. [Google Scholar]
Disclaimer/Publisher’s Note: The statements, opinions and data contained in all publications are solely those of the individual author(s) and contributor(s) and not of MDPI and/or the editor(s). MDPI and/or the editor(s) disclaim responsibility for any injury to people or property resulting from any ideas, methods, instructions or products referred to in the content. |
© 2024 by the authors. Licensee MDPI, Basel, Switzerland. This article is an open access article distributed under the terms and conditions of the Creative Commons Attribution (CC BY) license (https://creativecommons.org/licenses/by/4.0/).
Share and Cite
Bandreddi, R.; Farmani, R. Area Leakage Estimation in Water Distribution Systems: A Focus on Background Leakage. Eng. Proc. 2024, 69, 166. https://doi.org/10.3390/engproc2024069166
Bandreddi R, Farmani R. Area Leakage Estimation in Water Distribution Systems: A Focus on Background Leakage. Engineering Proceedings. 2024; 69(1):166. https://doi.org/10.3390/engproc2024069166
Chicago/Turabian StyleBandreddi, Raghavarshith, and Raziyeh Farmani. 2024. "Area Leakage Estimation in Water Distribution Systems: A Focus on Background Leakage" Engineering Proceedings 69, no. 1: 166. https://doi.org/10.3390/engproc2024069166
APA StyleBandreddi, R., & Farmani, R. (2024). Area Leakage Estimation in Water Distribution Systems: A Focus on Background Leakage. Engineering Proceedings, 69(1), 166. https://doi.org/10.3390/engproc2024069166