Abstract
Understanding the residential end uses of water is helpful for the sustainable management of water resources and the implementation of water conservation strategies. In this study, over one hundred studies were systematically reviewed to provide a comprehensive overview of the state-of-the-art research on end-use water consumption. Each study was reviewed, clustered, and subjected to a multilevel analysis aimed at quantitatively comparing the characteristics of the end uses of water available in the literature. The findings of this work support water utilities, researchers, policy makers, and consumers in identifying the key aspects of water end uses and exploring their main features across different geographical, socioeconomic, and cultural regions of the world.
1. Introduction
The growing population and urbanization are hampering water security in urban areas, with the effects of climate change further compounding water shortages [1]. Accurate estimations of water consumption are essential for identifying effective water supply and demand management strategies and ensure urban water systems’ capability to cope with changing water demand and availability [2]. With the growing interest in water demand, many studies have been conducted to investigate the characteristics of residential water consumption on different spatiotemporal scales [3]. Thanks to the introduction of smart meters and paired technology, increasing attention has recently been devoted to the analysis of water consumption characteristics at fine spatiotemporal resolutions, i.e., at the end-use scale (e.g., shower, toilet, tap) and with sampling frequencies of up to 1 s [4].
Taking a cue from recent research [5], this paper provides a brief overview of the state-of-art research on the residential end uses of water. Over one hundred studies conducted globally were reviewed, clustered, and subjected to a multilevel analysis including a quantitative discussion of the most widespread metrics available in the literature for the characterization of the residential end uses of water.
2. Materials and Methods
2.1. Literature Review and Water End-Use Database (EUD) Clustering
A systematic search of peer-reviewed journal papers, water utility reports, and other grey literature material (theses, research projects, presentations) was preliminarily carried out to explore the current state of the research on residential water consumption at the end-use level. The final materials retained for the following analysis include a total of 114 studies presenting or analyzing residential water consumption data at the end-use level (residential end-use studies, REUSs) and 66 different related end-use databases (EUDs).
EUDs were first reviewed and clustered based on (1) location; (2) period; (3) temporal data resolution (if available); and (4) approach adopted to obtain end-use data (i.e. end-use data source). To standardize the analysis, EUDs were clustered based on the information reported in their related REUSs, as most EUDs were not publicly available.
2.2. EUD Comparison through Multilevel Analysis
Clustered EUDs were systematically compared by applying a multilevel analysis aimed at exploring the characteristics of end-use water consumption from several points of view, discovering similarities and differences among EUDs. The multilevel analysis included investigation at three key levels: (Level 1) daily per capita average end-use water consumption (liters per person per day, L/p/d); (Level 2) average values of end-use parameters such as volume per use (L/use), duration per use (min/use), flow rate per use (L/min), and daily per capita frequency of use (uses/p/d); and (Level 3) end-use daily profiles (i.e., standardized daily distributions of end-use water consumption).
Overall, the following end-use categories of indoor residential water consumption were considered in the analyses: dishwasher (D), washing machine (W), shower (S), bathtub (B), toilet flusher (F), and tap (T).
3. Results and Discussion
3.1. EUD Clustering
The results of EUD clustering in Figure 1 show that (1) REUSs have been conducted across all five continents, but mainly in the Americas, Europe, and Oceania (Figure 1a), revealing a linkage between the number of EUDs and the level of water-utility digitalization; (2) the majority of REUSs have been carried out since the 2000s (Figure 1b) because of the diffusion of smart metering technologies, whereas developing countries have undergone REUSs only in the last fifteen years; (3) different temporal data resolutions are observed, but most EUDs have relied on data collected with very fine resolution (i.e., 1–10 s; Figure 1c), which generally allowed end-use disaggregation and classification to be performed with acceptable accuracy; and (4) end-use disaggregation and classification methods have been the most-adopted techniques to obtain end-use data (Figure 1d), but a relevant number of EUDs were created through direct measurements (i.e., by installing water meter for each end use) or through interactions with the users (e.g., surveys and questionnaires aimed at collecting information about end-use water consumption).
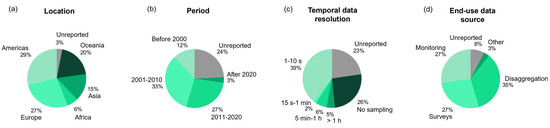
Figure 1.
EUD clustering results based on (a) location; (b) period; (c) temporal data resolution; and (d) end-use data source.
3.2. EUD Comparison through Multilevel Analysis
The results of the EUD multi-level analysis revealed that
- The average daily per capita water consumption data (Level 1) are reported in the literature for at least one end-use category in about 80% of EUDs. Overall, the highest values are related to showers (44 L/p/d), toilets (38 L/p/d), and taps (33 L/p/d), followed by washing machines (29 L/p/d), bathtubs (10 L/p/d), and dishwashers (3 L/p/d), as shown in Figure 2a. This finding suggests that most indoor residential water consumption is primarily tied to the use of water for personal hygiene.
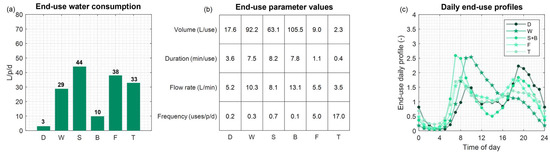 Figure 2. Multilevel analysis results: (a) daily per capita average end-use water consumption (Level 1); (b) end-use parameters (average values) (Level 2); and (c) daily end-use profiles (Level 3).
 - The average values of end-use parameters (Level 2) are available for at least one end-use category in nearly 70% of EUDs. The analysis (Figure 2b) revealed that, on average, the largest volumes per use are related to bathtubs, washing machines, and showers (106, 93, and 63 L/use, respectively), which also were used for the longest durations (i.e., 7.8, 7.5, and 8.2 min/use) and had the greatest flow rates (13.1, 10.3, and 8.1 L/min). Additionally, the frequencies of use range from a minimum of about 0.1 uses/p/d in the case of bathtubs (which are typically used only occasionally) to a maximum of about 5 in the case of toilets and 17 uses/p/d in the case of taps.
- Daily end-use profiles (Level 3) are available for about 30% of EUDs. Overall, different daily patterns emerge based on the end use (Figure 2c). On average, smaller daily fluctuations are observed in the case of toilets and taps—which are typically used almost constantly during the day—whereas more heterogeneous profiles emerge for other end uses. This finding is mainly evident in the case of showers and bathtubs (which are mostly used in the early morning and evening) but also dishwashers (which are generally activated after mealtimes) and washing machines (their average profile is characterized by a single peak in the morning).
4. Conclusions
A comprehensive overview of the state-of-the-art research in the field of residential water consumption at the end-use level was presented.
The analyses revealed that the literature is rich in studies evaluating daily per capita average end-use water consumption and the average values of end-use parameters (Levels 1–2), whereas fewer studies have investigated daily water end-use profiles (Level 3).
The numerical findings of this study can support water utilities, practitioners, water consumers, and researchers in (1) gaining knowledge about the main features of the residential end uses of water across different contexts worldwide; (2) developing and validating water demand models, end-use disaggregation and classification methods, and water conservation technologies; and (3) introducing strategies for the more efficient management of water resources and the more sustainable use of water.
Author Contributions
Conceptualization, F.M., S.A., M.B., S.B., A.C. (Andrea Castelletti), A.C. (Andrea Cominola), M.-P.G., H.E.J., P.M., D.B.S., R.A.S., A.S.S., V.T., V.-H.A.Y. and M.F.; methodology, S.A., M.B., S.B., A.C. (Andrea Castelletti), A.C. (Andrea Cominola), H.E.J., P.M., D.B.S., R.A.S., A.S.S., V.T., V.-H.A.Y. and M.F.; software, F.M. and M.-P.G.; validation, F.M. and S.A.; formal analysis, F.M. and S.A.; investigation, F.M. and S.A.; resources, F.M., S.A., M.-P.G., M.B. and A.C. (Andrea Cominola); data curation, F.M., S.A., M.B., M.-P.G. and A.C. (Andrea Cominola); writing—original draft preparation, F.M.; writing—review and editing, F.M., S.A., M.B., S.B., A.C. (Andrea Castelletti), A.C. (Andrea Cominola), M.-P.G., H.E.J., P.M., D.B.S., R.A.S., A.S.S., V.T., V.-H.A.Y. and M.F.; visualization, F.M. and S.A.; supervision, S.A., M.B., S.B., A.C. (Andrea Castelletti), A.C. (Andrea Cominola), H.E.J., P.M., D.B.S., R.A.S., A.S.S., V.T., V.-H.A.Y. and M.F.; project administration, S.A. and M.F. All authors have read and agreed to the published version of the manuscript.
Funding
This research received no external funding.
Institutional Review Board Statement
Not applicable.
Informed Consent Statement
Not applicable.
Data Availability Statement
Dataset available upon request from the authors.
Conflicts of Interest
Author Peter Mayer was employed by the company Water Demand Management LLC. The remaining authors declare that the research was conducted in the absence of any commercial or financial relationships that could be construed as a potential conflict of interest.
References
- Sønderlund, A.L.; Smith, J.R.; Hutton, C.J.; Kapelan, Z.; Savic, D. Effectiveness of smart meter-based consumption feedback in curbing household water use: Knowns and unknowns. J. Water Resour. Plann. Manag. 2016, 142, 04016060. [Google Scholar] [CrossRef]
- Cardell-Oliver, R.; Wang, J.; Gigney, H. Smart meter analytics to pinpoint opportunities for reducing household water use. J. Water Resour. Plann. Manag. 2016, 142, 04016007. [Google Scholar] [CrossRef]
- Mazzoni, F.; Alvisi, S.; Franchini, M.; Ferraris, M.; Kapelan, Z. Automated Household Water End-Use Disaggregation through Rule-Based Methodology. J. Water Resour. Plan. Manag. 2021, 147, 04021024. [Google Scholar] [CrossRef]
- Cominola, A.; Giuliani, M.; Piga, D.; Castelletti, A.; Rizzoli, A.E. Benefits and challenges of using smart meters for advancing residential water demand modeling and management: A review. Environ. Model. Softw. 2015, 72, 198–214. [Google Scholar] [CrossRef]
- Mazzoni, F.; Alvisi, S.; Blokker, M.; Buchberger, S.G.; Castelletti, A.; Cominola, A.; Gross, M.-P.; Jacobs, H.E.; Mayer, P.; Steffelbauer, D.B.; et al. Investigating the characteristics of residential end uses of water: A worldwide review. Water Res. 2023, 230, 119500. [Google Scholar] [CrossRef] [PubMed]
Disclaimer/Publisher’s Note: The statements, opinions and data contained in all publications are solely those of the individual author(s) and contributor(s) and not of MDPI and/or the editor(s). MDPI and/or the editor(s) disclaim responsibility for any injury to people or property resulting from any ideas, methods, instructions or products referred to in the content. |
© 2024 by the authors. Licensee MDPI, Basel, Switzerland. This article is an open access article distributed under the terms and conditions of the Creative Commons Attribution (CC BY) license (https://creativecommons.org/licenses/by/4.0/).