Abstract
The primary objective of this research is to quantify the land surface temperature (LST) across different seasons in the Babylon Governorate for the year 2022. Utilizing data from LANDSAT 8, the study focuses on three key spectral bands: thermal, red, and near-infrared (NIR) bands. The spatial distribution maps of LST are generated for winter, spring, summer, and autumn, and descriptive statistics are employed to characterize the LST features for each seasonal map. The findings reveal a significant seasonal variation in LST. Specifically, the maximum temperature recorded in summer is approximately three times higher than that recorded in winter, with a difference of nearly 46 C. Conversely, the minimum temperature varies from 18 C in summer to approximately 4.5 C in winter.
1. Introduction
Land surface temperature (LST) serves as an indicator of the Earth’s “skin” temperature and plays a pivotal role in regional and global land surface processes [1,2]. Its significance extends to various applications, including agriculture [3], hydrology [4], urban climate, and the urban heat island (UHI) effect [5]. Traditional ground-based station measurements are inadequate to capture the LST across large areas due to their rapid variations on both geographical and temporal scales. Remote sensing imagery offers a superior alternative to obtain high-resolution LST data [6]. Previous research has explored the relationship between LST and the normalized difference vegetation index (NDVI), as well as the normalized difference built-up index (NDBI), in the Karbala Governorate for the years 2013, 2015, and 2017. A linear correlation was found between increased built-up areas and elevated LST values, whereas areas with more vegetation exhibited lower LST values [7]. The primary focus of this paper is the analysis of the spatial distribution of LST in the Babylon Governorate across the four seasons of 2022 and examination of the characteristics of LST for each season. The paper is organized as follows. Section 1 presents the study area, followed by a description of the dataset and methodology in Section 2. Section 3 outlines the key equations used for extraction of LST from Landsat thermal bands. Data reduction is summarized in Section 3. Section 4 and Section 5 discuss the results and analyses, respectively.
2. Methods
2.1. The Study Area
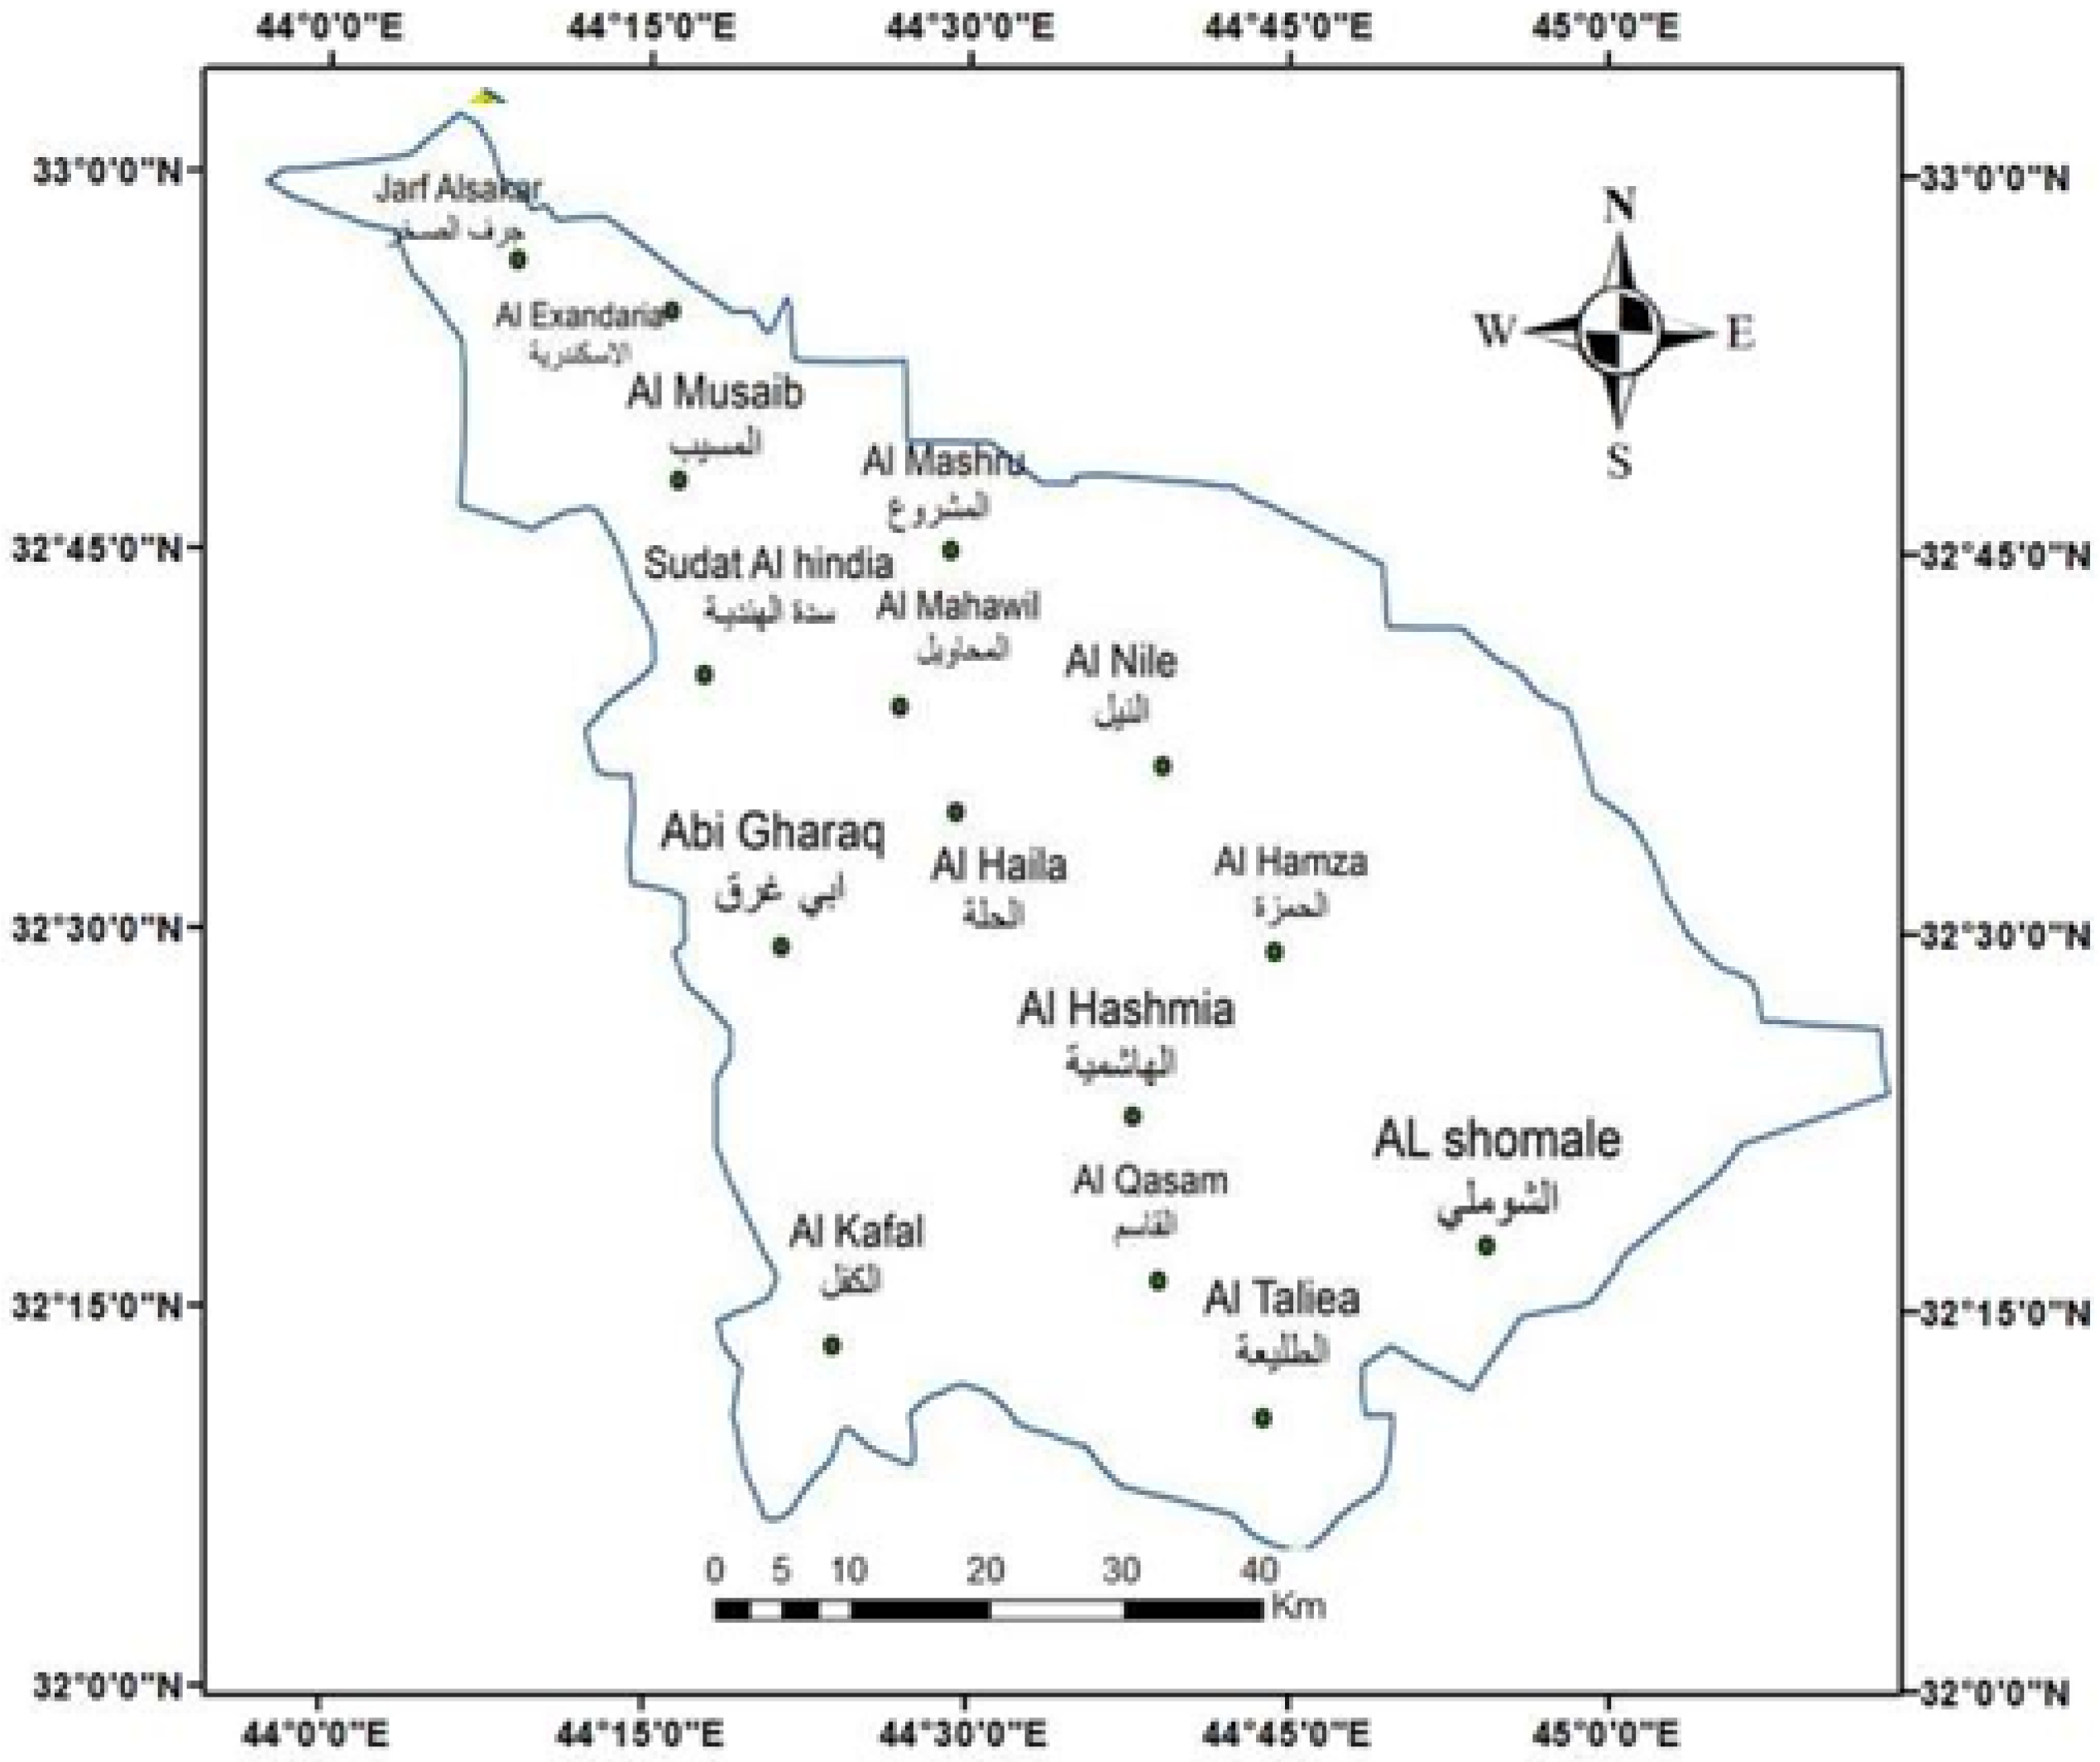
The focus of this research is the spatial distribution of land surface temperature (LST) in the Babylon Governorate. Geographically, Babylon is situated between latitudes N and N and longitudes E and E. As depicted in Figure 1, the governorate is centrally located within Iraq and has an elevation of approximately 37 m above sea level. Covering a total area of around 5119 km2, the region experiences a desert climate.
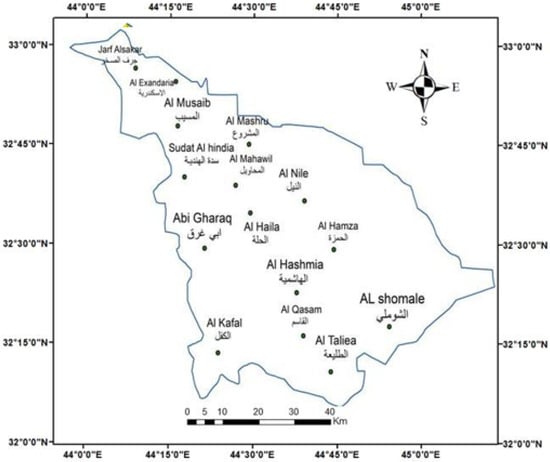
Figure 1.
Map of the Babylon Governorate highlighting important regions.
This climate is marked by low levels of precipitation and elevated temperatures, which can soar up to C during the summer months. The climate also remains relatively warm during the winter season. The peak temperatures are typically observed in July and August, while the lowest temperatures occur in December and January.
2.2. Dataset
The data for this study were sourced from the Landsat 8 Operational Land Imager (OLI) and Thermal Infrared Sensor (TIRS) datasets generated by the US Geological Survey. The data were obtained in GeoTIFF format, which is spatially labeled. Table 1 provides the data specifications for the OLI and TIRS sensors on Landsat 8. The Landsat 8 TIRS dataset includes two bands with thermal properties—specifically, bands 10 and 11. For data analysis and production of the final results, two software packages were utilized: ERDAS Imagine 9.1 for remote sensing and ArcGIS 9.3 for Geographic Information Systems (GIS).

Table 1.
Landsat 8 OLI and TIRS data specifications for Babylon city.
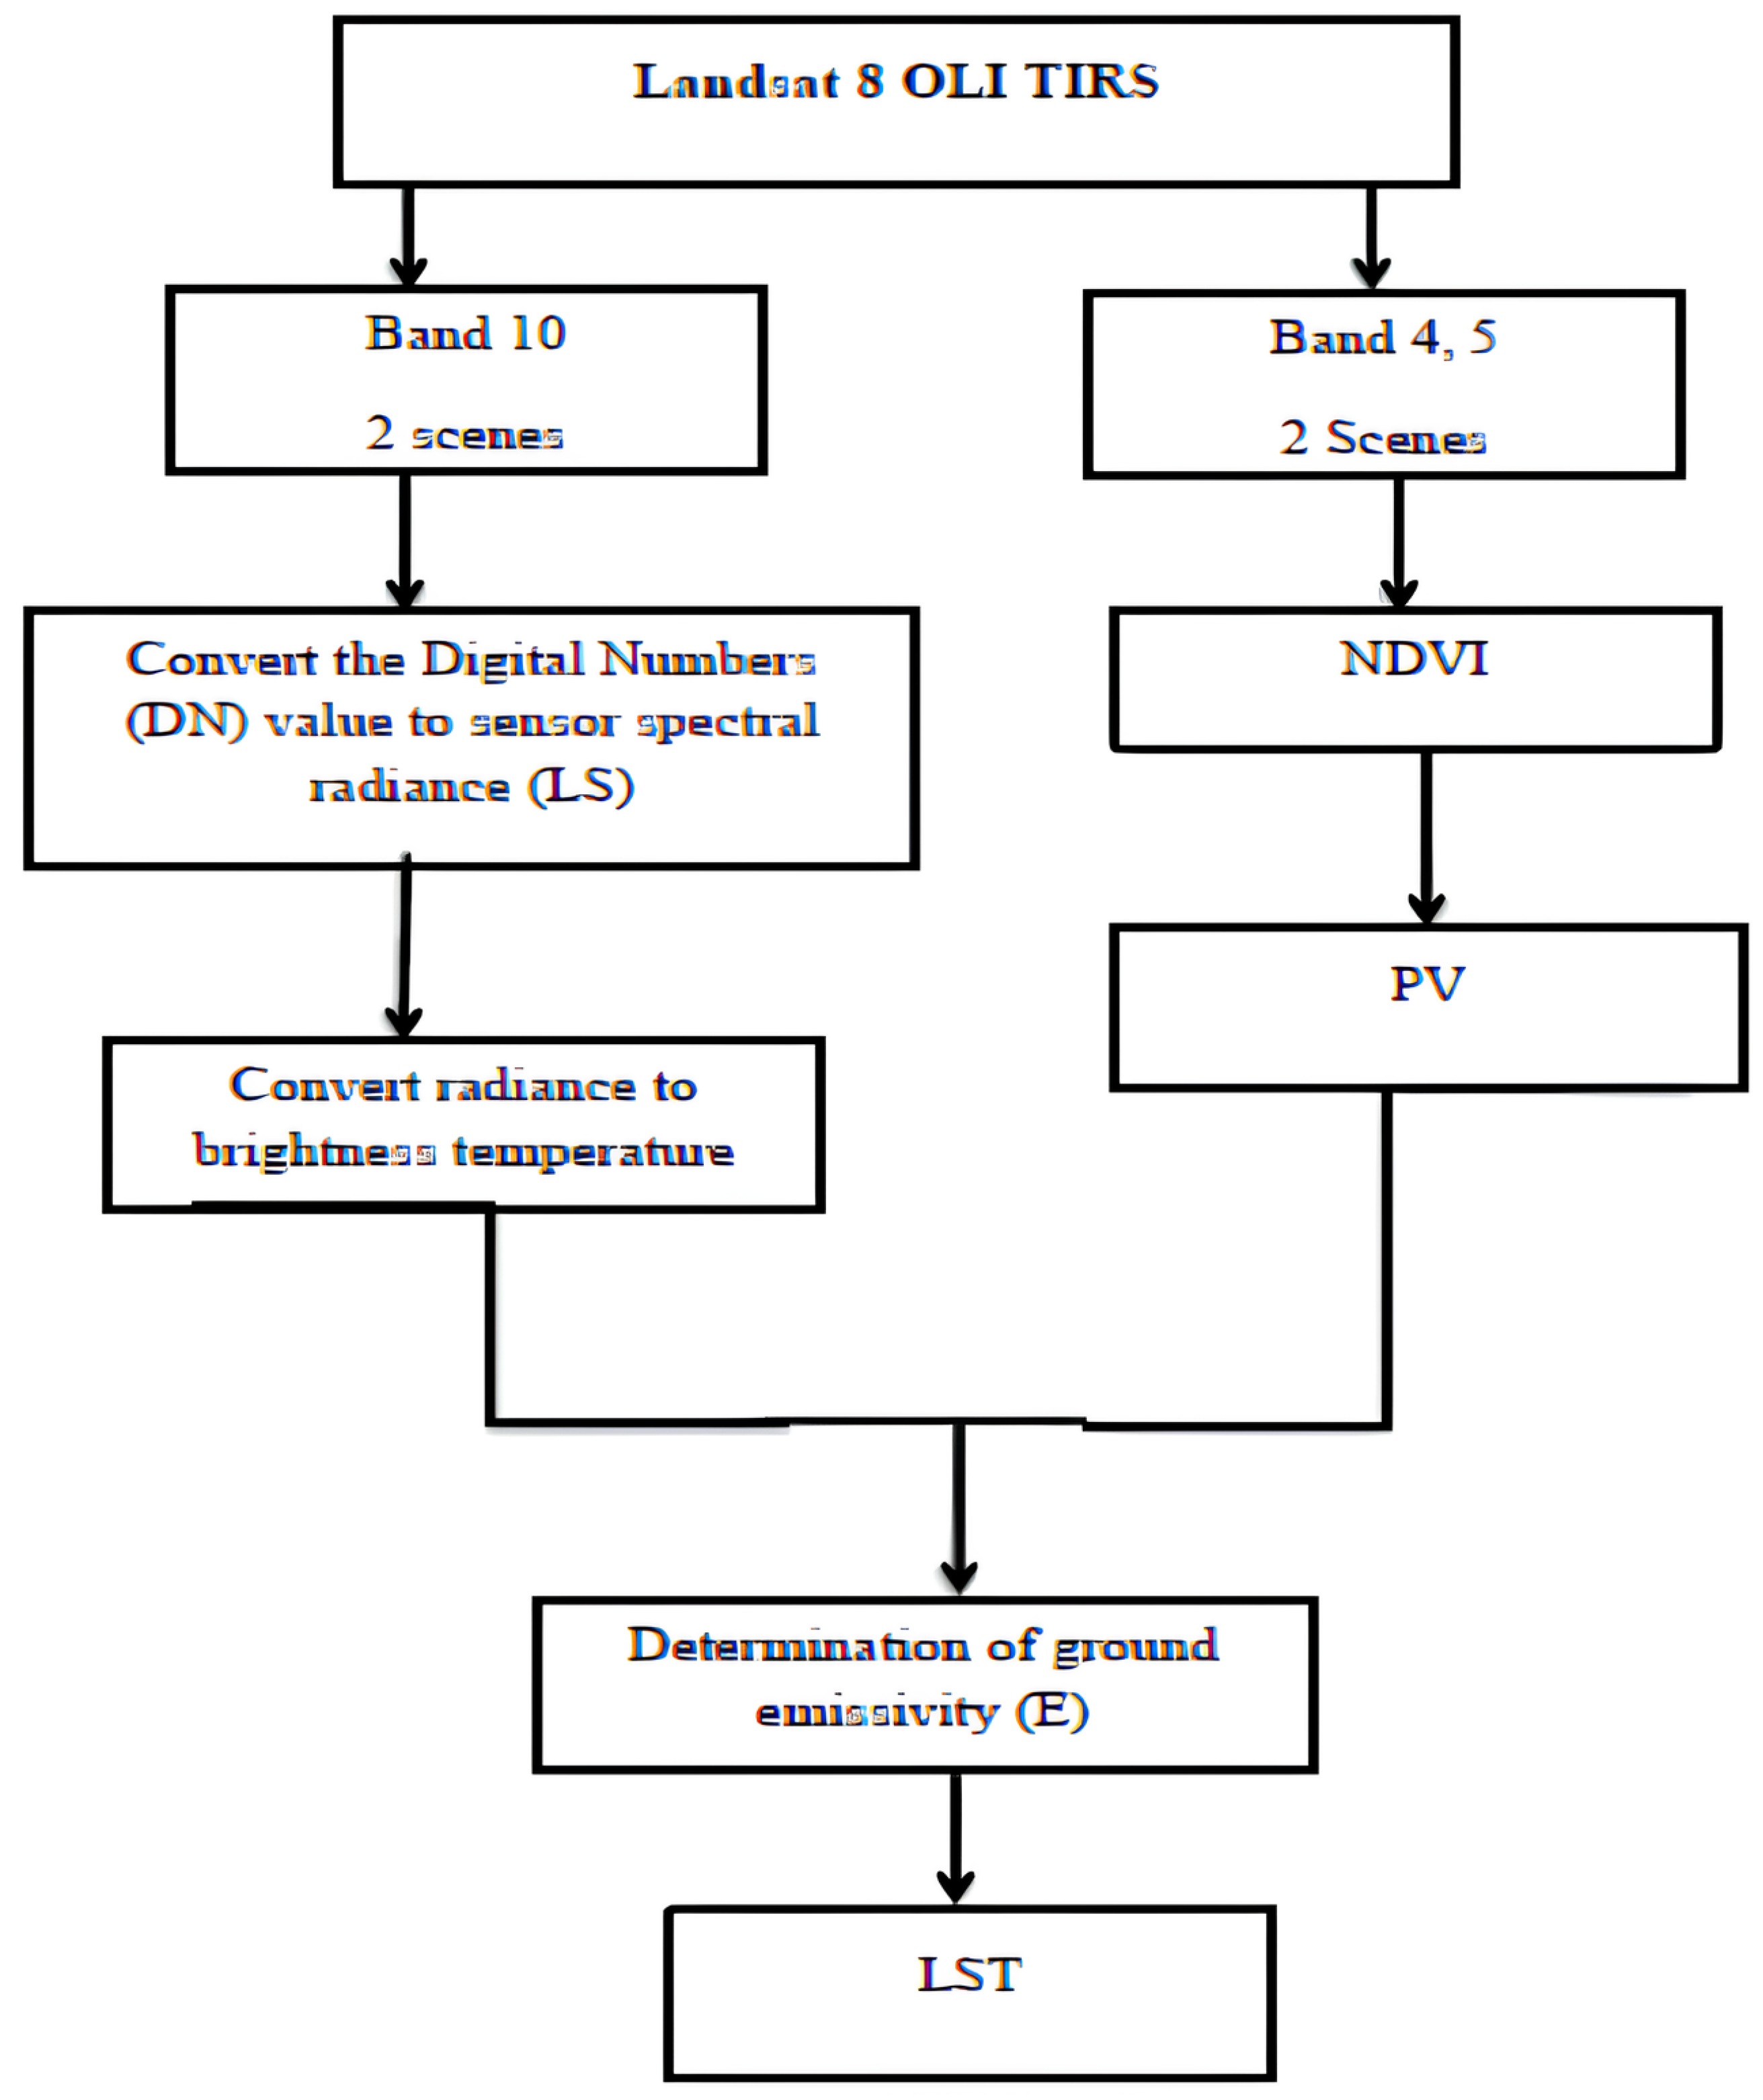
A flow chart illustrating the overall process of the current investigation is shown in Figure 2.
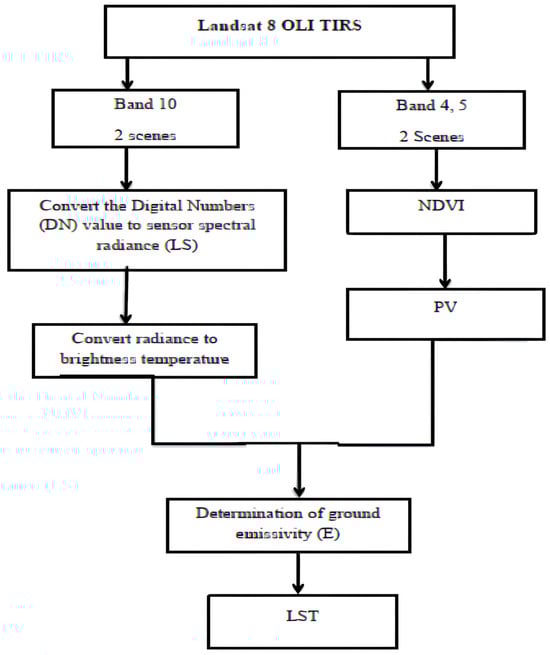
Figure 2.
Flow chart representing the methodology for each season in the present study.
3. LST Extraction from the Landsat Thermal Band
The extraction of land surface temperature (LST) from band 10 of the Landsat 8 OLI and TIRS images for Babylon city was performed using a specific algorithm [8]. The initial step involves calculating the spectral radiance () in WmSrmm using the following equation:
Subsequently, the spectral radiance is converted to brightness temperature () in Kelvin (K) using Planck’s Law and the calibration constants of Landsat 8 OLI ( and ) [9,10]:
The NDVI thresholds approach is employed to measure surface emissivity using the following equation [11]:
where is the near-infrared band, and is the red band.
The fractional vegetation () of each pixel is calculated using the NDVI [12]:
The emissivity (E) is then estimated based on the NDVI values using the following equation [11]:
Finally, the LST is derived using the following equation [13]:
where mm, J/K (Boltzmann constant), (Planck’s constant), and m/s (velocity of light in a vacuum).
Data Reductions
To comprehensively cover the city of Babylon, two scenes were downloaded for each band. One of the initial preprocessing steps involved clipping each band individually. Subsequently, the mosaic technique was employed to amalgamate pairs of images from each season, thereby generating a realistic representation of the study area. To enhance the quality of the satellite imagery, both geometric and radiometric adjustments were performed.
The thermal infrared bands (bands 10 and 11) in the Landsat 8 TIRS images have a spatial resolution of 100 m. To align these thermal bands with the optical bands, they were resampled to a 30 m pixel size using the nearest neighbor algorithm. These resampled data were then utilized for the determination of land surface temperature (LST).
4. Results
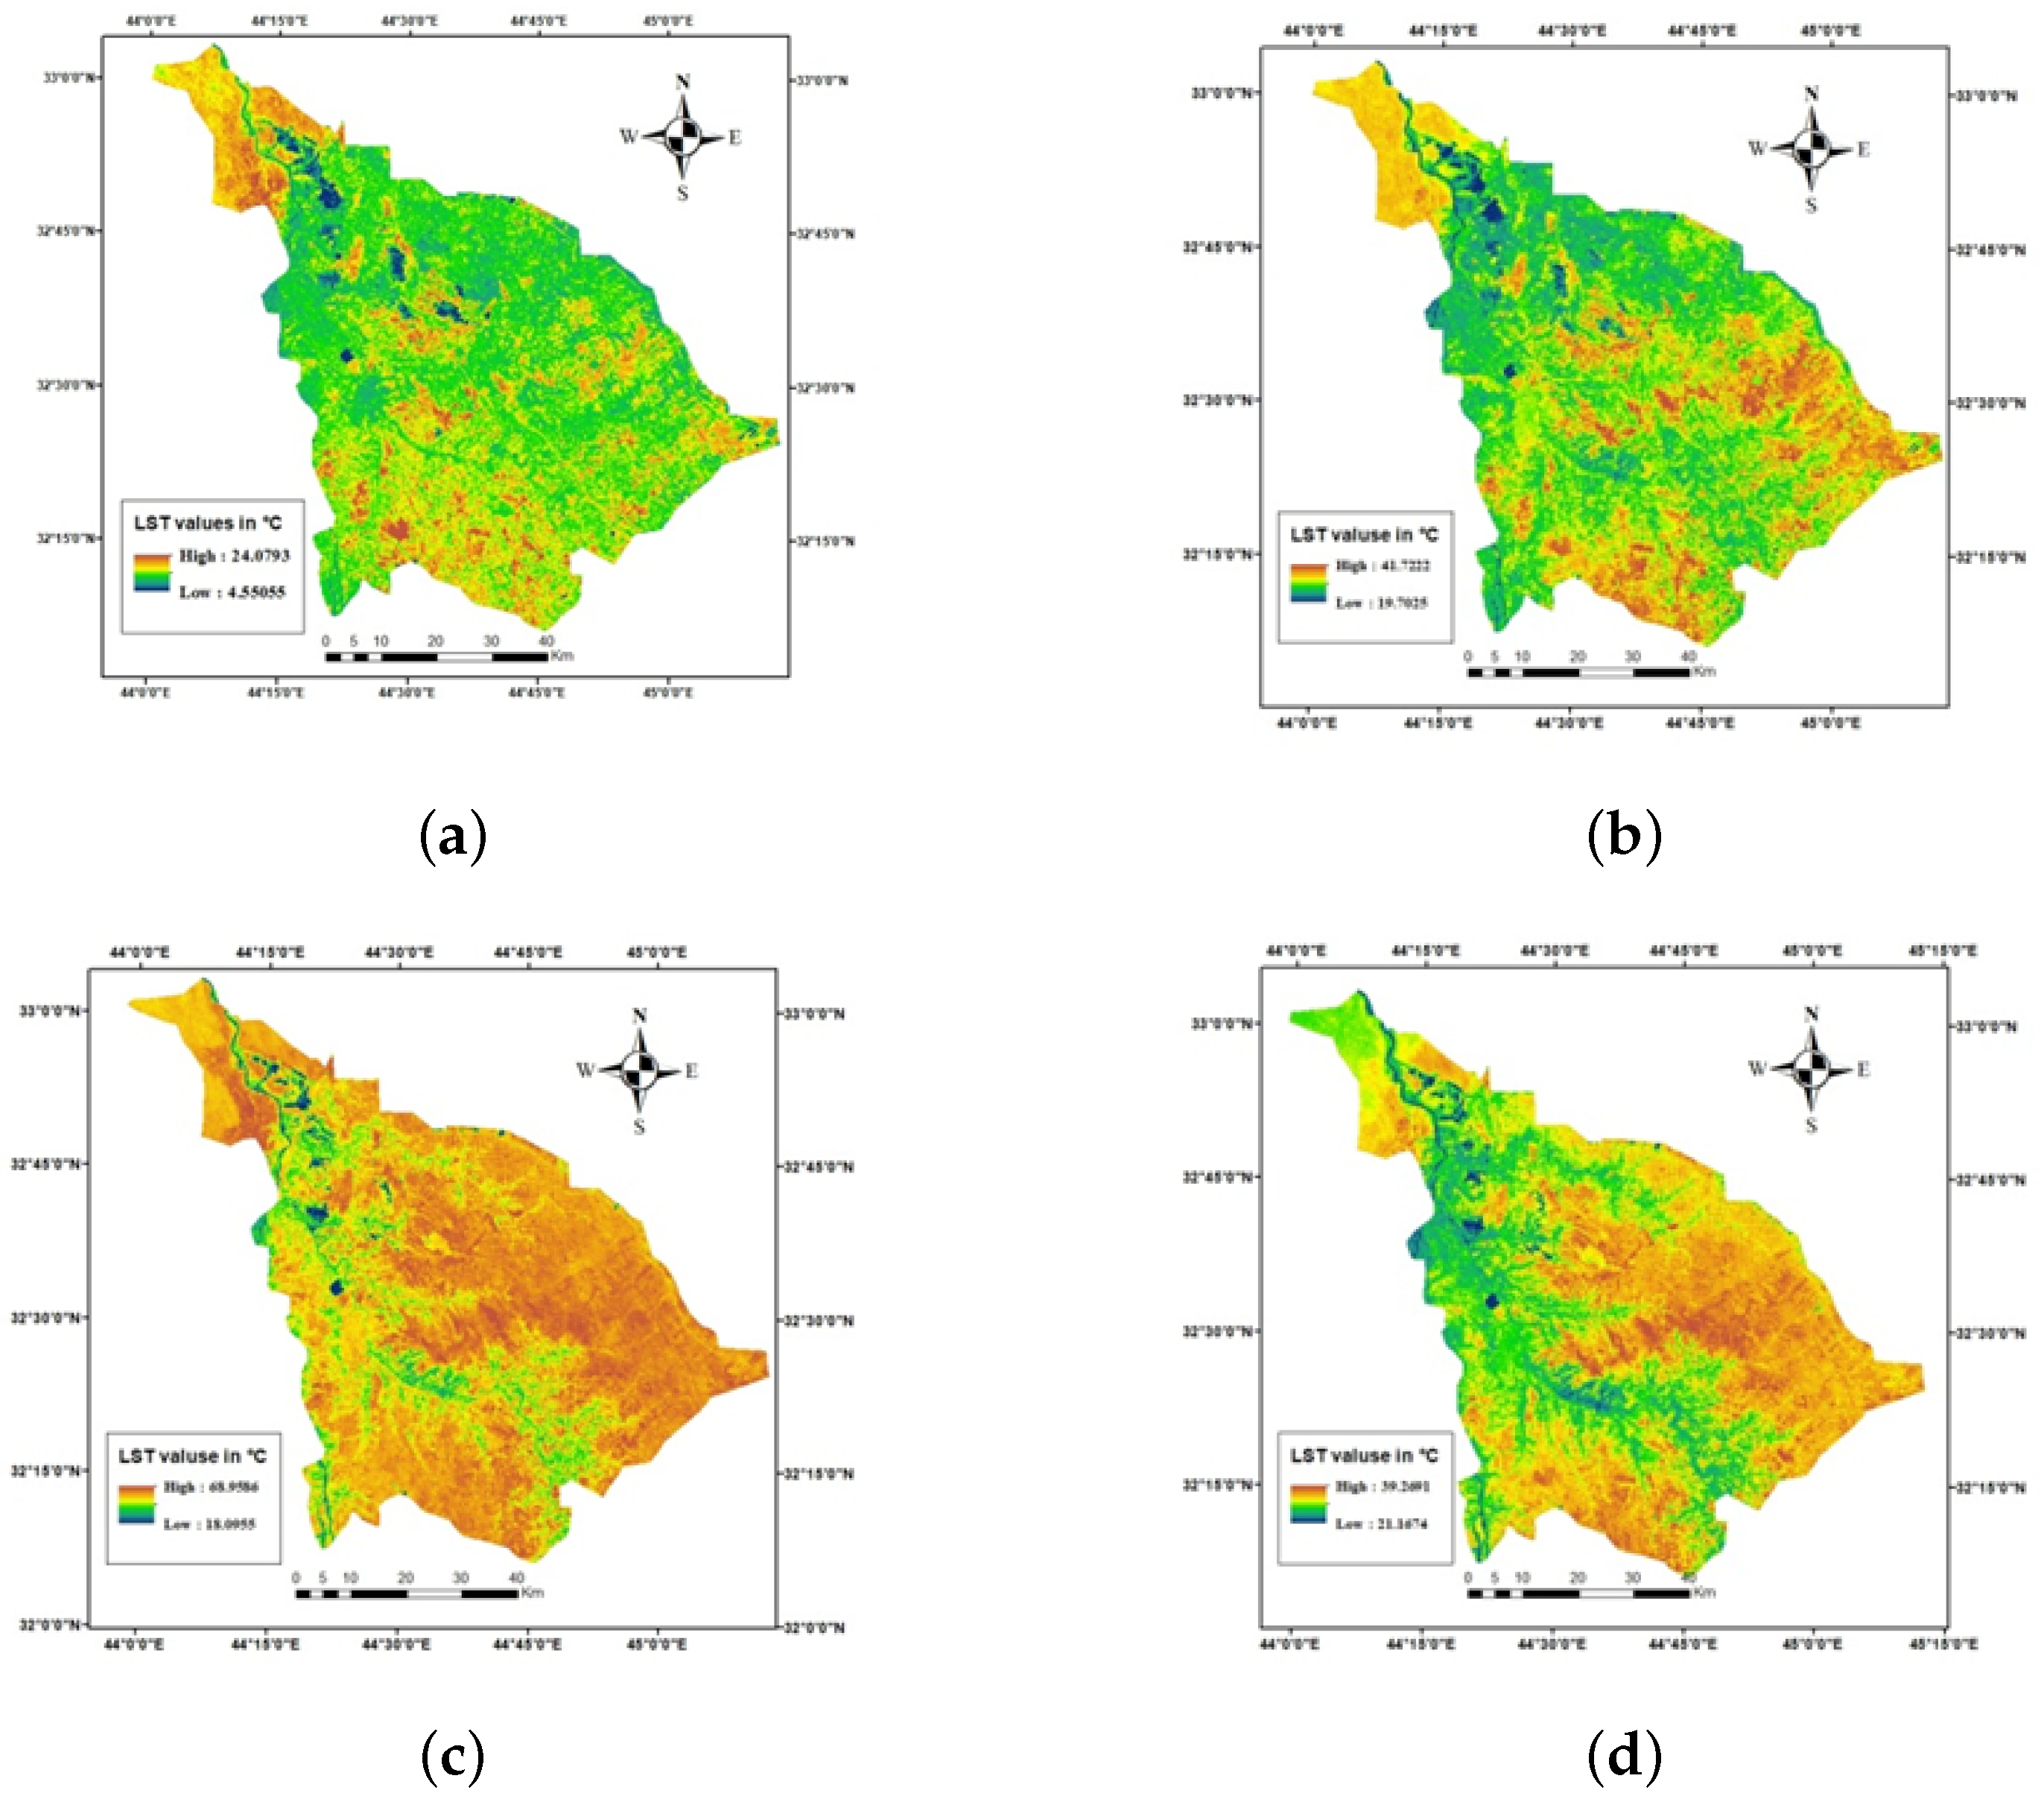
The land surface temperature (LST) was mapped for the Babylon Governorate across four seasons in the year 2022. Figure 3 illustrates these mappings, where panels (a, b, c, and d) depict the spatial distribution of LST in winter, spring, summer, and autumn, respectively. Descriptive statistics, including the minimum, maximum, mean, and standard deviation of LST for each season, are summarized in Table 2.
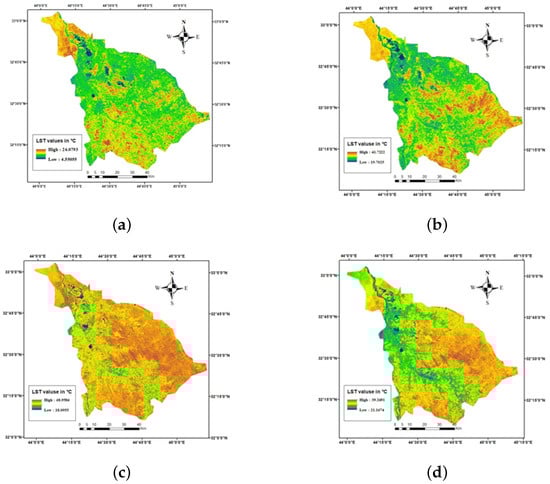
Figure 3.
LST distribution of Babylon Governorate across seasons: (a) winter; (b) spring; (c) summer; (d) autumn.
Table 2.
Descriptive statistics of LST for Babylon city.
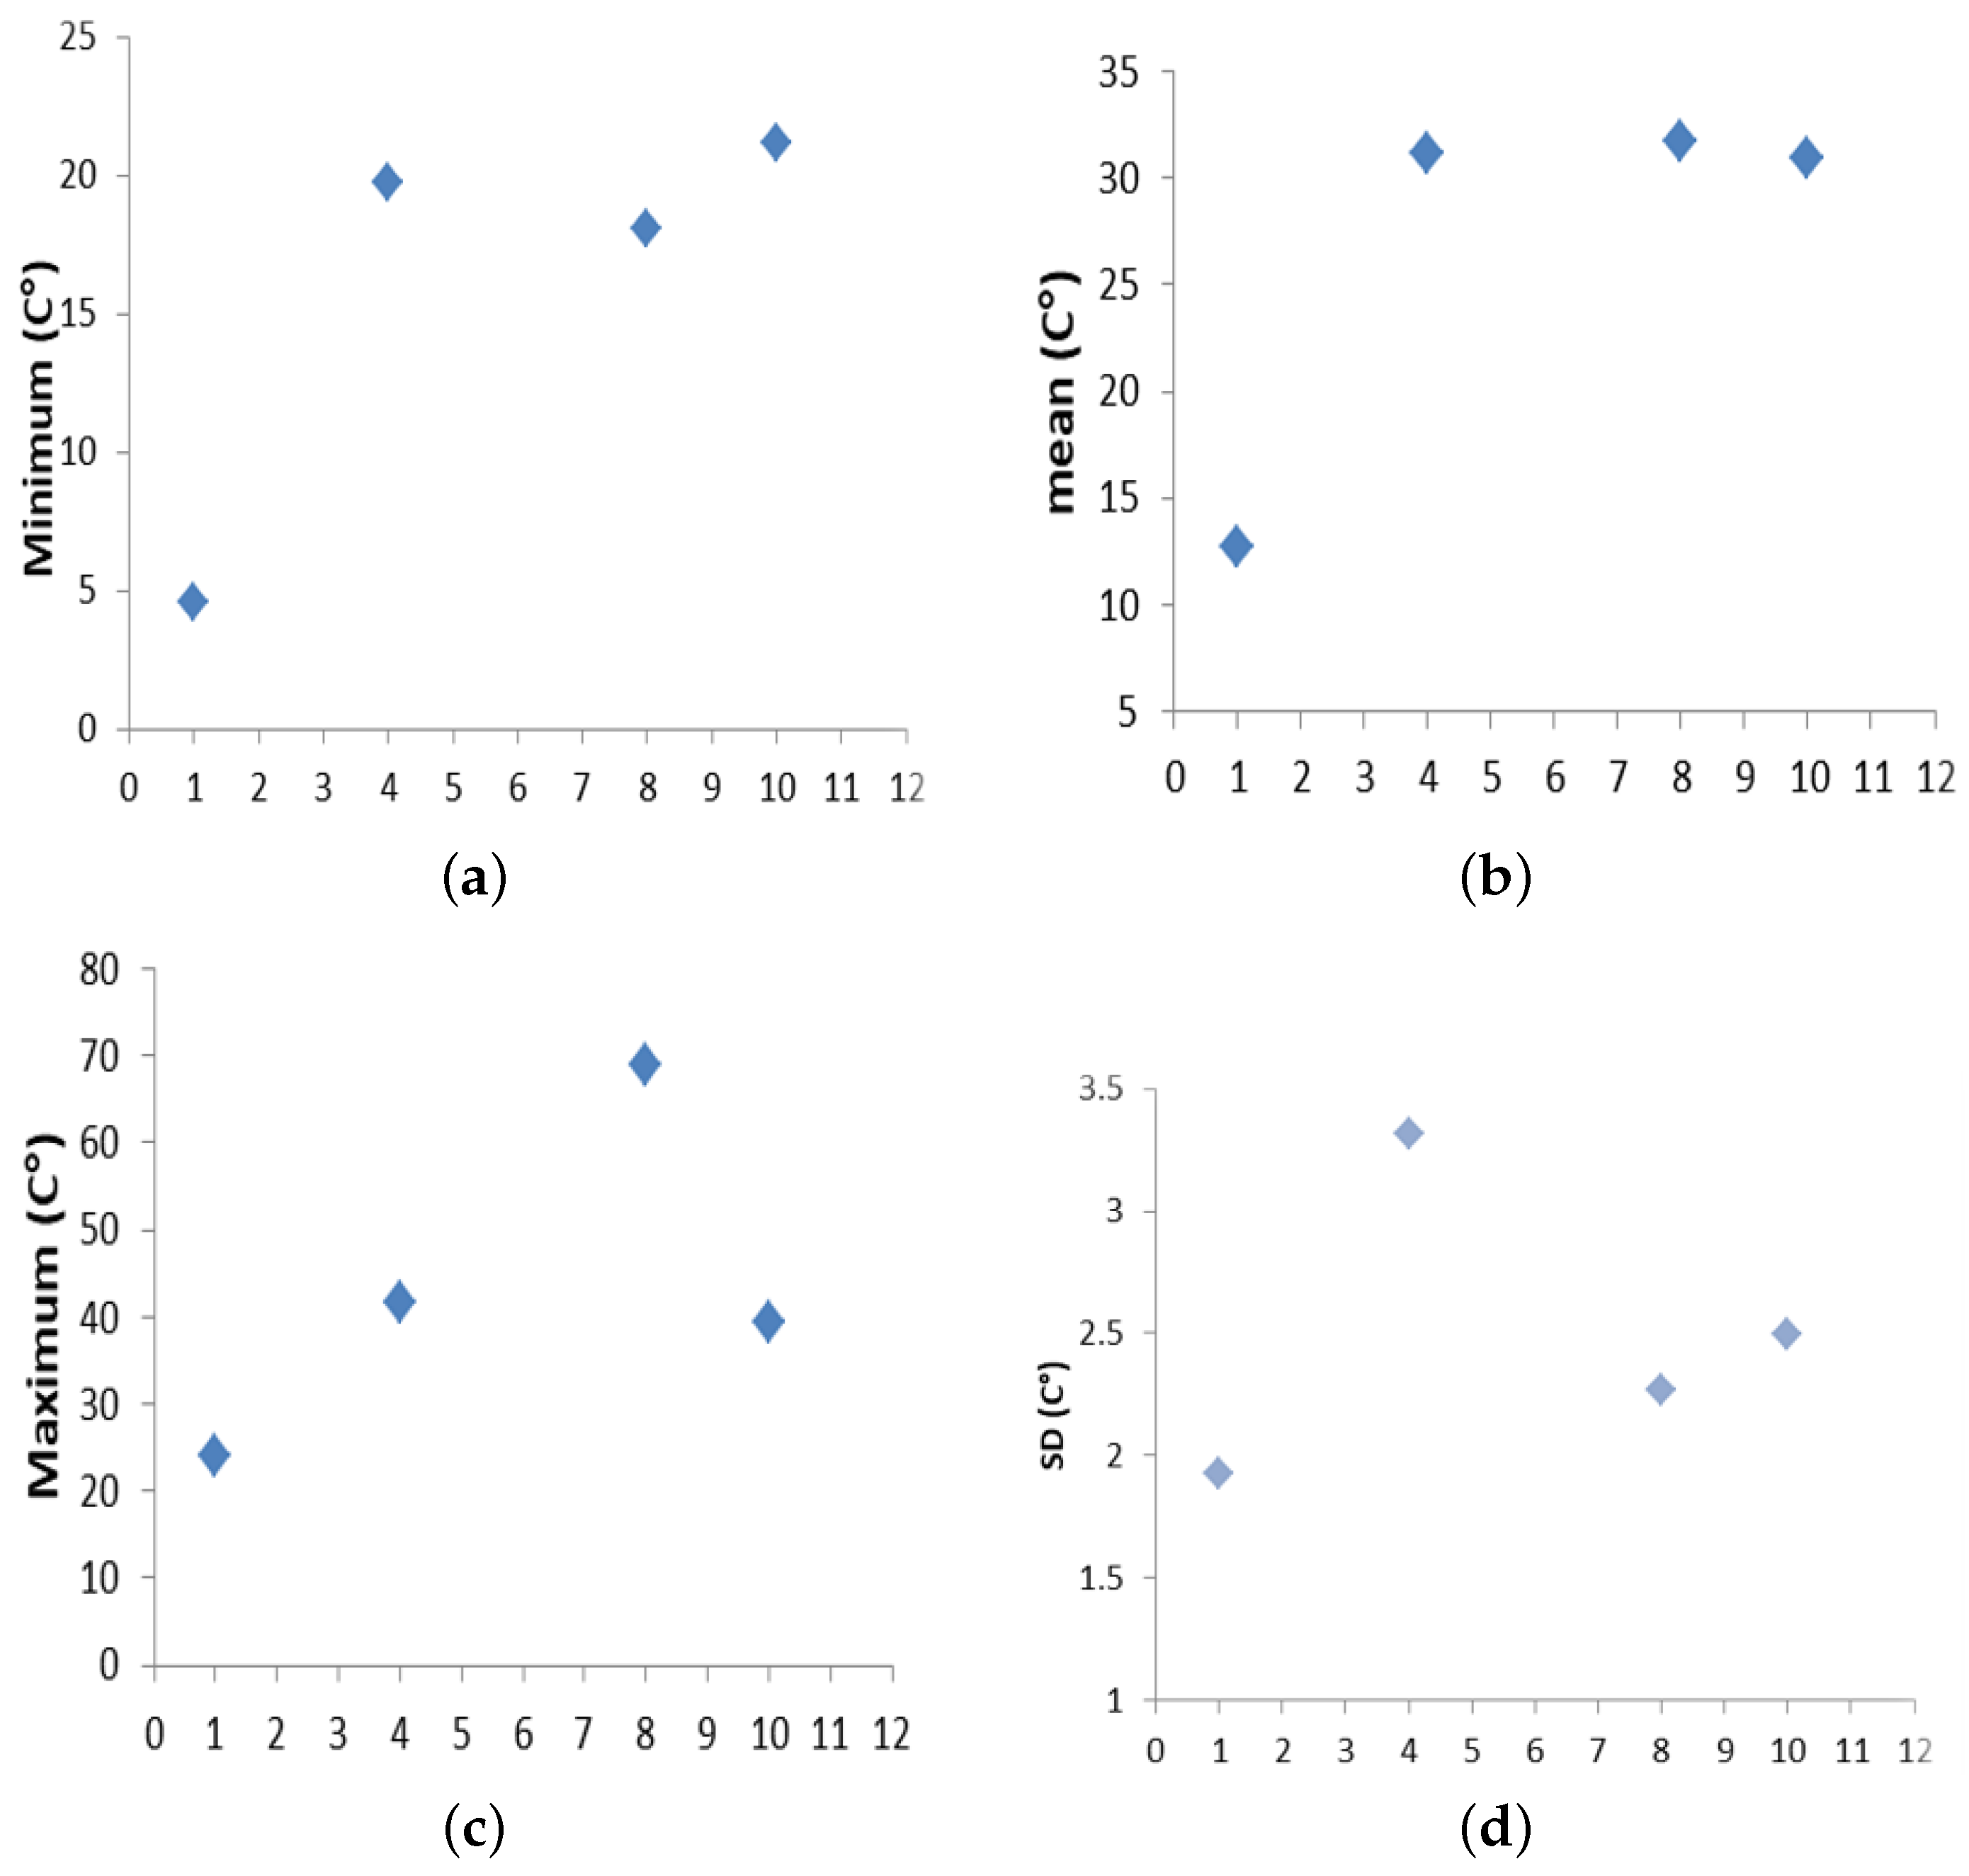
Figure 4 provides further insights into the descriptive statistics for each season during the study period. Specifically, panels (a, b, c, and d) represent the minimum, maximum, mean, and standard deviation of LST in January, April, August, and October of 2023, respectively.
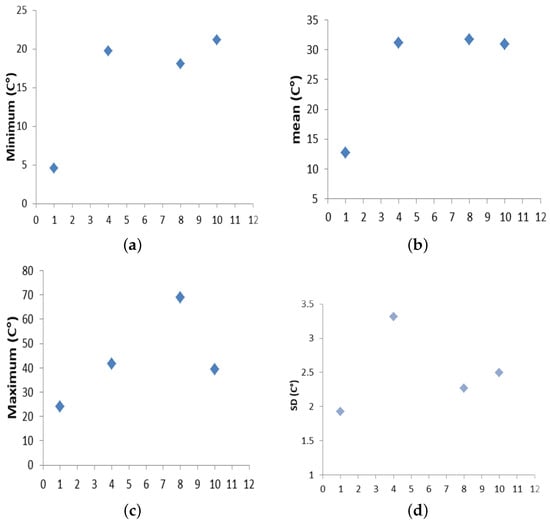
Figure 4.
Descriptive statistics coefficients in four seasons for the period of study: (a) winter; (b) spring; (c) summer; (d) autumn.
5. Discussion
As illustrated in Figure 3, the results reveal significant variations in temperature across regions within Babylon Governorate and across various seasons. These variations can be attributed to seasonal changes and the inverse relationship between temperature and the vegetation index. For instance, during the summer, the temperature ranges from C to C, with higher temperatures observed in eastern areas like the administrative region of Hamza. Conversely, winter temperatures range between C and C, showing a general trend of moderate to low temperatures. In the administrative region of Shomali, the presence of vegetation contributes to lower temperatures in some areas during the summer, while other areas experience higher temperatures. During winter, temperatures are generally lower. In the southern regions, such as the administrative area of Al-Tali’a, temperatures remain moderate throughout both summer and winter. Similarly, the administrative area of Al-Kifl, located in the southern part of the province, experiences moderate temperatures in the summer and lower temperatures in the winter, likely due to its proximity to the Euphrates River. Central administrative areas like Al-Hilla, Nile, Hashemite, and Mahawil exhibit semi-high temperatures in the summer and lower temperatures in the winter. In contrast, the western area of Abi Ghark is characterized by consistently low temperatures in both summer and winter. The northern areas, including Musayyib, Alexandria, and Jurf Al-Sakhar, experience high temperatures in both seasons. During spring and autumn, temperature ranges are C to C and C to C, respectively, with minimal variations across the province, except for a noticeable decrease in the northwestern region during spring.
6. Conclusions
The aim of this study was to estimate the land surface temperature (LST) across four seasons in the year 2022 in Babylon city. Data from LANDSAT 8 obtained from the US Geological Survey served as the basis for this analysis. To comprehensively cover the study area, two scenes were downloaded and subjected to preprocessing steps, including clipping and the mosaic technique, to generate a realistic representation of the study region. Subsequently, LST maps for each season were constructed, and descriptive statistics were calculated. These statistics were then compared across different seasons to understand the spatial distribution and seasonal variations in LST in Babylon city.
Author Contributions
Methodology and writing—original draft preparation, A.A.A.-S.; investigation, M.M.K.H.; resources, M.M.K.H.; data curation, M.M.K.H.; writing—review and editing, M.M.K.H. All authors have read and agreed to the published version of the manuscript.
Funding
This research received no external funding.
Institutional Review Board Statement
Not applicable.
Informed Consent Statement
Not applicable.
Data Availability Statement
All data used in the experiment have been made available in the present article.
Conflicts of Interest
The authors declare no conflicts of interest.
References
- Shwetha, H.R.; Kumar, D.N. Prediction of high spatio-temporal resolution land surface temperature under cloudy conditions using microwave vegetation index and ANN. ISPRS J. Photogramm. Remote Sens. 2016, 117, 40–55. [Google Scholar] [CrossRef]
- Khandelwal, S.; Goyal, R.; Kaul, N.; Mathew, A. Assessment of land surface temperature variation due to change in elevation of area surrounding Jaipur, India. Egypt. J. Remote Sens. Space Sci. 2018, 21, 87–94. [Google Scholar] [CrossRef]
- Hazaymeh, K.; Hassan, Q.K. A remote sensing-based agricultural drought indicator and its implementation over a semi-arid region, Jordan. J. Arid. Land 2017, 9, 319–330. [Google Scholar] [CrossRef]
- French, A.N.; Inamdar, A. Land cover characterization for hydrological modelling using thermal infrared emissivities. Int. J. Remote Sens. 2010, 31, 3867–3883. [Google Scholar] [CrossRef]
- Li, H.; Zhou, Y.; Li, X.; Meng, L.; Wang, X.; Wu, S.; Sodoudi, S. A new method to quantify surface urban heat island intensity. Sci. Total Environ. 2018, 624, 262–272. [Google Scholar] [CrossRef] [PubMed]
- Weng, Q.; Fu, P.; Gao, F. Generating daily land surface temperature at Landsat resolution by fusing Landsat and MODIS data. Remote Sens. Environ. 2014, 145, 55–67. [Google Scholar] [CrossRef]
- Mahmoud, R.R.; Abood, R.H.; Kadhim, K.N. Studying the relationship between land cover lst utilizing Landsat 8 data in Karbala Governorate. Int. J. Civ. Eng. Technol. 2018, 9, 775–783. [Google Scholar]
- Artis, D.A.; Carnahan, W.H. Survey of emissivity variability in thermography of urban areas. Remote Sens. Environ. 1982, 12, 313–329. [Google Scholar] [CrossRef]
- Walawender, J.P.; Hajto, M.J.; Iwaniuk, P. A new ArcGIS toolset for automated mapping of land surface temperature with the use of LANDSAT satellite data. In Proceedings of the 2012 IEEE International Geoscience and Remote Sensing Symposium, Munich, Germany, 22–27 July 2012; IEEE: Piscataway, NJ, USA, 2012; pp. 4371–4374. [Google Scholar] [CrossRef]
- Kumar, D.; Shekhar, S. Statistical analysis of land surface temperature–vegetation indexes relationship through thermal remote sensing. Ecotoxicol. Environ. Saf. 2015, 121, 39–44. [Google Scholar] [CrossRef] [PubMed]
- Sobrino, J.A.; Jiménez-Muñoz, J.C.; Paolini, L. Land surface temperature retrieval from LANDSAT TM 5. Remote Sens. Environ. 2004, 90, 434–440. [Google Scholar] [CrossRef]
- Carlson, T.N.; Ripley, D.A. On the relation between NDVI, fractional vegetation cover, and leaf area index. Remote Sens. Environ. 1997, 62, 241–252. [Google Scholar] [CrossRef]
- Weng, Q.; Lu, D.; Schubring, J. Estimation of land surface temperature–vegetation abundance relationship for urban heat island studies. Remote Sens. Environ. 2004, 89, 467–483. [Google Scholar] [CrossRef]
Disclaimer/Publisher’s Note: The statements, opinions and data contained in all publications are solely those of the individual author(s) and contributor(s) and not of MDPI and/or the editor(s). MDPI and/or the editor(s) disclaim responsibility for any injury to people or property resulting from any ideas, methods, instructions or products referred to in the content. |
© 2024 by the authors. Licensee MDPI, Basel, Switzerland. This article is an open access article distributed under the terms and conditions of the Creative Commons Attribution (CC BY) license (https://creativecommons.org/licenses/by/4.0/).