Abstract
Ciprofloxacin (Cip) is spectrophotometrically identified through the formation of a colored charge-transfer complex that exhibits a maximum absorbance at 440 nm. This complex is generated by the reaction of the drug’s secondary amine with sodium nitroprusside (SNP) in an alkaline medium in the presence of hydroxylamine (NH2OH). Classical univariate analysis is employed to optimize the experimental conditions affecting the formation of the charge-transfer (CT) complex. The method presented herein offers a straightforward and sensitive approach for quantifying ciprofloxacin within a concentration range of 50.0–250.0 μg/mL. The method exhibits a molar absorptivity of 364.4817 L/mol·cm and a coefficient of determination () of 0.997. Validation of the method is achieved through determination of the regression equation, accuracy, precision, and detection limit. The procedure is successfully applied to the quantification of ciprofloxacin in pharmaceutical formulations and demonstrates satisfactory recovery and precision. Statistical validation corroborates the reliability and repeatability of the obtained results.
1. Introduction
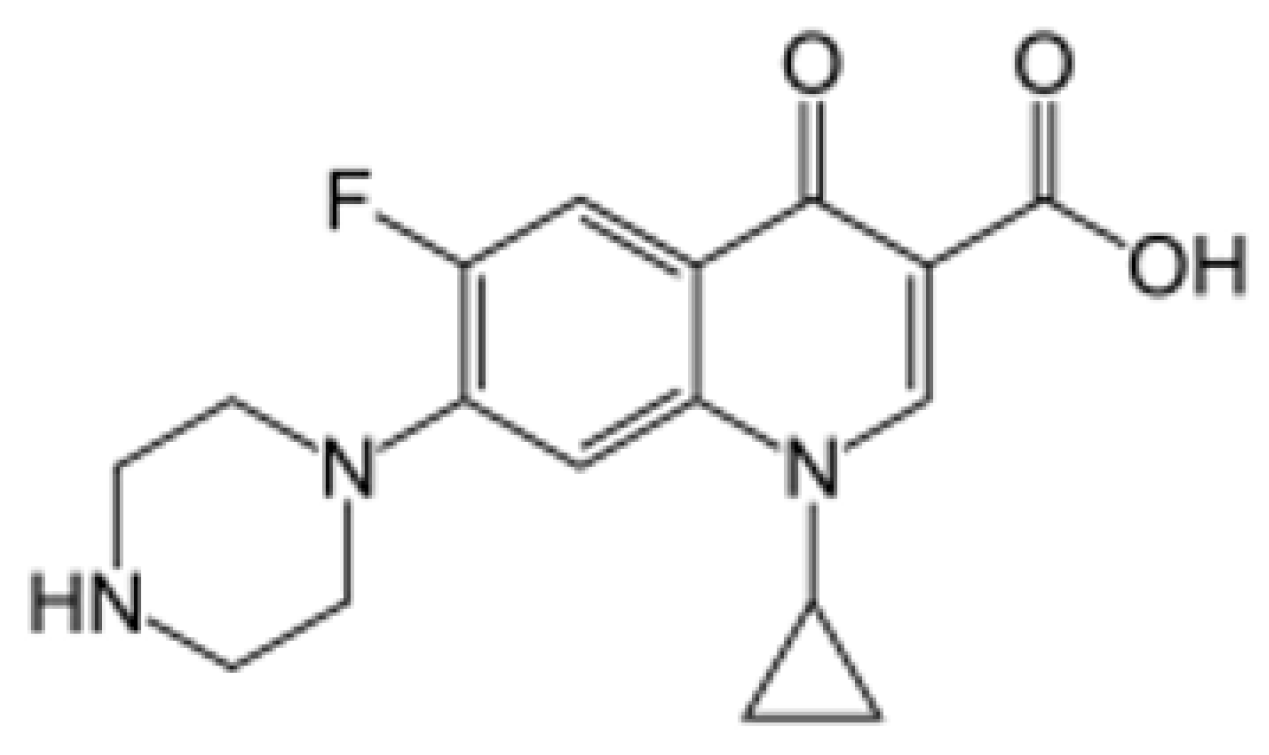
Ciprofloxacin hydrochloride is a fluoroquinolone antibiotic with a broad spectrum of activity against bacterial infections [1]. It is commonly prescribed for a variety of infectious diseases, including chronic inflammation of the large intestine, also known as Crohn’s disease. Chemically, ciprofloxacin is described as 1-cyclopropyl-6-fluoro-1,4-dihydro-4-oxo-7-(piperazinyl) quinolone-3-carboxylic acid, with a molar mass of [2]. The structural formula of ciprofloxacin is provided in Figure 1 [3].

Figure 1.
Chemical structural formula of ciprofloxacin.
Several analytical methods have been reported for the quantification of ciprofloxacin, including high-performance liquid chromatography (HPLC) [4,5], spectrofluorometry [6], flow injection analysis [7], voltammetry [8], derivative spectrophotometric methods [9], titrimetric and spectrophotometric techniques using cerium (IV) sulfate [10], and various other spectrophotometric techniques [11,12].
Some studies have focused on the development of spectrophotometric methods based on charge-transfer complexation techniques [13], indirect spectrophotometric determination using N-Bromosuccinimide and Janus Green B dye [14], and the use of capillary electrophoresis with transient pseudo-isotachophoresis [11,12,15]. The objective of this study is to develop a spectrophotometric analytical method for the quantification of ciprofloxacin hydrochloride in pharmaceutical preparations. The method employs sodium nitroprusside as a reagent in conjunction with hydroxylamine in a basic medium. The absorbance of the resulting dye is measured at 440 nm. This approach aims to establish a colorimetric method for detecting ciprofloxacin in both raw and formulated medications. The method’s sensitivity is attributed to the formation of a charge-transfer complex between ciprofloxacin, sodium nitroprusside (SNP), and hydroxylamine (NH2OH) in an alkaline environment. The stoichiometric ratio of the reactants was determined, optimal reaction conditions were established, and the method was applied for ciprofloxacin quantification in pharmaceutical manufacturing.
2. Materials and Methods
Absorption measurements utilized a pg T80+ UV–visible double-spectrophotometer (UK) with quartz cells. The device was interfaced with a Windows-compatible computer running UV Win 5 software v5.2.0.1104. Weighing was conducted using a KERN sensitive balance (Germany). Solutions were prepared with a Labtech magnetic stirrer (Korea), and heating processes used a Labtech water bath (Korea). All reagents and solvents were of analytical grade. Reference ciprofloxacin with a purity of was provided by the Samara Drug Company in Iraq. Other chemicals included -pure sodium nitroprusside (Merck), hydrochloride of hydroxylamine (Chemapol), and hydrated sodium carbonate (SEELEZE-HANOVER), among others. An sodium carbonate hydrate solution was prepared by dissolving approximately of in of distilled water. Similarly, solutions of sodium nitroprusside and hydroxylamine hydrochloride were prepared. Stock solutions (10,000 ) of glucose, starch, lactose, sucrose, and acacia were also prepared [16]. A standard ciprofloxacin solution () was created by dissolving of the drug in of distilled water. From this stock, dilutions were made to obtain solutions with lower concentrations. A solution of ciprofloxacin and a similar concentration of sodium nitroprusside (SNP) were also prepared. For sample stock solutions, the contents of 10 units (tablets or capsules) of each ciprofloxacin medication were weighed, crushed, and mixed. A weight of powder equivalent to of ciprofloxacin was dissolved in distilled water, and the volume was adjusted to . Insoluble substances were removed by filtration using Whatman No. 41 filter paper, and subsequent solutions were prepared from this stock. Based on univariate optimization results, of SNP solution and of hydroxylamine solution were added to a series of volumetric bottles, each containing of ciprofloxacin. Additionally, of solution was added to each bottle. The reaction mixture was shaken and left to stand for five minutes at . The volume was then adjusted with distilled water and mixed well, and the absorbance was measured at relative to a blank solution. The method was validated in accordance with the International Conference on Harmonization (ICH) guidelines [17]. Validation parameters included specificity, linearity, recovery values, limits of detection (LODs), and limits of quantification, along with precision and accuracy assessments.
3. Result and Discussion
3.1. Absorption Spectra
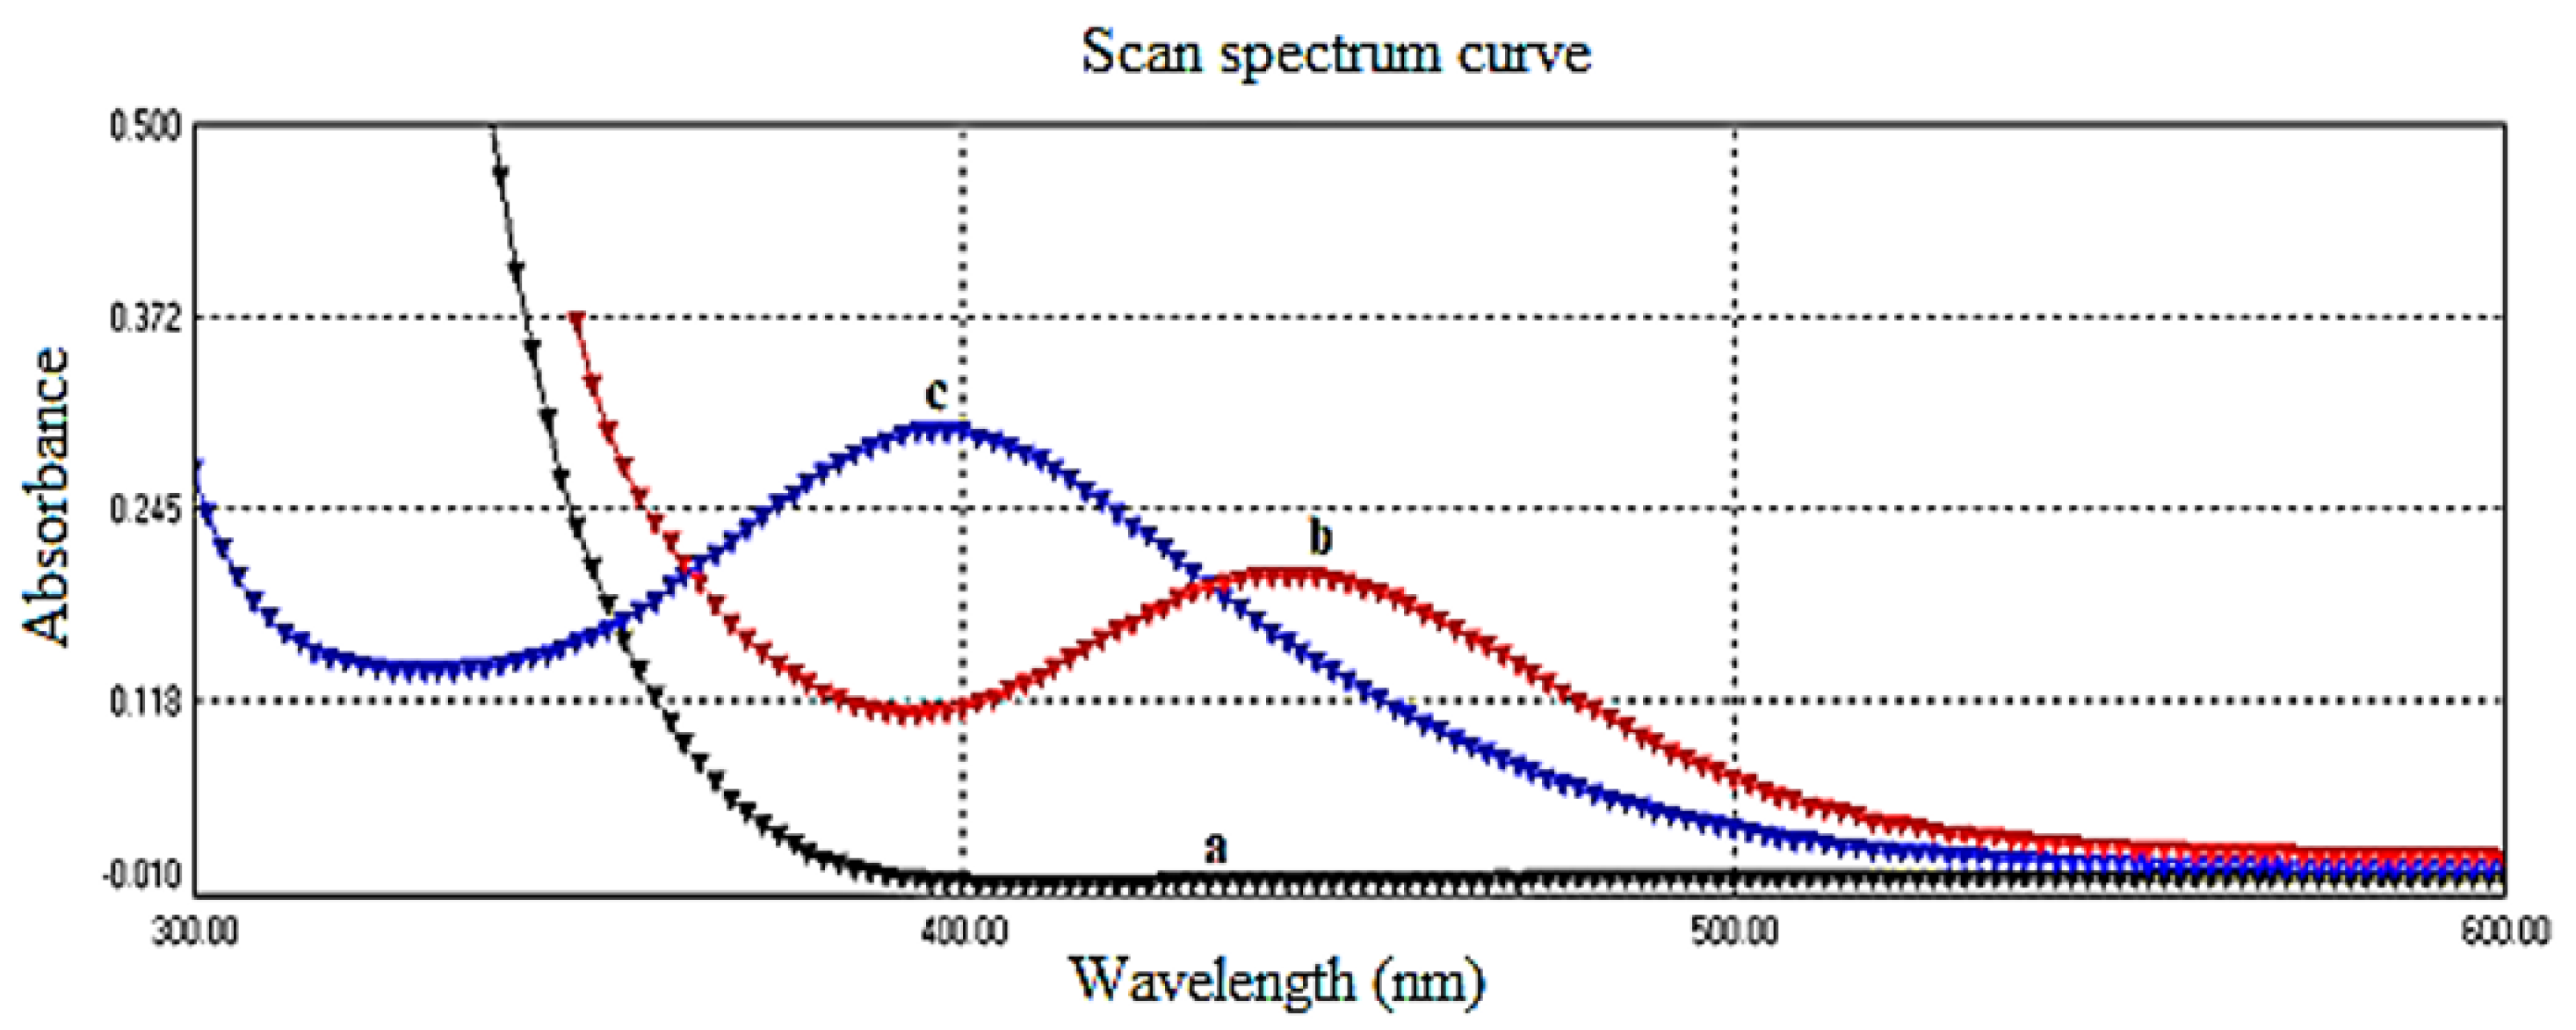
The maximum absorption of the yellow color relative to the reagent blank was observed at for the reaction between ciprofloxacin and sodium nitroprusside in the presence of hydroxylamine under alkaline conditions. This observation is illustrated in Figure 2. It is noteworthy that at this specific wavelength, neither ciprofloxacin nor sodium nitroprusside exhibited significant absorption.
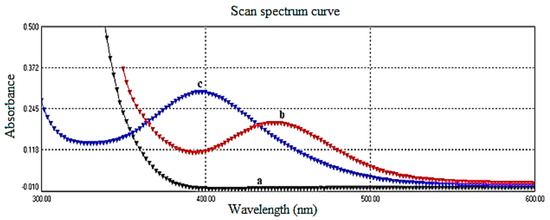
Figure 2.
(a) Absorption spectrum of ciprofloxacin vs. D.W., (b) absorption spectrum of charge-transfer complex for ciprofloxacin (200.0 μg/mL) and sodium nitroprusside vs. blank, and (c) absorption spectrum of reagent blank (SNP + NH2OH + Na2CO3) vs. D.W.
3.2. Optimization of Reaction Conditions
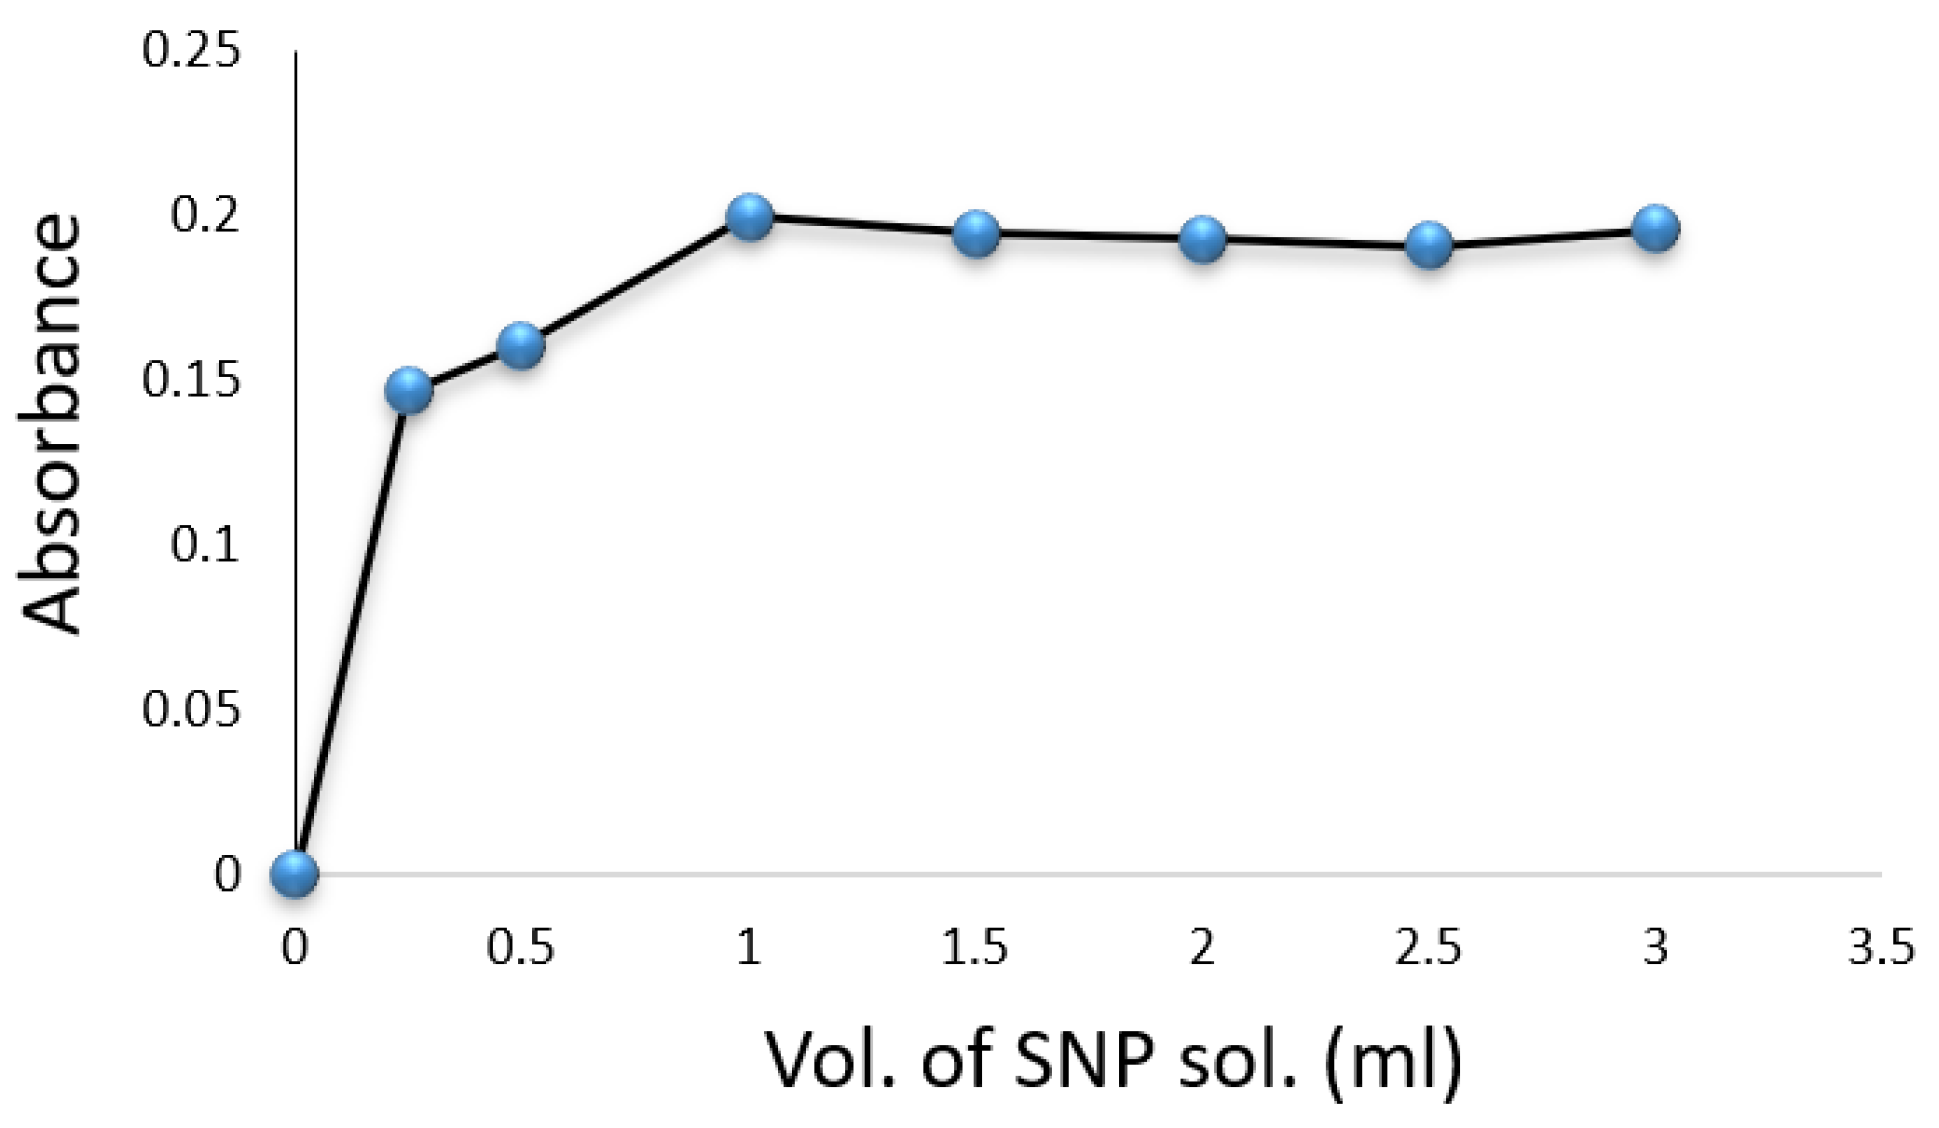
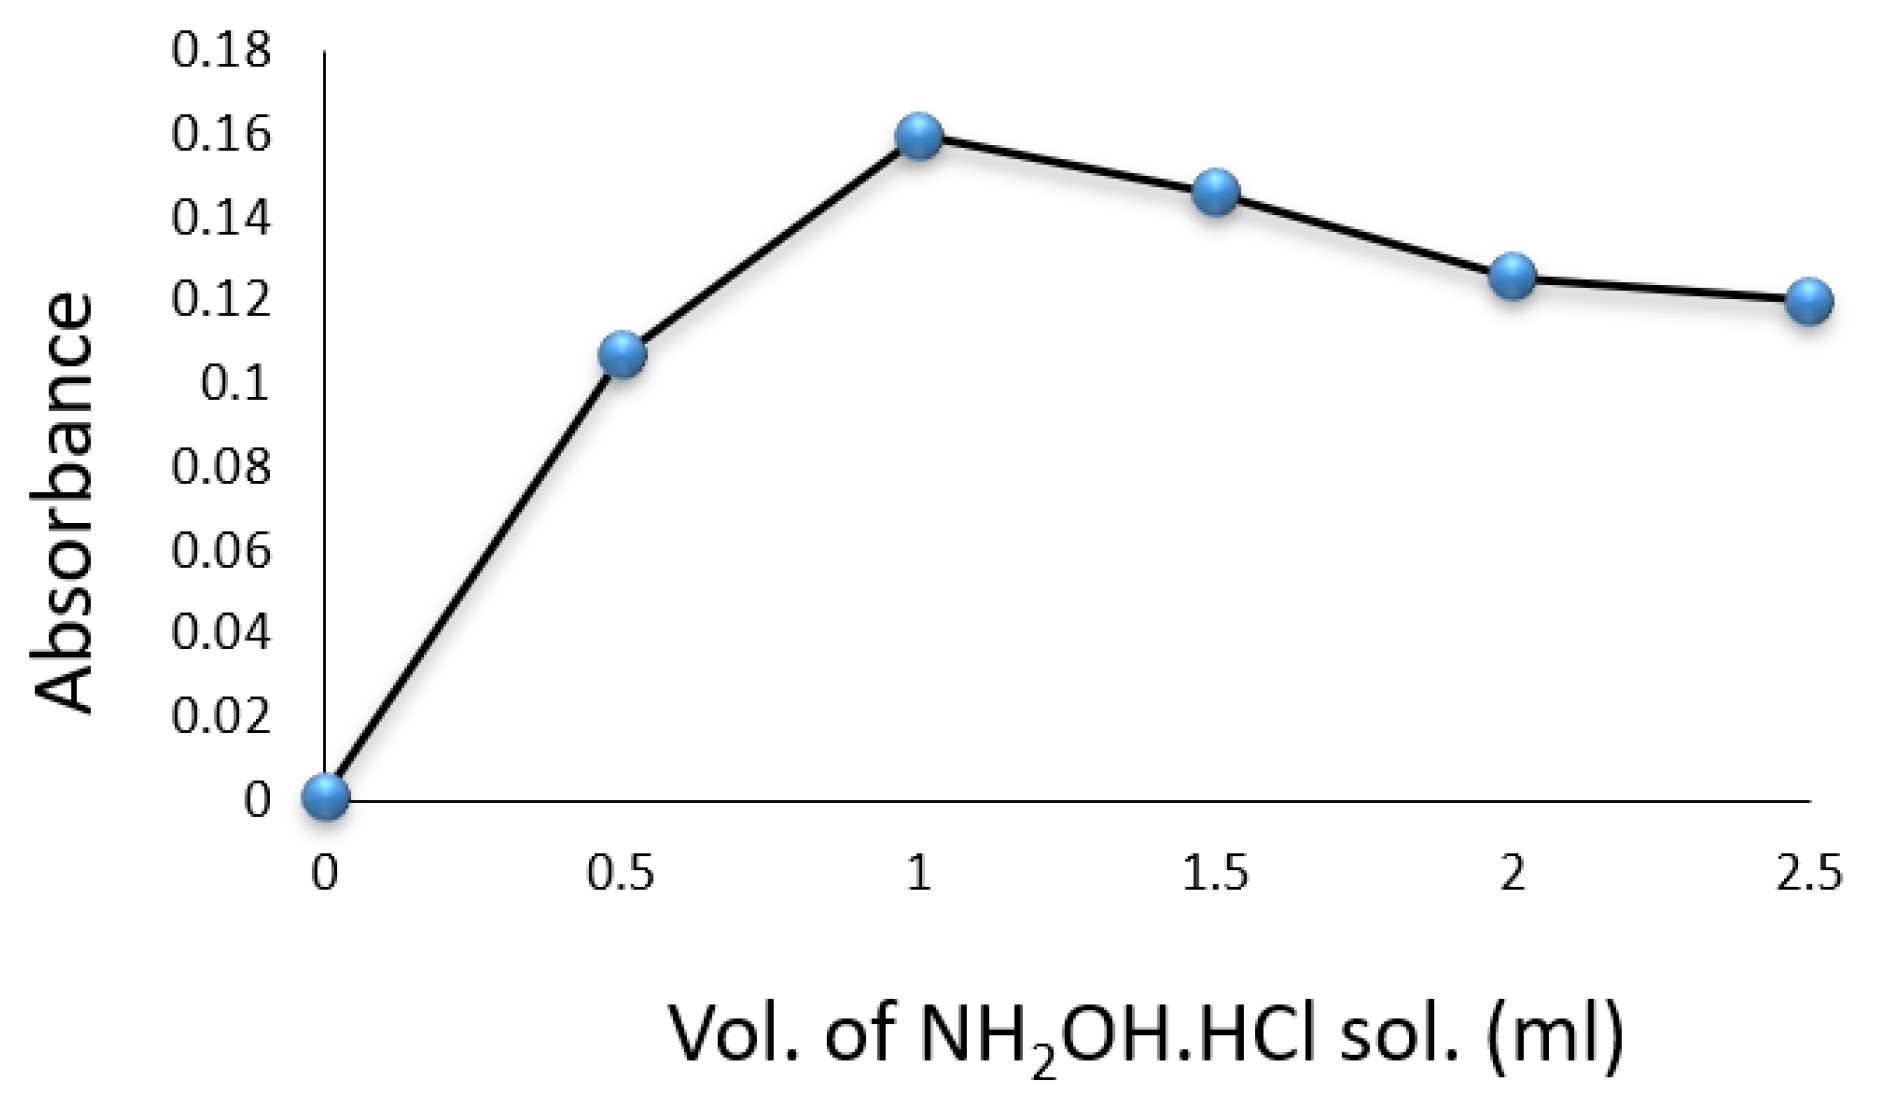
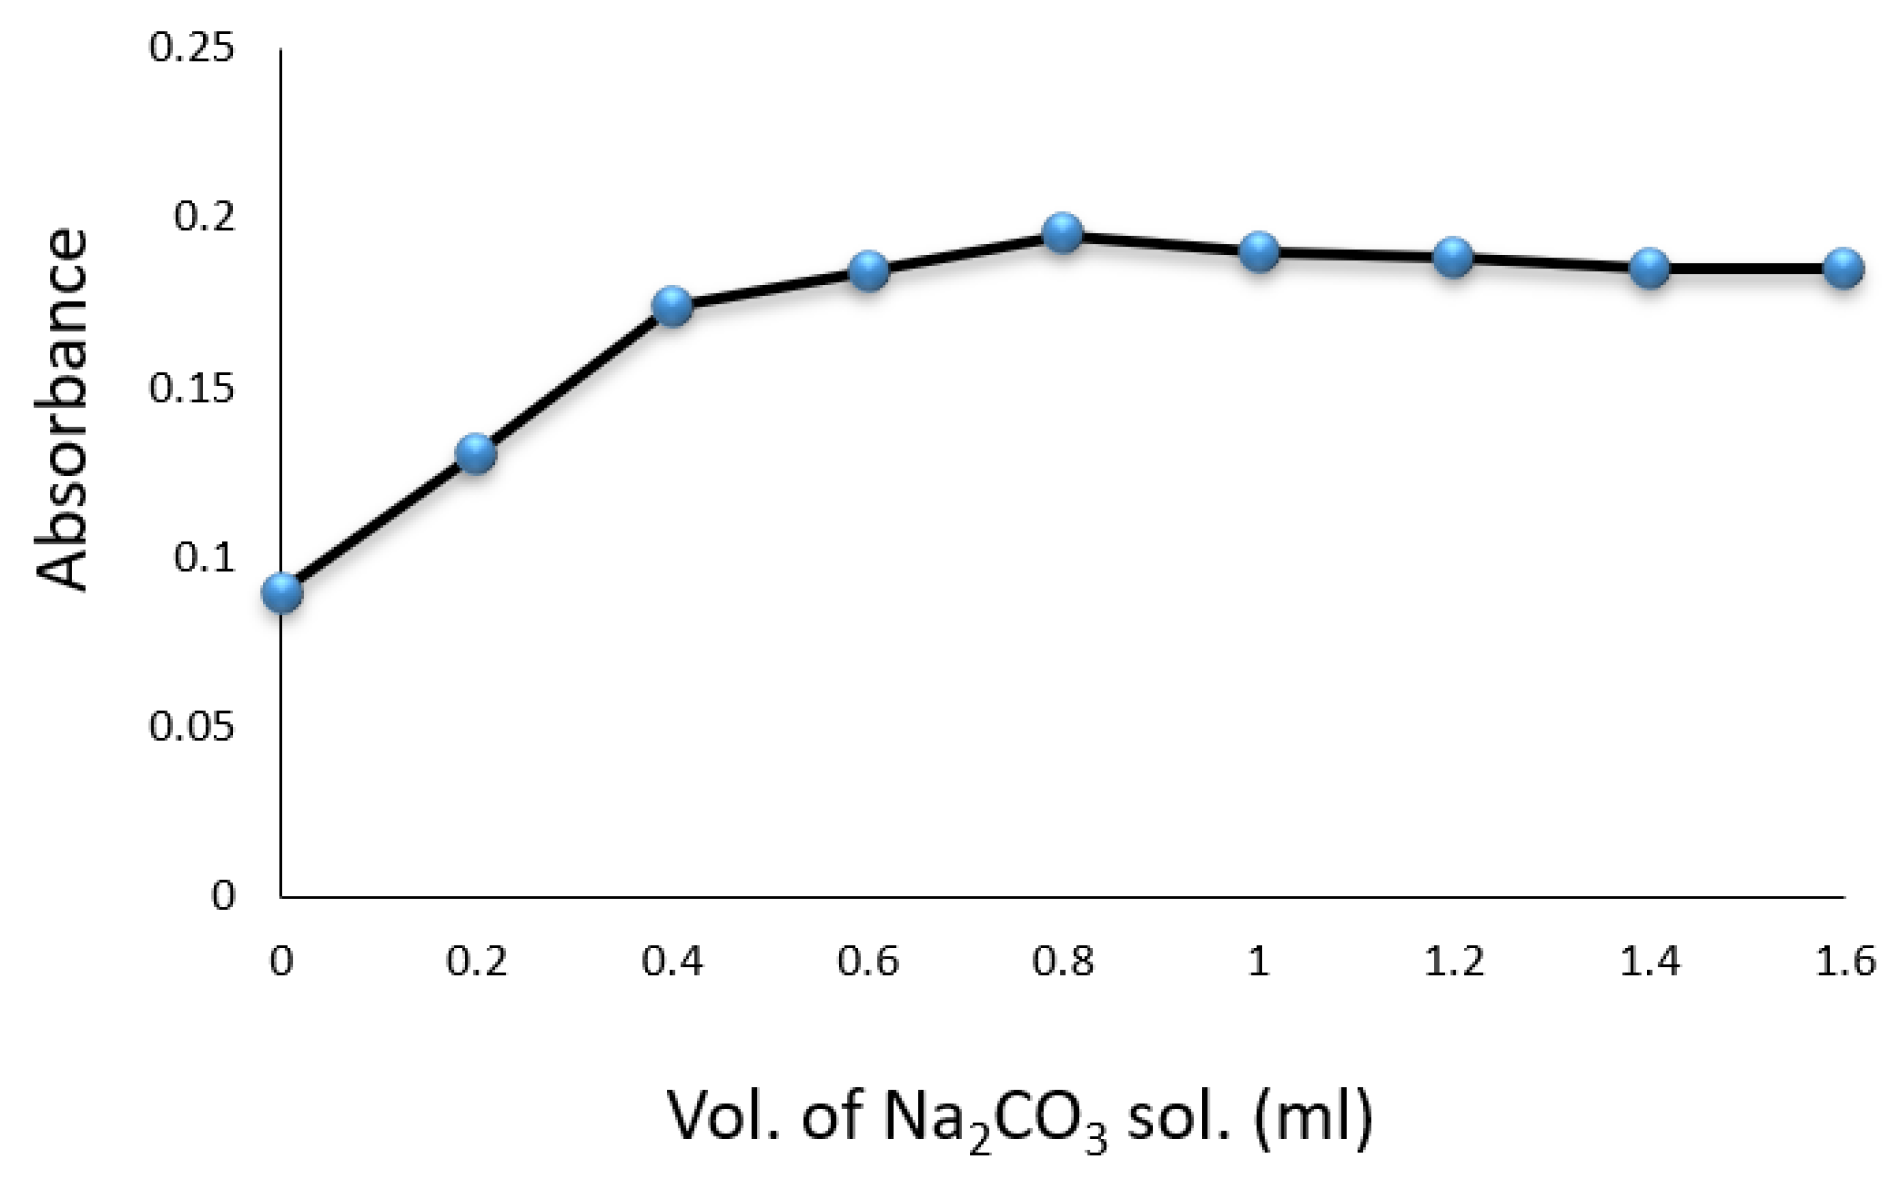
Experiments were conducted in volumetric flasks, each containing of a drug compound solution. Factors such as SNP, hydroxylamine hydrochloride, , temperature, and reaction time were evaluated for their impact on the formation of the colored complex. The color intensity was found to be maximized with of SNP solution (Figure 3) and of (Figure 4). A volume of solution was sufficient for achieving constant maximum absorption (Figure 5). The color intensity reached its peak after five minutes (Table 1), and the reaction was most stable at room temperature () (Table 2). The compound’s absorption remained unchanged for over 5 h.

Figure 3.
Effect of volume of SNP solution on the formation of Cip–SNP complex.

Figure 4.
Effect of volume of solution on the formation of Cip–SNP complex.

Figure 5.
Effect of volume of on the formation of Cip–SNP complex.

Table 1.
Effect of reaction time on the color development for the estimation of Cip.
Table 2.
Effect of temperature on the color development for the determination of Cip.
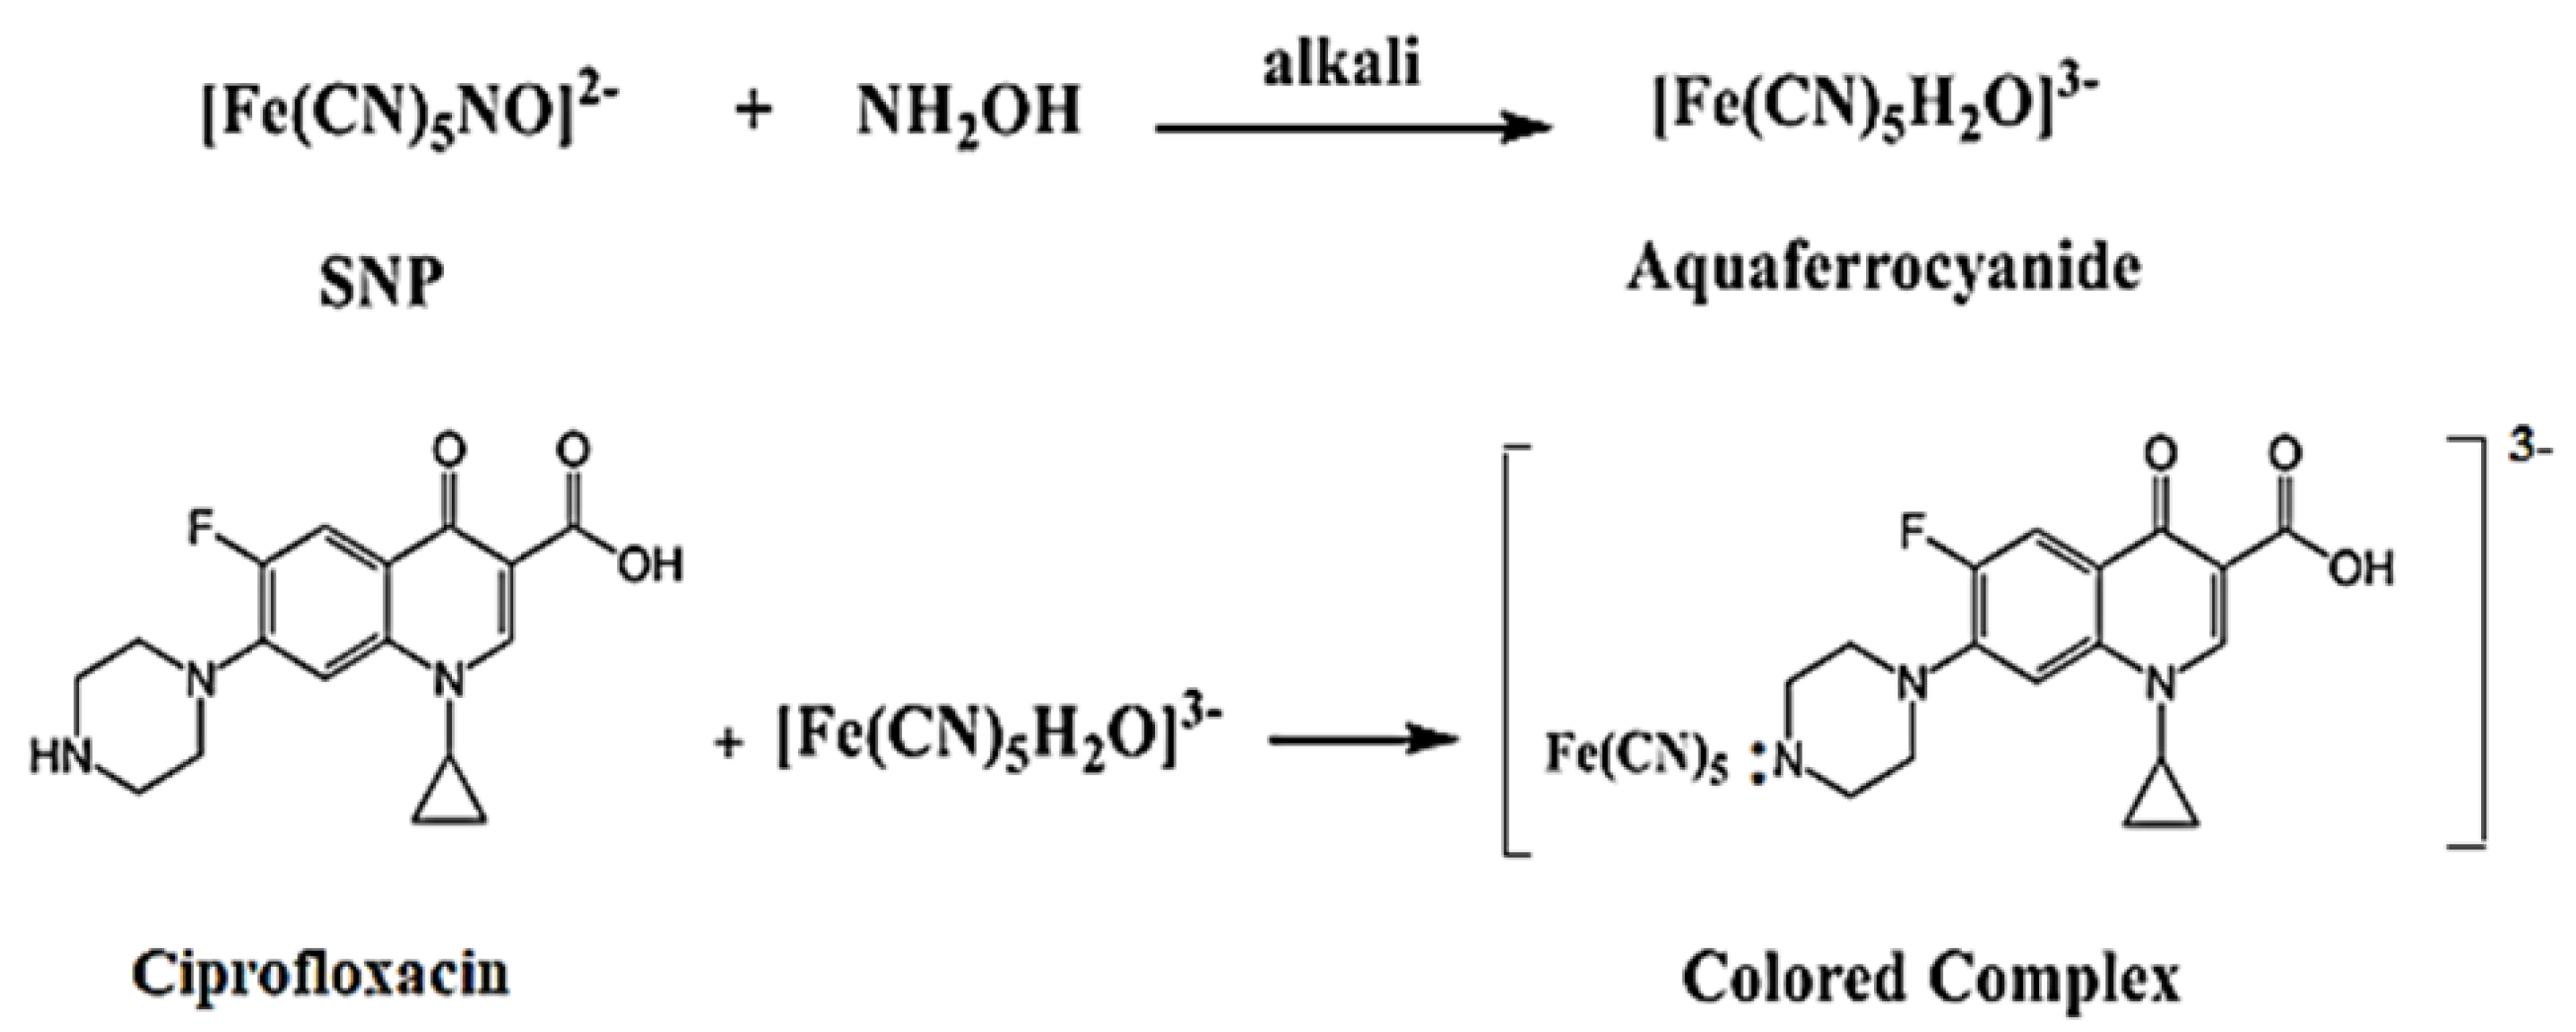
3.3. Chemical Reactions of the Method
In this method, ciprofloxacin (Cip) serves as an electron donor to SNP in the presence of alkali hydroxylamine, forming aqua ferricyanide . The resulting color is attributed to the formation of , where M is the drug compound. The proposed reaction between ciprofloxacin and SNP is illustrated in Figure 6 [18].
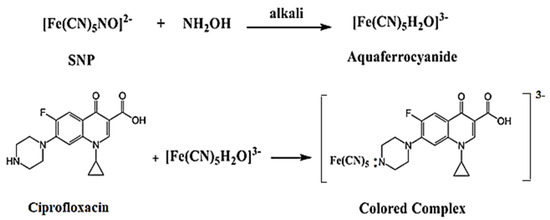
Figure 6.
The possible sequence of reaction between ciprofloxacin and SNP.
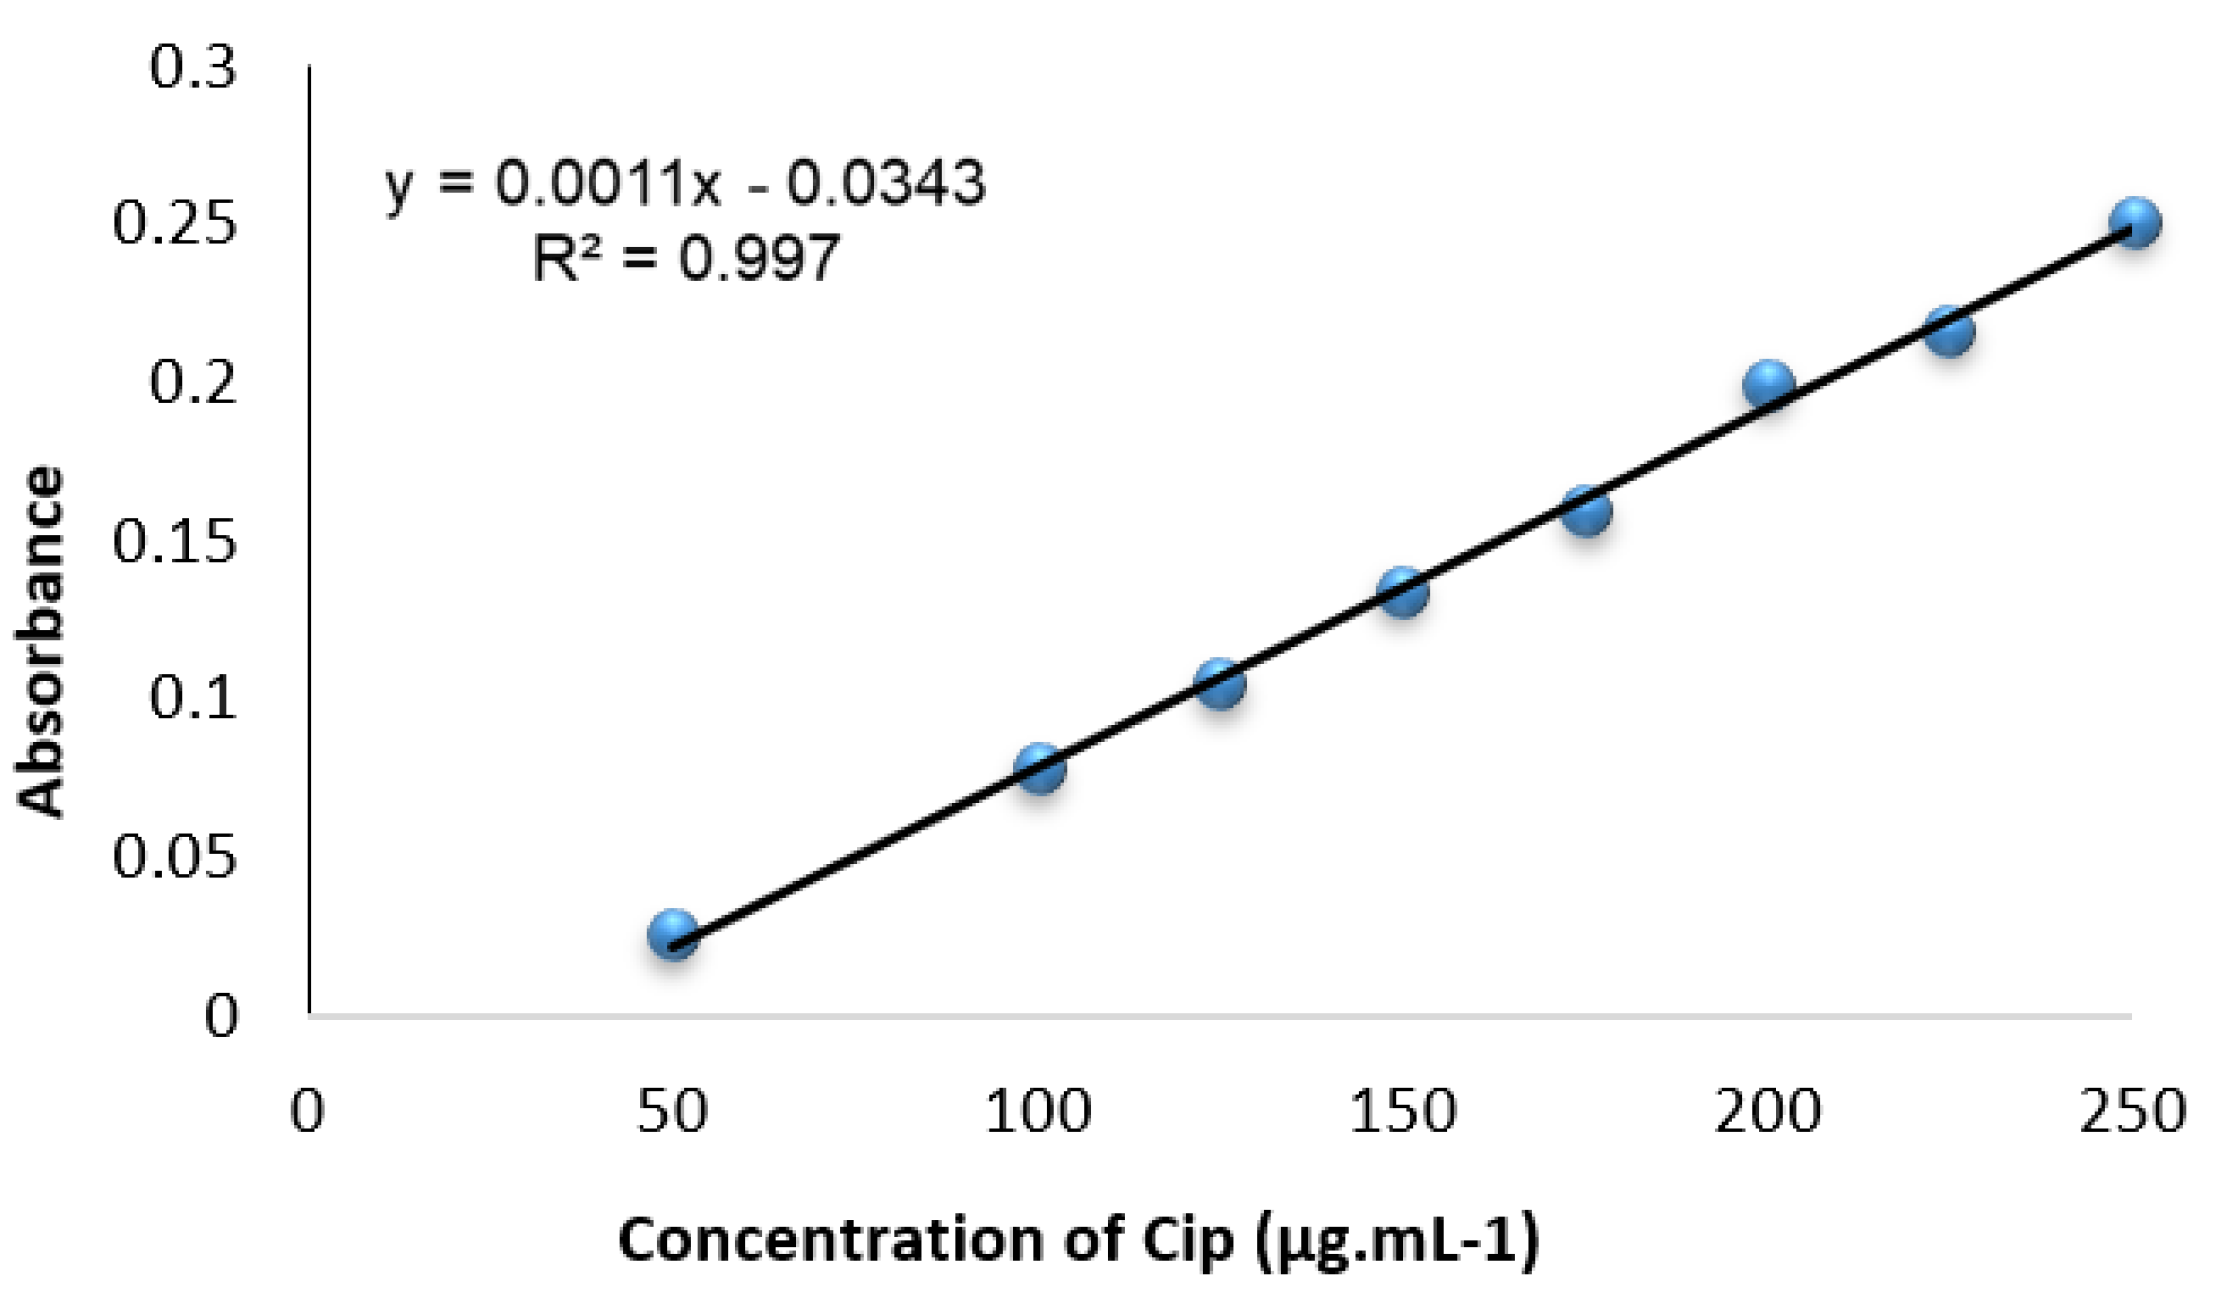
3.4. Calibration Curves and Analytical Data
Calibration curves were generated by plotting the absorbance values of a series of solutions with varying Cip concentrations against the corresponding reagent blank at . These curves, depicted in Figure 7, were linear over the 50.0–250.0 range of Cip concentration, as confirmed by linear regression.
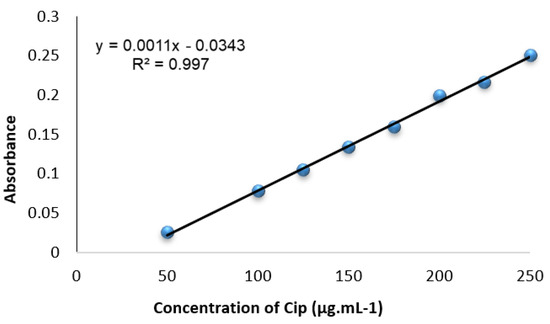
Figure 7.
Standardization plot for Cip developed via univariate optimization under ideal circumstances.
Various optical and statistical properties of the Cip–SPN complex are summarized in Table 3 [19]. The high correlation coefficient (r) values of the regression equation confirm the linearity of the curves. The method’s sensitivity, as indicated by the molar absorbance, limits of detection, and quantification, as well as Sandel’s sensitivity, is deemed acceptable for the determination of the drug compound under study.
Table 3.
Optical and regression data of the proposed method for ciprofloxacin.
3.5. Equivalent of the Reactions
The mole-ratio method was employed to ascertain the nature of the colored complex. Under optimal conditions of hydroxylamine concentration, alkalinity, and temperature, the stoichiometry of the interaction between Cip and SNP was investigated. The equivalence ratio between the reagent and the drug was found to be 2:1, as shown in Figure 7.
3.6. Accuracy and Precision
To assess the method’s accuracy, five replicates of the pure drug were analyzed at three different concentration levels. Precision was evaluated by calculating the coefficient of variation (C.V. %) for identical drug sample solutions.
The results, summarized in Table 4, indicate low C.V. % values, ranging from to , and relative error percent values not exceeding . These findings attest to the high precision and accuracy of the proposed method.
Table 4.
The accuracy and precision of the method.
3.7. Interference Study
The method’s analytical capability was further evaluated by investigating the influence of common excipients such as acacia, sucrose, glucose, lactose, and starch, which are often found in pharmaceutical formulations. These compounds were tested in the presence of of Cip. According to the data in Table 5, none of the examined excipients significantly interfered with the detection of Cip.
Table 5.
Recovery of ciprofloxacin in the presence of different excipients.
3.8. Effect of Mixing Sequence
The optimal sequence for mixing the reagents to achieve maximum consistent absorbance was determined to be (Drug–SNP–NH2OH–Base), as indicated in Table 6. Subsequent experiments adhered to this mixing sequence.
Table 6.
Effect of reagent addition sequence on the color development of Cip.
3.9. Application of the Method
The proposed method was applied to an analysis of several pharmaceutical formulations to evaluate its suitability for determining Cip in real-world samples. The aggregated results, presented in Table 7, show that the recovery percentage values range between and , and the C.V. % values do not exceed .
Table 7.
Application of the proposed method under conditions obtained via univariate optimization for ciprofloxacin determination in pharmaceutical samples.
These findings confirm that the developed method is highly accurate and aligns well with the original dosages of the active ingredient in the pharmaceutical preparations.
4. Conclusions
The present study successfully developed and validated a visible spectrophotometry method for the determination of ciprofloxacin (Cip) in both its pure form and in pharmaceutical formulations. The method exhibited high sensitivity, with a molar absorptivity of 364.4817 L/mol·cm and a correlation coefficient () of 0.997, making it a robust analytical tool. One of the significant advantages of the proposed method is its simplicity and cost-effectiveness. Unlike other analytical techniques such as high-performance liquid chromatography (HPLC) and spectrofluorometry, the developed method does not require specialized equipment or temperature-controlled environments. This makes it particularly useful for routine analyses in settings with limited resources. Moreover, the method demonstrated high levels of accuracy and precision, as evidenced by the low coefficients of variation and relative error percentages in the validation studies. The technique was further validated by its successful application to various pharmaceutical formulations, showing recovery percentages ranging from 97.885% to 99.047%, thereby confirming its applicability for quality control in pharmaceutical manufacturing. Additionally, the method showed excellent specificity, as common excipients like acacia, glucose, lactose, starch, and sucrose did not interfere with Cip detection. This is particularly important for ensuring the reliability of the method in complex sample matrices. In summary, the proposed visible spectrophotometry method offers a straightforward, sensitive, and accurate approach for the routine determination of Cip. Its simplicity and high level of accuracy make it a viable alternative to more complex and resource-intensive methods, and potential applications may extend to other quinolone antibiotics. Future work could focus on further method optimization and its applicability to a broader range of pharmaceutical compounds.
Author Contributions
Methodology and writing—original draft preparation, T.Y.M.; validation, I.S.H.; formal analysis, A.L.J.; investigation, I.S.H.; resources, A.L.J.; data curation, I.S.H.; writing—review and editing, A.L.J. All authors have read and agreed to the published version of the manuscript.
Funding
This research received no external funding.
Institutional Review Board Statement
Not applicable.
Informed Consent Statement
Not applicable.
Data Availability Statement
All the data used in the experiment have been made available in the present article.
Conflicts of Interest
The authors declare no conflicts of interest.
References
- Karaman, R. Commonly Used Drugs—Uses, Side Effects, Bioavailability and Approaches to Improve It; Nova Science Publishers, Inc.: New York, NY, USA, 2015; p. 12. [Google Scholar]
- Brunton, L.L. The Pharmacological Basis of Therapeutics; The Mc. Graw-Hill Inc.: New York, NY, USA, 2006; p. 52. [Google Scholar]
- British Pharmacopoeia CD-ROM; System Simulation; The Stationery Office Ltd.: London, UK, 2013.
- Selahle, S.K.; Nomngongo, P.N. Determination of fluoroquinolones in the environmental samples using vortex assisted dispersive liquid–liquid microextraction coupled with high performance liquid chromatography. Int. J. Environ. Anal. Chem. 2020, 100, 282–294. [Google Scholar] [CrossRef]
- Hasan, N.; Siddiqui, F.A.; Sher, N.; Shafi, N.; Zubair, A.; Afzal, M. Development and validation of a Reverse Phase HPLC method for the analysis of ciprofloxacin and its application in bulk and different dosage formulations. World Appl. Sci. J. 2014, 31, 730–740. [Google Scholar]
- Saeed, A.M.; Salih, E.S. Indirect spectrofluorometric method for the determination of cefotaxime sodium, ciprofloxacin hydrochloride and famotidine in pharmaceuticals using bromate-bromide and acriflavine dye. Baghdad Sci. J. 2020, 17, 1–15. [Google Scholar]
- Turkey, N.S.; Khudhair, A.F. Determination of ciprofloxacin—HCl in pharmaceutical formulations by continuous flow injection analysis via turbidimetric (T180 o) and scattered light effect at two opposite position (2N90 o) using Ayah 4SW-3D-T180-2N90-Solar-CFI Analyser. J. Kerbala Univ. 2013, 11, 153–169. [Google Scholar]
- Akyüz, B.G.; Ozkorucuklu, S.P.; Kır, E.; Bastemur, G.Y. Determination of ciprofloxacin In pharmaceutical dosage, human serum and urine, using molecularly imprinted polymer modified electrode by voltammetry. Eur. J. Sci. Technol. 2020, 20, 859–865. [Google Scholar]
- Miloğlu, F.D.; Kadioglu, Y. Determination Of Ciprofloxacin With Zero–, First– And Second Order Derivative Spectrophotometric Method In Water And Methanol Media. Int. J. Pharm. 2022, 2, 16–24. [Google Scholar]
- Basavaiah, K.; Nagegowda, P.; Somashekar, C.B.; Ramakrishna, V. Spectrophotometric and Titrimetric Determination of Ciprofloxacin Based on Reaction with Cerium (IV) Sulphate. Sci. Asia 2006, 32, 403–409. [Google Scholar] [CrossRef]
- Al-Salim, L.A.S.M. The Use of Oxidation and Reduction Reactions for the Spectrophotometric Determination of a Number of Pharmaceutical Compounds. Master’s Thesis, Mosul University, Mosul, Iraq, 2018; pp. 60–80. [Google Scholar]
- Zareh, M.M.; Saad, M.Z.; Hassan, W.S.; Elhennawy, M.E.; Sebaiy, M.M. Validation of spectrophotometric method for determination of esomeprazole and ciprofloxacin in their pure and dosage forms. Int. J. Pharm. Sci. Dev. Res. 2020, 6, 001–005. [Google Scholar]
- Igboasoiyi, A.C.; Attih, E.E.; Ofoefule, S.I.; Umoh, E.D.; Udoh, O.C. Spectrophotometric determination of ciprofloxacin using charge-transfer complexation technique. Int. J. Innov. Res. Dev. 2014, 3, 152–177. [Google Scholar]
- Abdullah, M.B.; Salih, E.S. Indirect Spectrophotometric Determination of Famotidine and Ciprofloxacin Hydrochloride in Pharmaceuticals Using N-Bromosuccinimde and Janus Green B Dye. J. Educ. Sci. 2022, 31, 38–57. [Google Scholar] [CrossRef]
- Kóska, I.; Purgat, K.; Głowacki, R.; Kubalczyk, P. Simultaneous Determination of Ciprofloxacin and Ofloxacin in Animal Tissues with the Use of Capillary Electrophoresis with Transient Pseudo-Isotachophoresis. Molecules 2021, 26, 6931. [Google Scholar] [CrossRef] [PubMed]
- Parker, S.P. McGraw-Hill Dictionary of Chemistry, 1st ed.; International Edition; McGraw-Hill Book Company: New York, NY, USA, 1986; pp. 274, 346, 575, 644. [Google Scholar]
- Commision of the European Communities. Validation of Analytical Procedures. 1996. Available online: https://www.ema.europa.eu/en/documents/scientific-guideline/ich-guideline-q2r1-validation-analytical-procedures-text-and-methodology-step-5-first-version_en.pdf (accessed on 1 December 2023).
- Kishore, M.; Surendrababu, K.; Kalyani, C.S.R.G.; Janrdhan, M. Optimization of quantitative analysis of buclizine hydrochloride using spectrophotometry in bulk drug and pharmaceutical formulations. Int. J. Curr. Pharm. Res. 2010, 2, 48–51. [Google Scholar]
- Khopkar, S.M. Basic Concepts of Analytical Chemistry, 2nd ed.; New Age Int. Ltd.: New Delhi, India, 2004; p. 240. [Google Scholar]
Disclaimer/Publisher’s Note: The statements, opinions and data contained in all publications are solely those of the individual author(s) and contributor(s) and not of MDPI and/or the editor(s). MDPI and/or the editor(s) disclaim responsibility for any injury to people or property resulting from any ideas, methods, instructions or products referred to in the content. |
© 2024 by the authors. Licensee MDPI, Basel, Switzerland. This article is an open access article distributed under the terms and conditions of the Creative Commons Attribution (CC BY) license (https://creativecommons.org/licenses/by/4.0/).