1. Introduction
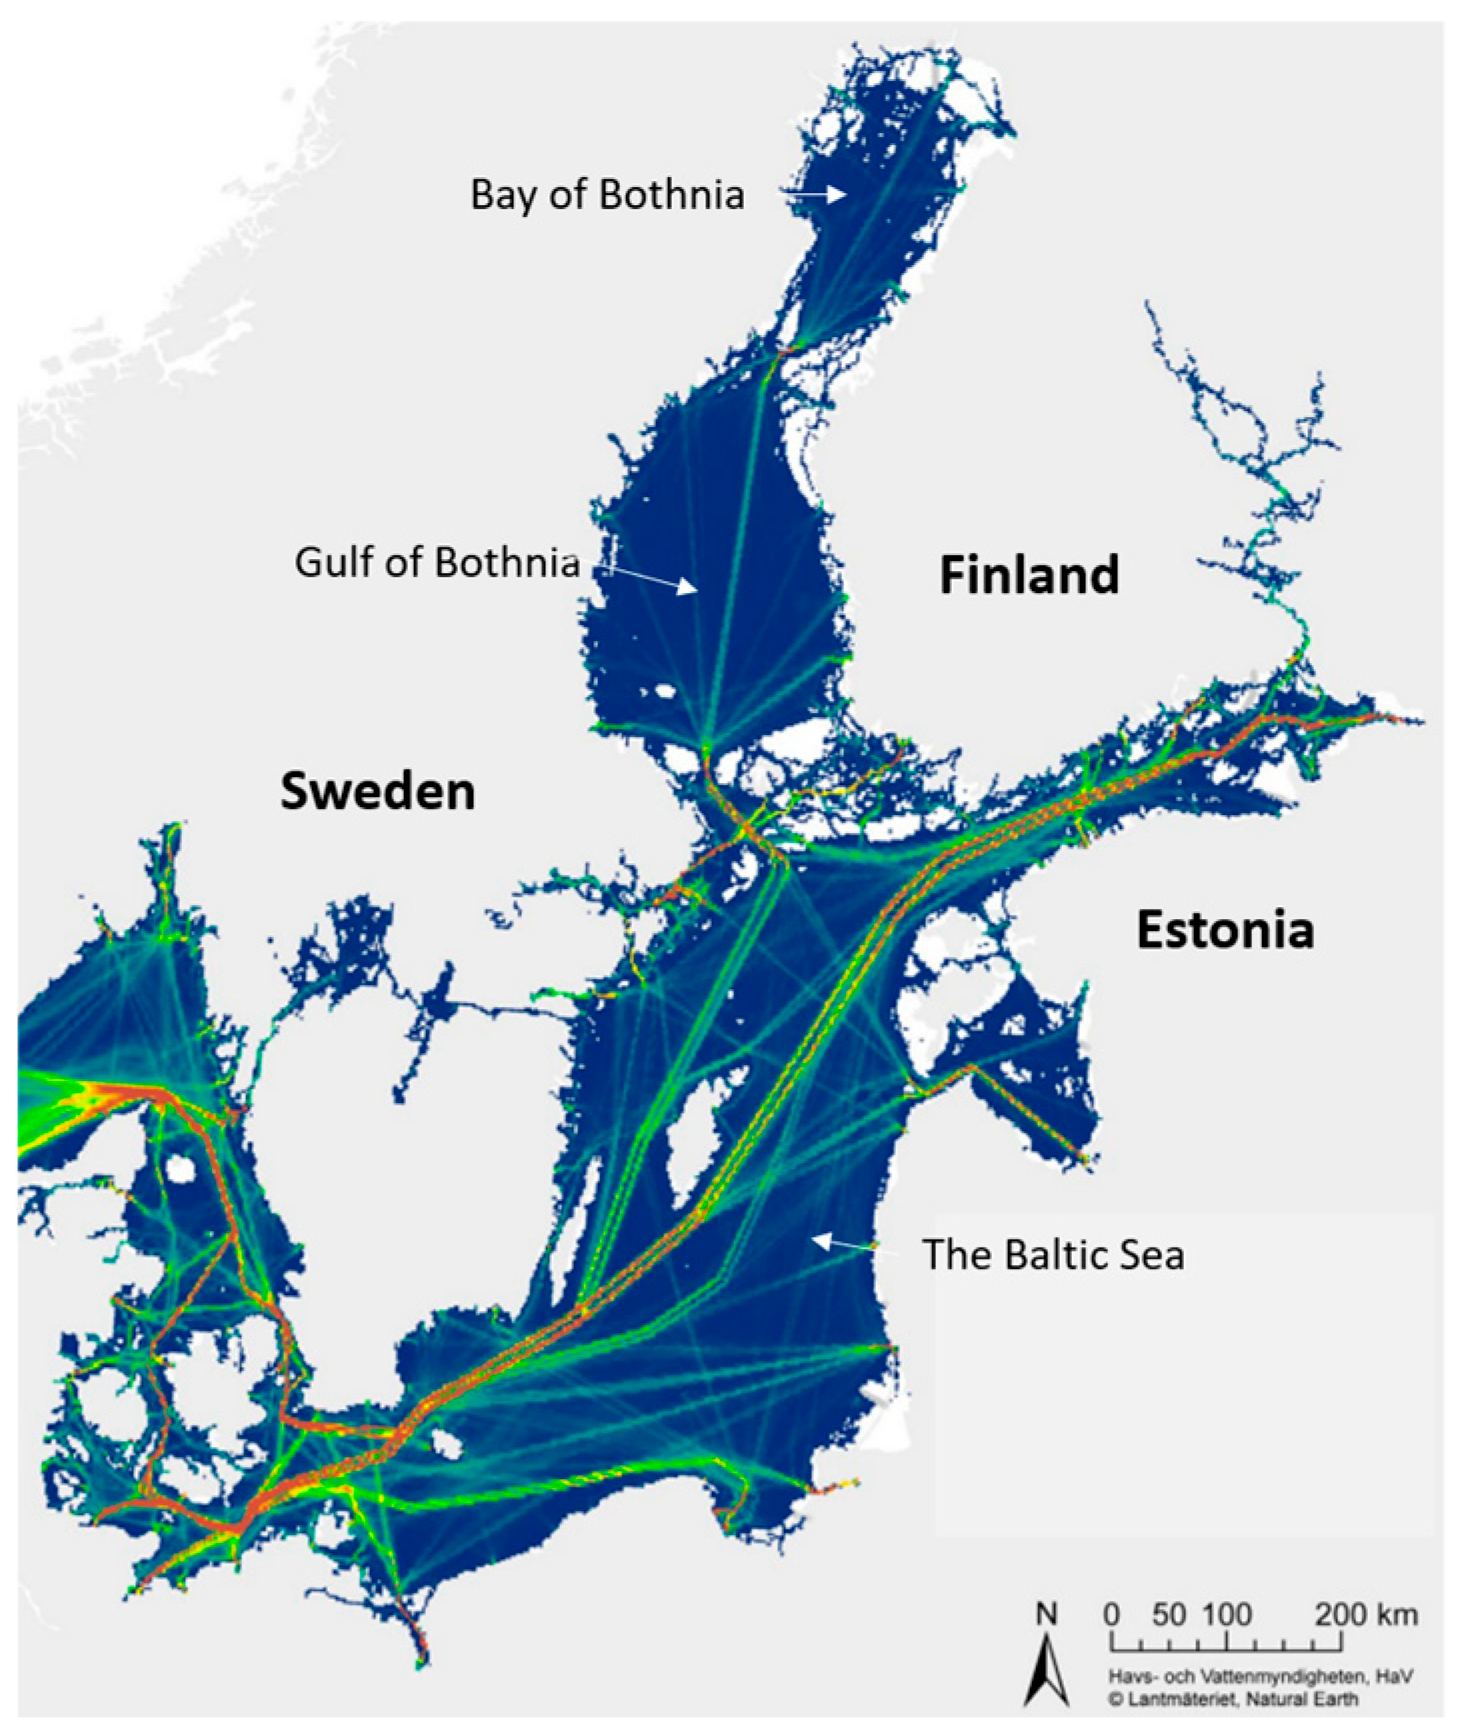
The global climate situation and UN’s zero emission goal for 2050 is, in Sweden, like elsewhere, leading to an increased pressure for new fossil-free energy production. Public resistance to wind turbines on land has increased interest in offshore wind farms. In the north of Sweden, the steel industry is today using large quantities of coal, but new fossil-free methods will use clean, electro-generated hydrogen. Future demand for electric power will by far overrun the present capacity. So, there is a huge pressure for new, close-range, offshore wind production, and several new wind farms are proposed for the Bay of Bothnia, which is located furthest north in the Baltic Sea (see
Figure 1).
In December 2022, the Swedish Maritime Administration (SMA) expressed concerns regarding plans for offshore wind turbine parks in the Bay of Bothnia. Presently, the SMA is handling over 60 applications for new offshore wind parks around the Swedish coast, but the ones in the Bay of Bothnia are special in the sense that these waters are covered with ice most winters [
2]. Sweden and Finland are sustaining the world’s second largest icebreaker fleet to keep the Arctic ports in the area open all year around. As can be seen by the ship traffic density map in
Figure 1, the traffic to the Bay of Bothnia is relatively limited in relation to traffic in the Baltic Sea. The number of vessels assisted by icebreakers in the Bay of Bothnia in the winter season 2020–2021 was 1095 ships, with 141 days of restricted traffic [
3].
The SMA points to a need to avoid letting wind farms become choke points blocking areas vital to cargo transportation [
2]. The direct tracks used during the summer season cannot always be used in the winter. When the sea is covered with ice, the routes must change to accommodate the ice situation. “Icebreaking is mostly about avoiding thick ice and if it is a severe winter the icebreaker must take the possible route. The ice is not static but dynamic and moves depending on meteorological circumstances,” Johan Wahlstöm, at the SMA, says [
4].
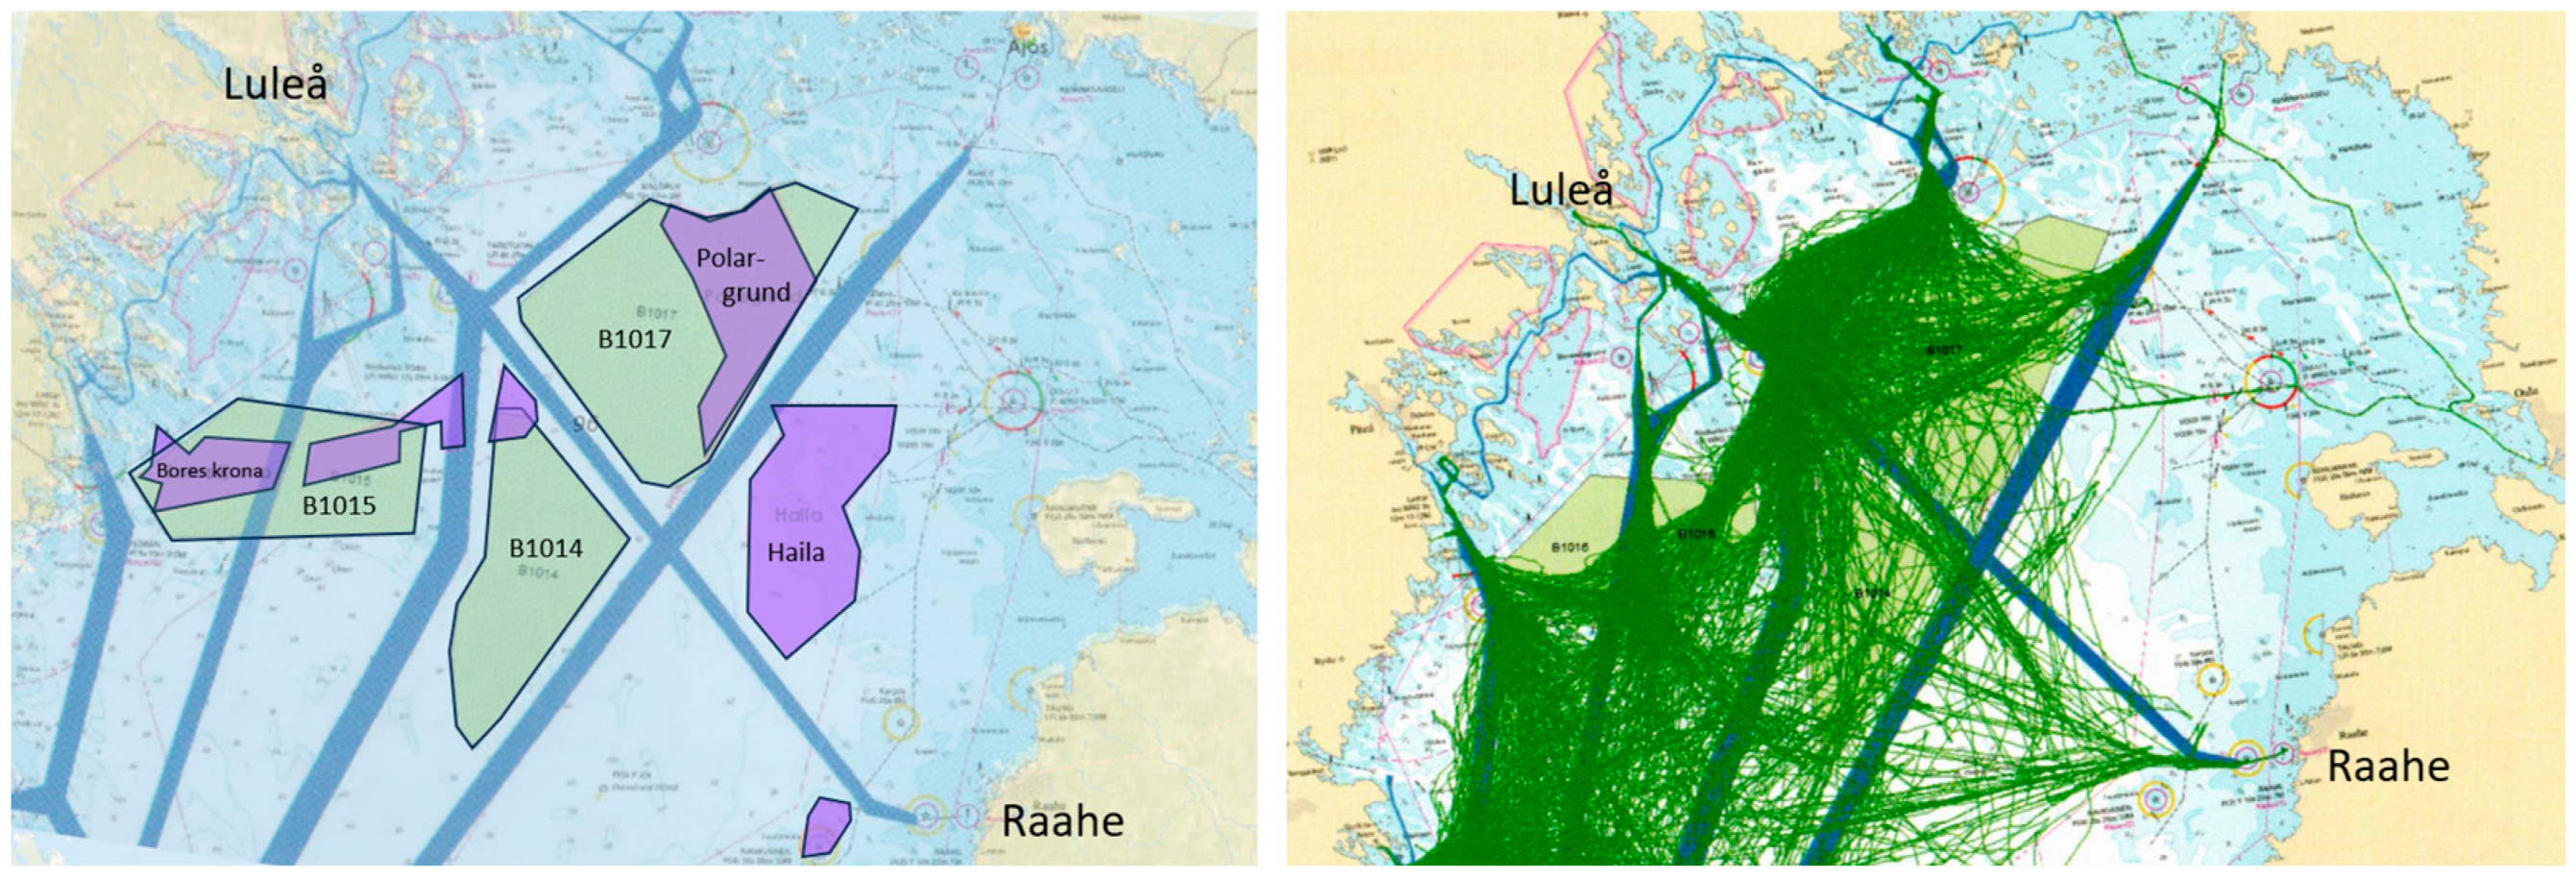
Figure 2 shows the northern part of the Bay of Bothnia with the big steel port Luleå at the top left in both maps. The left-hand map shows the summer tracks used as well as plans for new wind farms merged from Swedish and Finnish sources [
2,
5]. The right-hand map overlays the tracks of icebreakers during the 2022–2023 season [
2]. As can be seen, the tracks of icebreaker-assisted operations do not correspond to the open water ship traffic patterns in the left-hand map. It is an open question how wind farms will affect the icebreaker-assisted winter shipping in the Bay of Bothnia. Experience and research are lacking.
2. Present Winter Navigation in the Bay of Bothnia
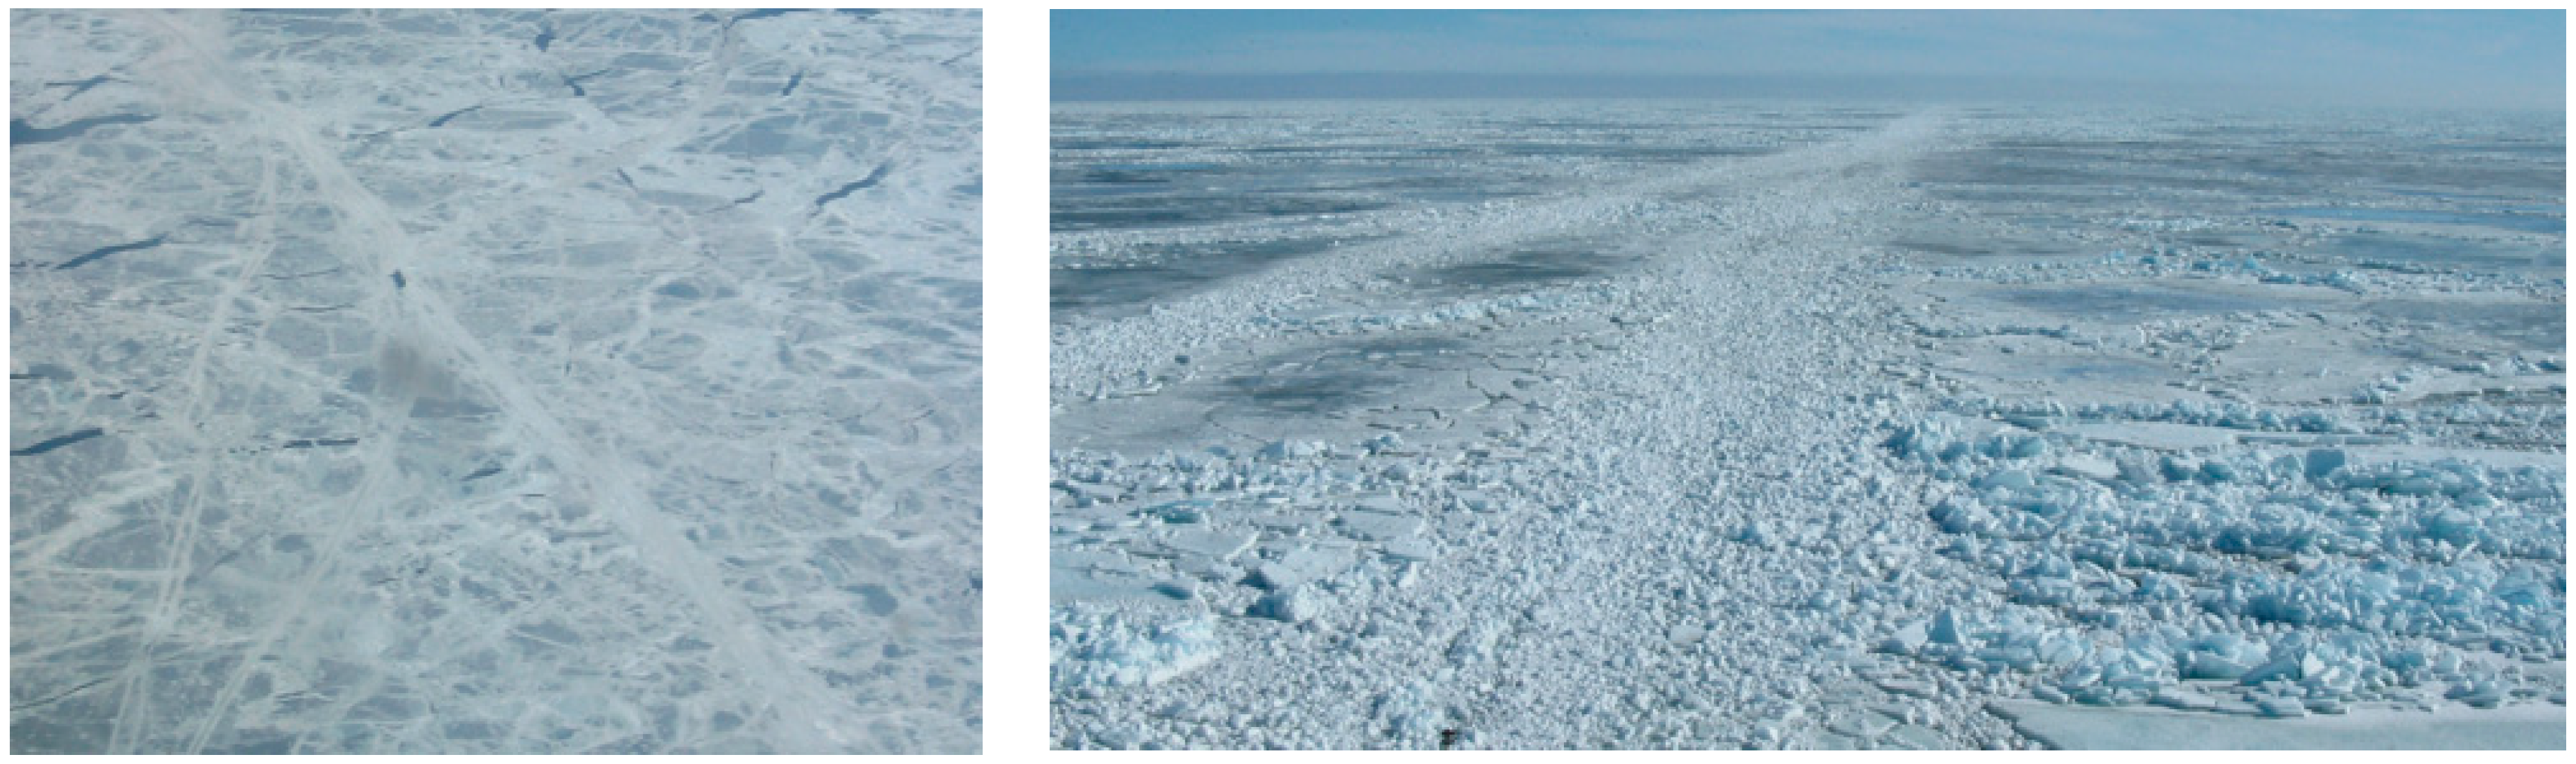
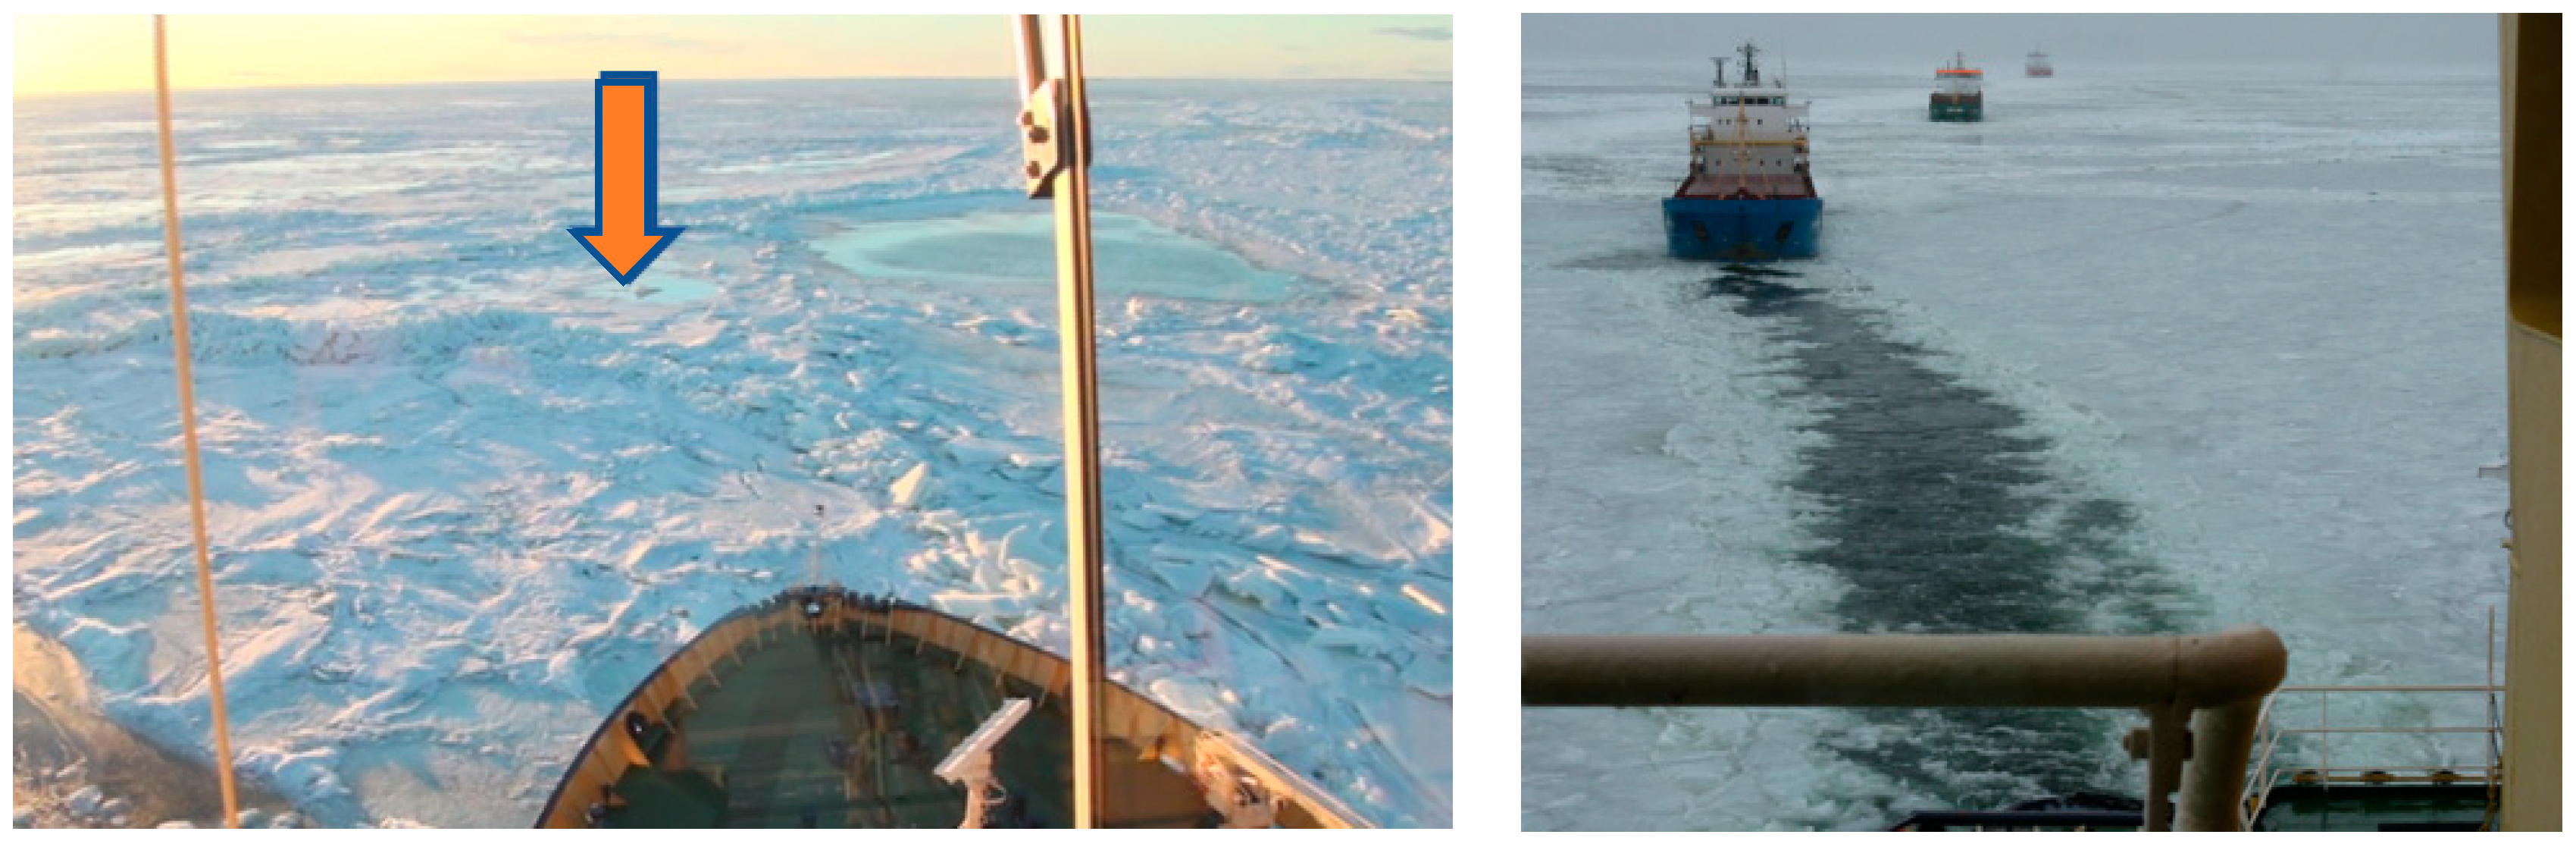
Winter conditions in the Bay of Bothnia generally start in December and last until May. During this time about nine or ten Swedish and Finish icebreakers assist ice-classed cargo ships to ports in this area. In April 2011, this author did a field study onboard the Swedish icebreaker Frej. The icebreaker service consisted of opening new ice channels in 30–55-centimeter-thick ice (see
Figure 3, left), breaking loose the ships that were stuck in the ice, assisting convoys of ships though ice channels (
Figure 3, right), and occasionally assisting single ships in heavy ice by notch towing.
All these situations were experienced during the field study which was undertaken in the EU project MONALISA Ice (MICE). The goal of the study was to collect user needs for e-Navigation in Arctic conditions [
6].
The Swedish and Finnish icebreakers in the Bay of Bothnia are coordinated and help each other. Each icebreaker or group of icebreakers has a limited area in which they are responsible for escorting ships. This gives them an opportunity to learn the local ice conditions. North- or southbound convoys of ships are then handed over from one icebreaker to the next as they transit through the ice. In
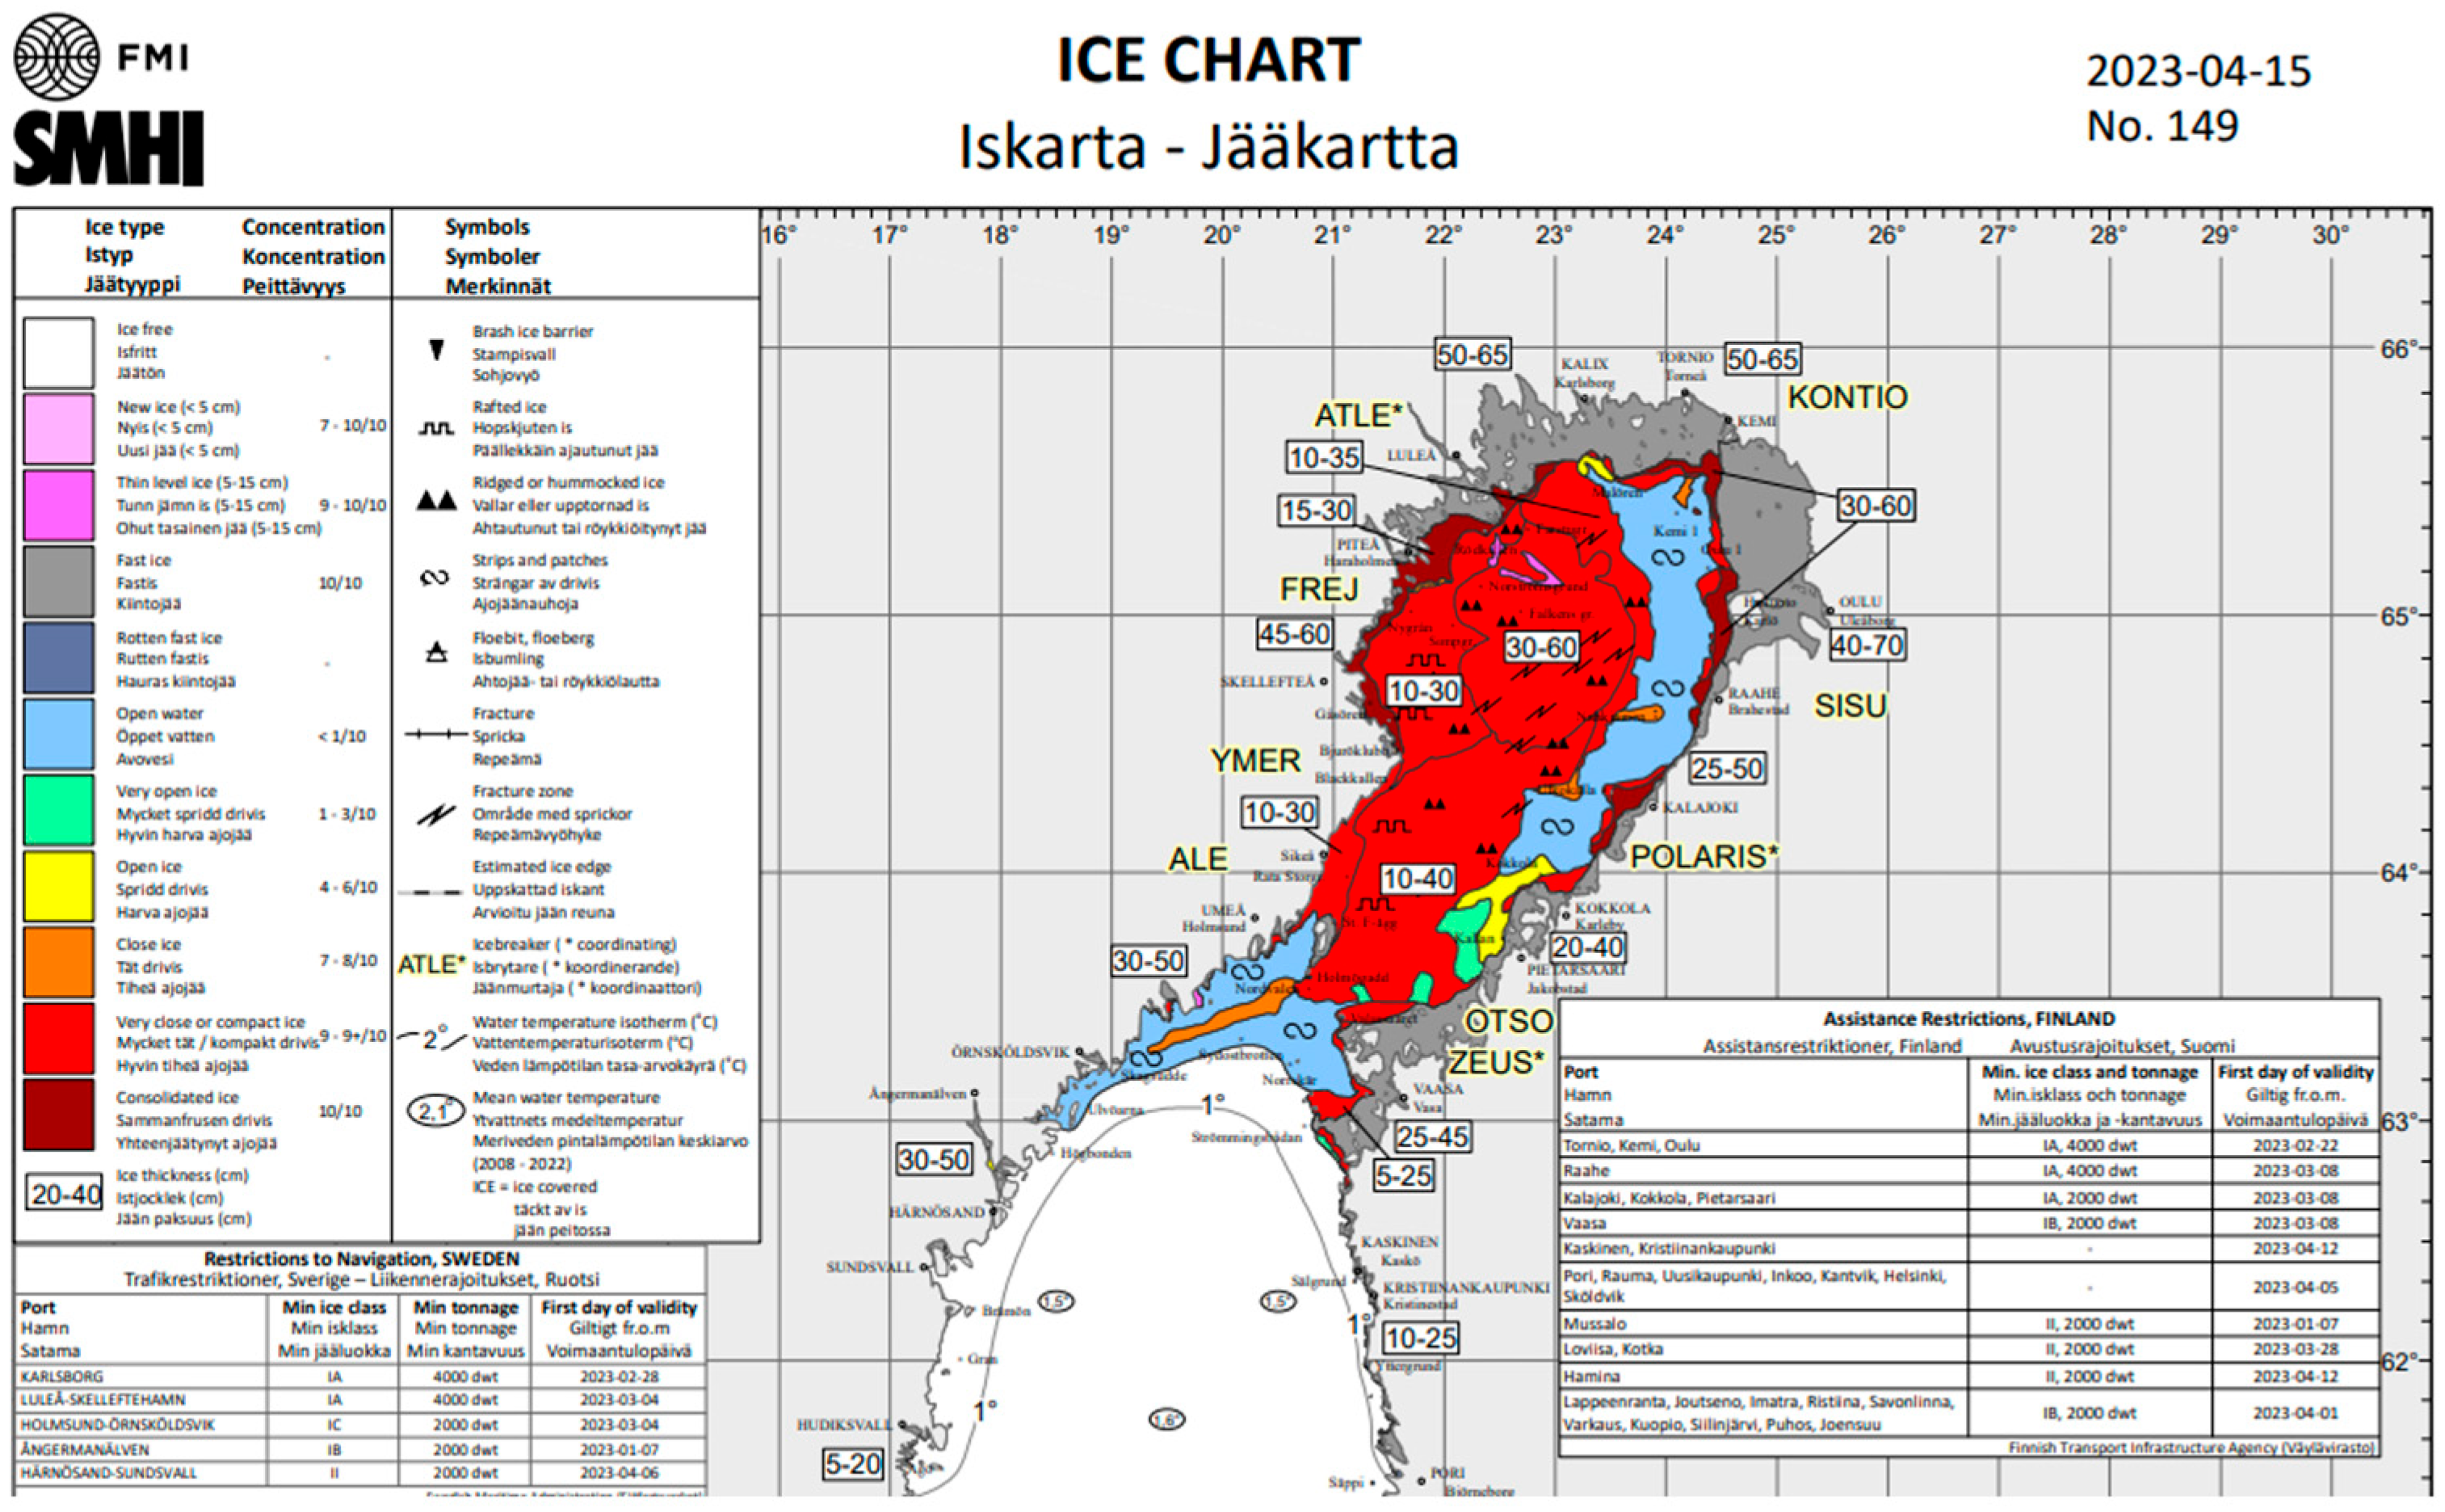
Figure 4, the ice situation in the Bay of Bothnia on the 15 April 2023 can be seen [
7]. The red color denotes severe ice (in this case, 30–60 centimeters thick in the central part of the Bay of Bothnia). The map also shows the areas where the Swedish icebreakers (Atle, Frej, Ymer, Ale) and the Finnish icebreakers (Konto, Sisu, Polaris, Otso, Zeus) are assisting. Note the blue “lead” of open water created on the Finnish side due to easterly winds pressing the ice sheet westwards. Though such a lead, ships can move without assistance. If the wind becomes westerly, the ice sheet will move back over to the Finnish side and a lead may form along the Swedish coast. Such an ice drift could be prevented by wind farms.
One important finding during the study in 2011 was the problem of finding the right, open, ice channel in the maze of old, abandoned and frozen-solid channels in the ice sheet.
Once the ships have passed through the channel, the crushed ice rubble floats back into the channel and fills the passage, and if the temperature is below the freezing point, immediately starts to freeze solid again. In
Figure 5, on the right, such an ice channel is shown. It is almost impossible to judge whether the channel is open and negotiable for a cargo vessel, or if it is an old frozen channel. Frozen channels are more difficult to break open and, in such cases, icebreakers often prefer to make a new channel by its side.
Even for the experienced eye, it is difficult to visually determine which channels are open and which are frozen solid. But the icebreakers had a trick. During the study, I noticed that they, besides their ordinary Furuno ECDIS, used an Adveto system which could record their own or other ships’ AIS tracks in high resolution in a local database. By uploading a part of such a historic track, they could use it as a “footpath” through the ice. Often, the ice, with the track, could have drifted since their last passage, but it would still give a general clue as to the latest, still open, channel (and with the added value of developing a hunch for the movement of the ice sheet).
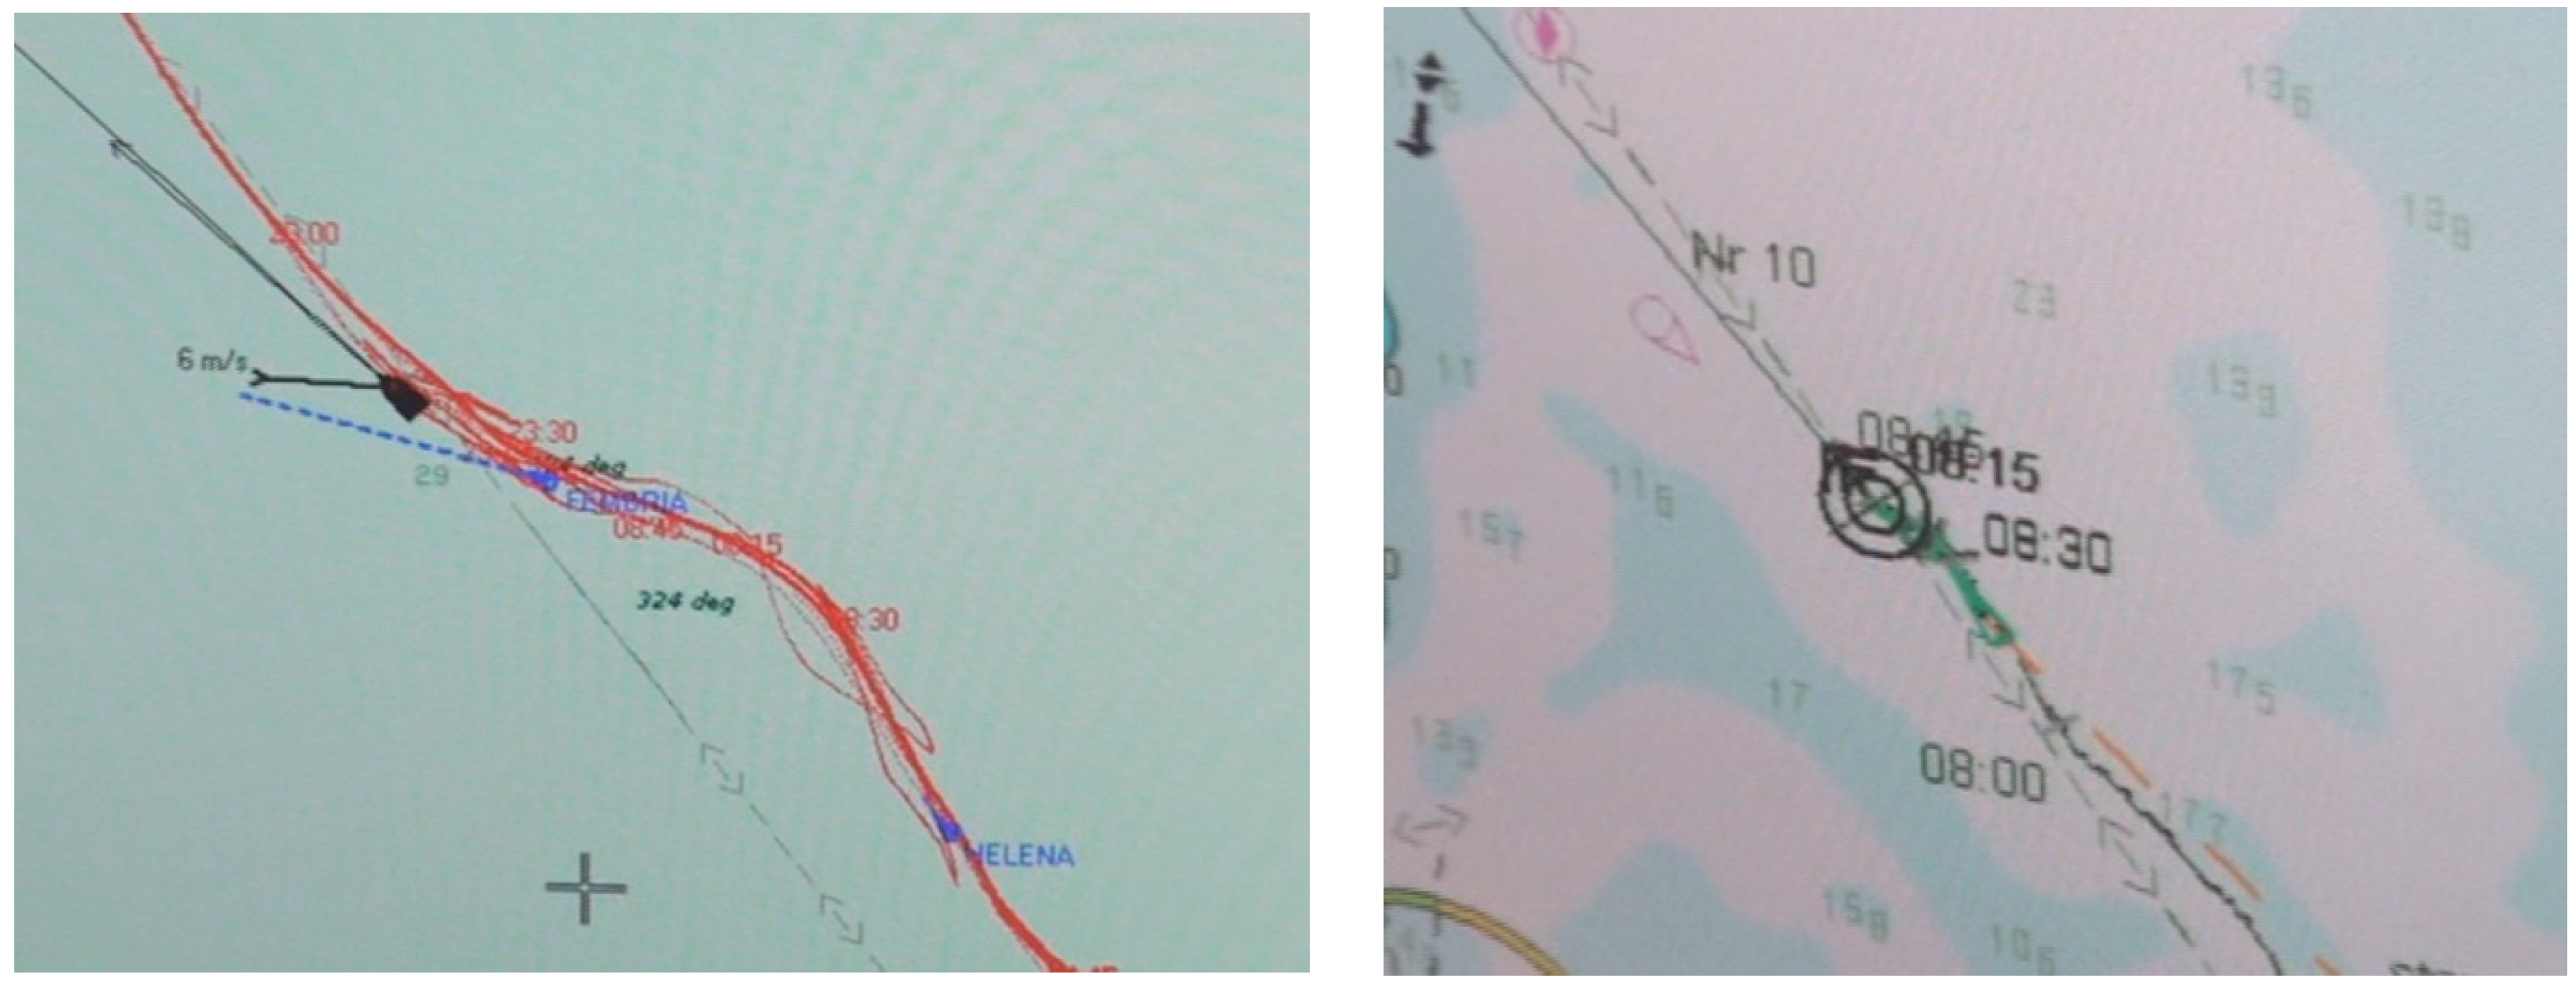
In
Figure 6, on the left, a screenshot from the Adveto system can be seen. The time is a little before nine in the morning; Frej has been freeing two ships (the Fembria and the Helena) from the ice (the historic track from his—icebreakers are always “he”—maneuvers loosening the ship can be seen) and the icebreaker is now leading the convoy through the ice using his own track from about 2300 h the night before. In this case, the ice has drifted some 50 m to the NE. In
Figure 6, on the right, the situation (a little earlier) can be seen on the icebreaker’s regular Furuno ECDIS screen. This system had then no possibility to display historic tracks in the same way as the Adveto.
A wish expressed by the bridge officers onboard Frej in 2011 was an ability to cut out a relevant snippet of their high-resolution historic track and send it addressed to a particular ship so that they could amend it to their active route in any ECDIS, allowing them to follow the open ice channel by themselves. In that way, the bridge officers said, the icebreaker could park in the middle of their area and function as a traffic center and only need to fetch the most vulnerable ships [
6].
3. Planned Wind Farms’ Potential Influence on Ice Navigation
To prevent offshore wind power becoming an obstacle to shipping, it must be designed with regard to shipping conditions. A full expansion will have major consequences for shipping, the SMA says [
10]. Shipping and offshore wind farms could coexist given the right conditions and considerations. The ships that transport goods daily between the harbors in the north normally sail along predefined tracks, but when the sea freezes, the conditions become different. Ice breaking is mostly about avoiding thick ice, and during a severe winter, the icebreakers must use the route that is possible. “Work with the ice, not against it” Captain Johan Buysse recommends in the Nautical Institutes practical guide to the handling of ships in ice [
11].
The effects of wind farms are twofold: the ice pressure will affect the turbine foundations (an engineering problem) and the turbine foundations will affect the movement, structure, and behavior of the ice sheet (an ice navigation problem).
3.1. Effects of Ice on Solid Structures
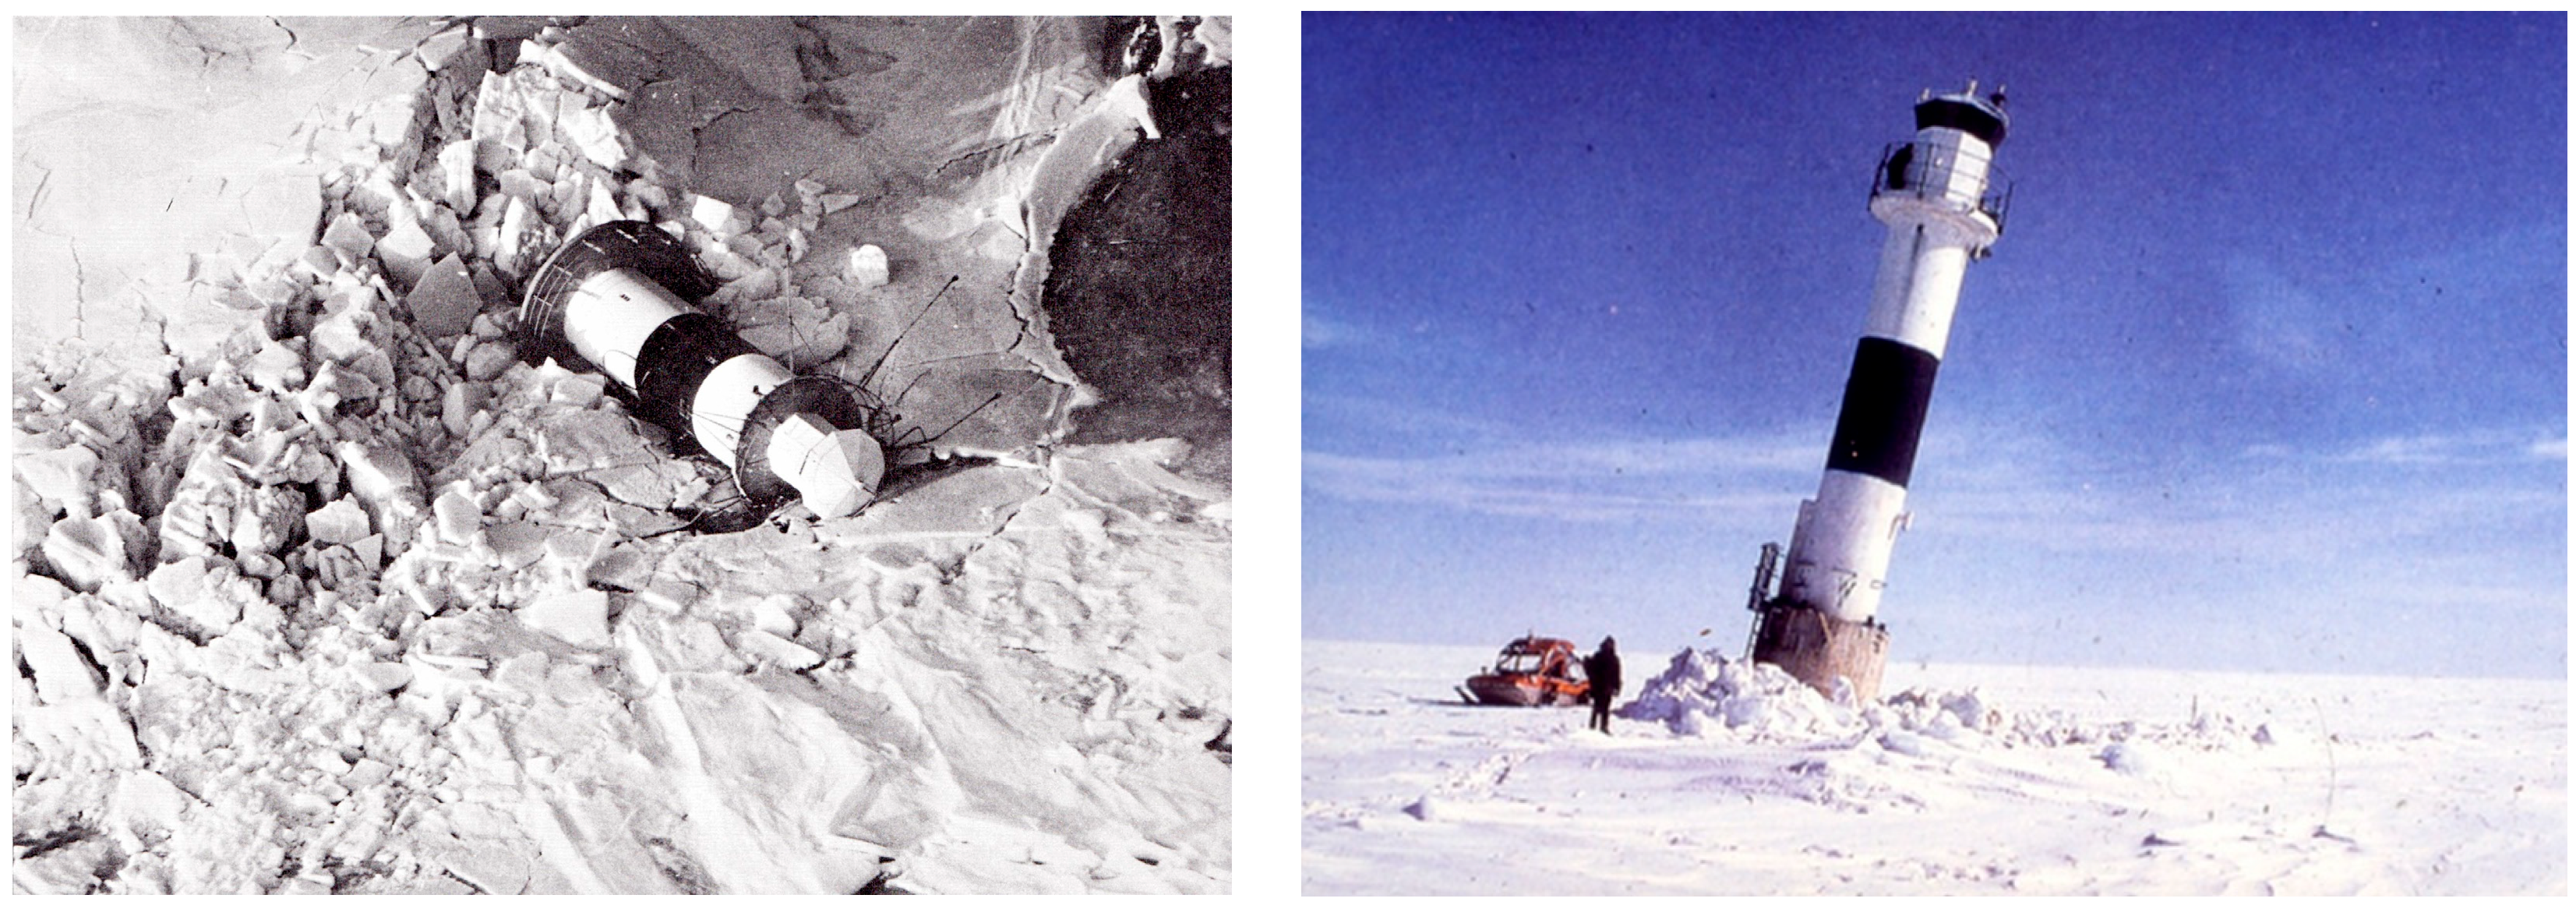
A good understanding of ice conditions and ice loads is essential for the proper construction of the foundations for offshore wind power [
12]. The applied practices behind the design of bridges, lighthouses, and other offshore constructions were originally created without much knowledge of ice mechanics. Now, experience has been gathered for a long time for ice-exposed constructions close to land. The design of bridges has, for instance, not caused any essential setback, whereas a few small lighthouses have been damaged [
12] (see
Figure 7).
Some research on solid offshore deep water structures in ice has been conducted, but there is a large gap of knowledge. The recent plans for wind farms in the Bay of Bothnia have sparked research projects in Finland and in Sweden. The greatest dangers seem to be attributed to ice ridges. The thickest ice ridge that has been recorded in the Bay of Bothnia was 28 m deep, but is normally 10–20 m. [
13].
Ridges are usually present in all ice-covered sea areas if the ice concentration is high enough. Ice ridges are very common ice features in the Baltic Sea area [
14].
First-year ice ridges are elongated accumulations of broken ice floes. Ridges form when sea ice deforms and fractures due to driving forces from winds and sea currents. In that process, large sea ice flows are compressed or sheared against each other, causing the ice to fail into smaller pieces, forming a ridge. Ice rubble is a result of the crushing and flexural failure of ice during the ridge formation process. A compression ridge is often highly irregular, both in direction and in vertical height. A shear ridge is normally very straight, because separate ice fields move laterally in opposite directions. A ridge contains a large number of ice pieces of varying sizes and shapes that are piled arbitrarily, and they float in the seawater [
15].
After ridges have been formed, they drift due to wind and sea current. When a ridge collides with an offshore structure, it introduces a significant load on the structure.
3.2. Effects by Solid Structures on Ice Drift and Structure
From what I understand, the formation of ice and ridges are very complex and difficult to model. How constructions of many hundreds of turbines—present-day plans include more than 600 wind turbines for the Bay of Bothnia [
5]—will affect the ice formation is not yet known. Two scenarios seem obvious: The ice floes or thin newly formed sea ice, propelled by the wind and current, will continue to drift past the turbine foundations which will act as icebreakers and open up channels in the ice. On the leeward side of the turbine foundation, new patterns of ice formations will appear, forming ridges or ice channels. Different interference patterns may also form. There is no research on this yet, to my knowledge. When freezing continues, the ice sheet will grow thicker and, at one point, it may be too thick for the turbine foundations to break. Then, we come to the other likely scenario.
At some point, the ice will become so strong that the prevailing wind or current can no longer exceed the force needed for the turbine foundation to keep breaking the ice. The whole ice sheet might then become fixed, “nailed” in position by the turbine foundations, and may resemble fast ice.
Or, it may be a combination of these two scenarios depending on sea and air temperature, along with wind and current direction and speed.
In the first case it is possible that the creation of many more ice channels may increase the formation of ice ridges, making the ship channels between the wind farms more difficult to negotiate. But, it may also be possible that, as in the second scenario, a fast ice sheet, held in place by the wind turbines, may cause a more stable situation and keep negotiable ice channels in place for longer periods of time, thus facilitating ice navigation.
The leads of open water which today are formed along the Swedish or Finnish coasts on the windward side, depending on the wind direction, may cease to exist in the same way if the ice sheet becomes fixed by the wind farms.
4. e-Navigation and Route Exchange for Ship Traffic in Wind Farms
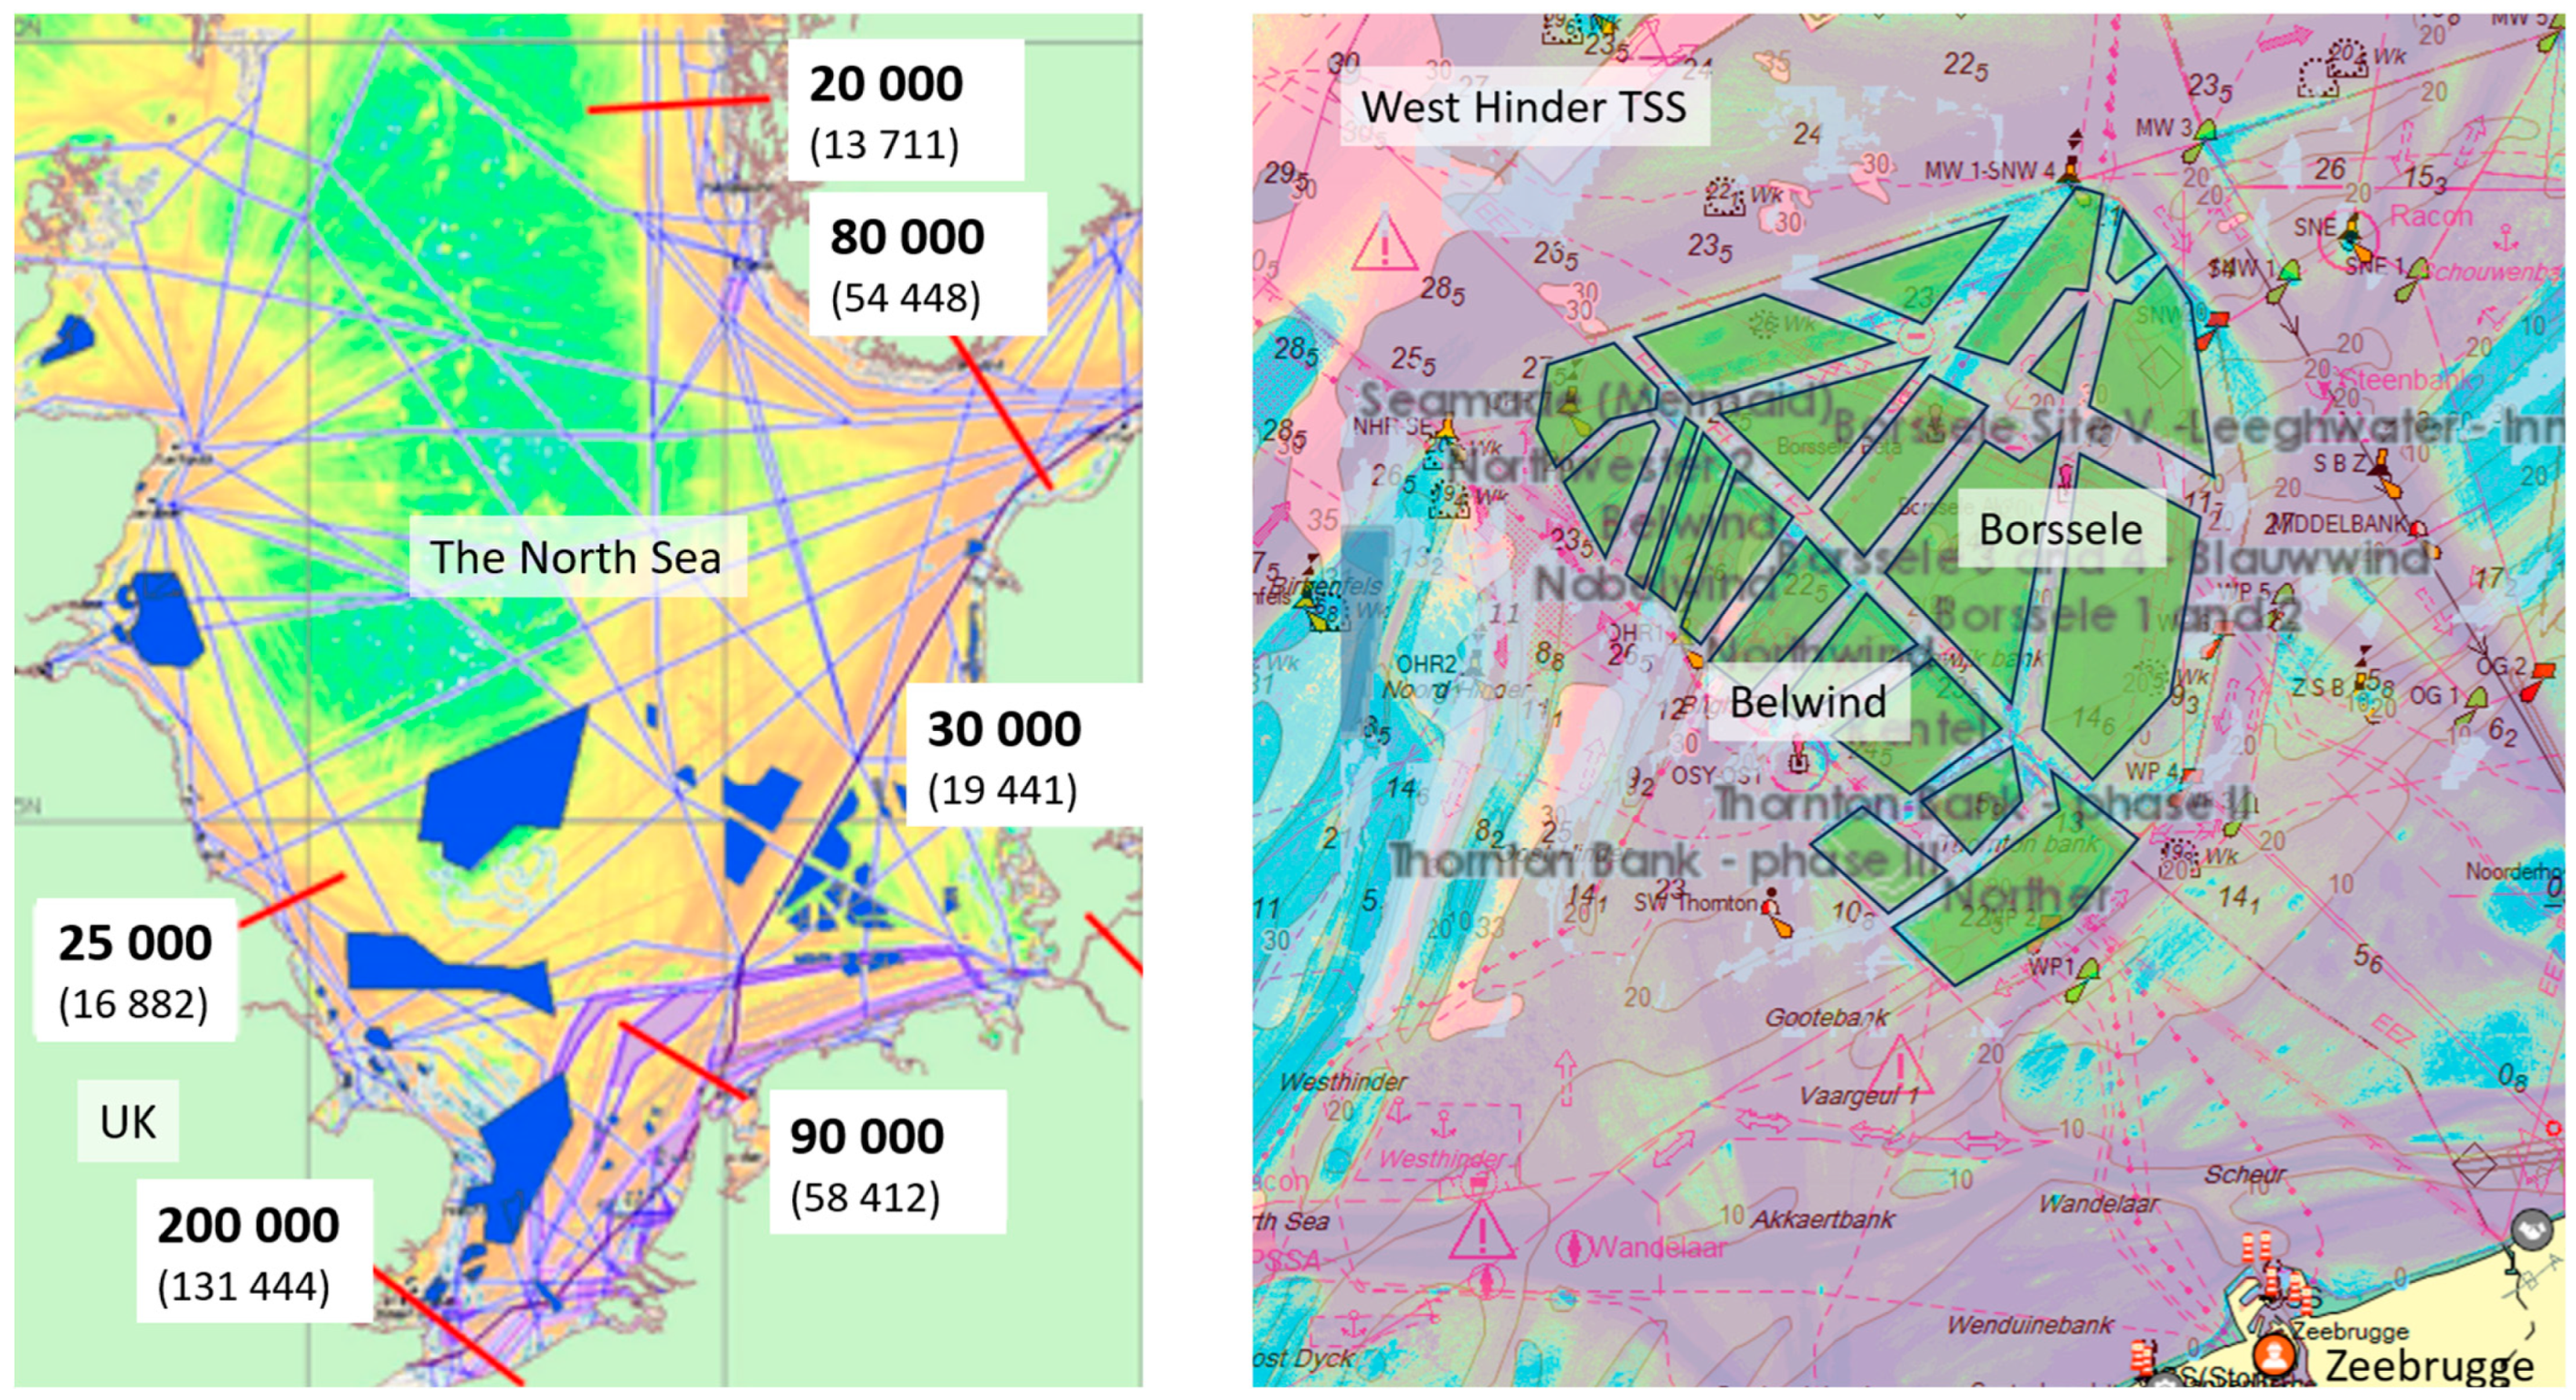
In the ACCSEAS project (2013–2015), we saw plans for offshore wind farms appear in the English Channel, much to the surprise of the shipping community. In
Figure 8, on the left, is an image from an article published 2013 in the ACCSEAS project [
16]. At that time, very few wind turbines were yet built; but, the plans were amazing.
In
Figure 8, on the right, the present situation off the Belgian and Dutch coast today is depicted. We see the Belgian Belwind wind farm, and the Dutch Borssele farm.
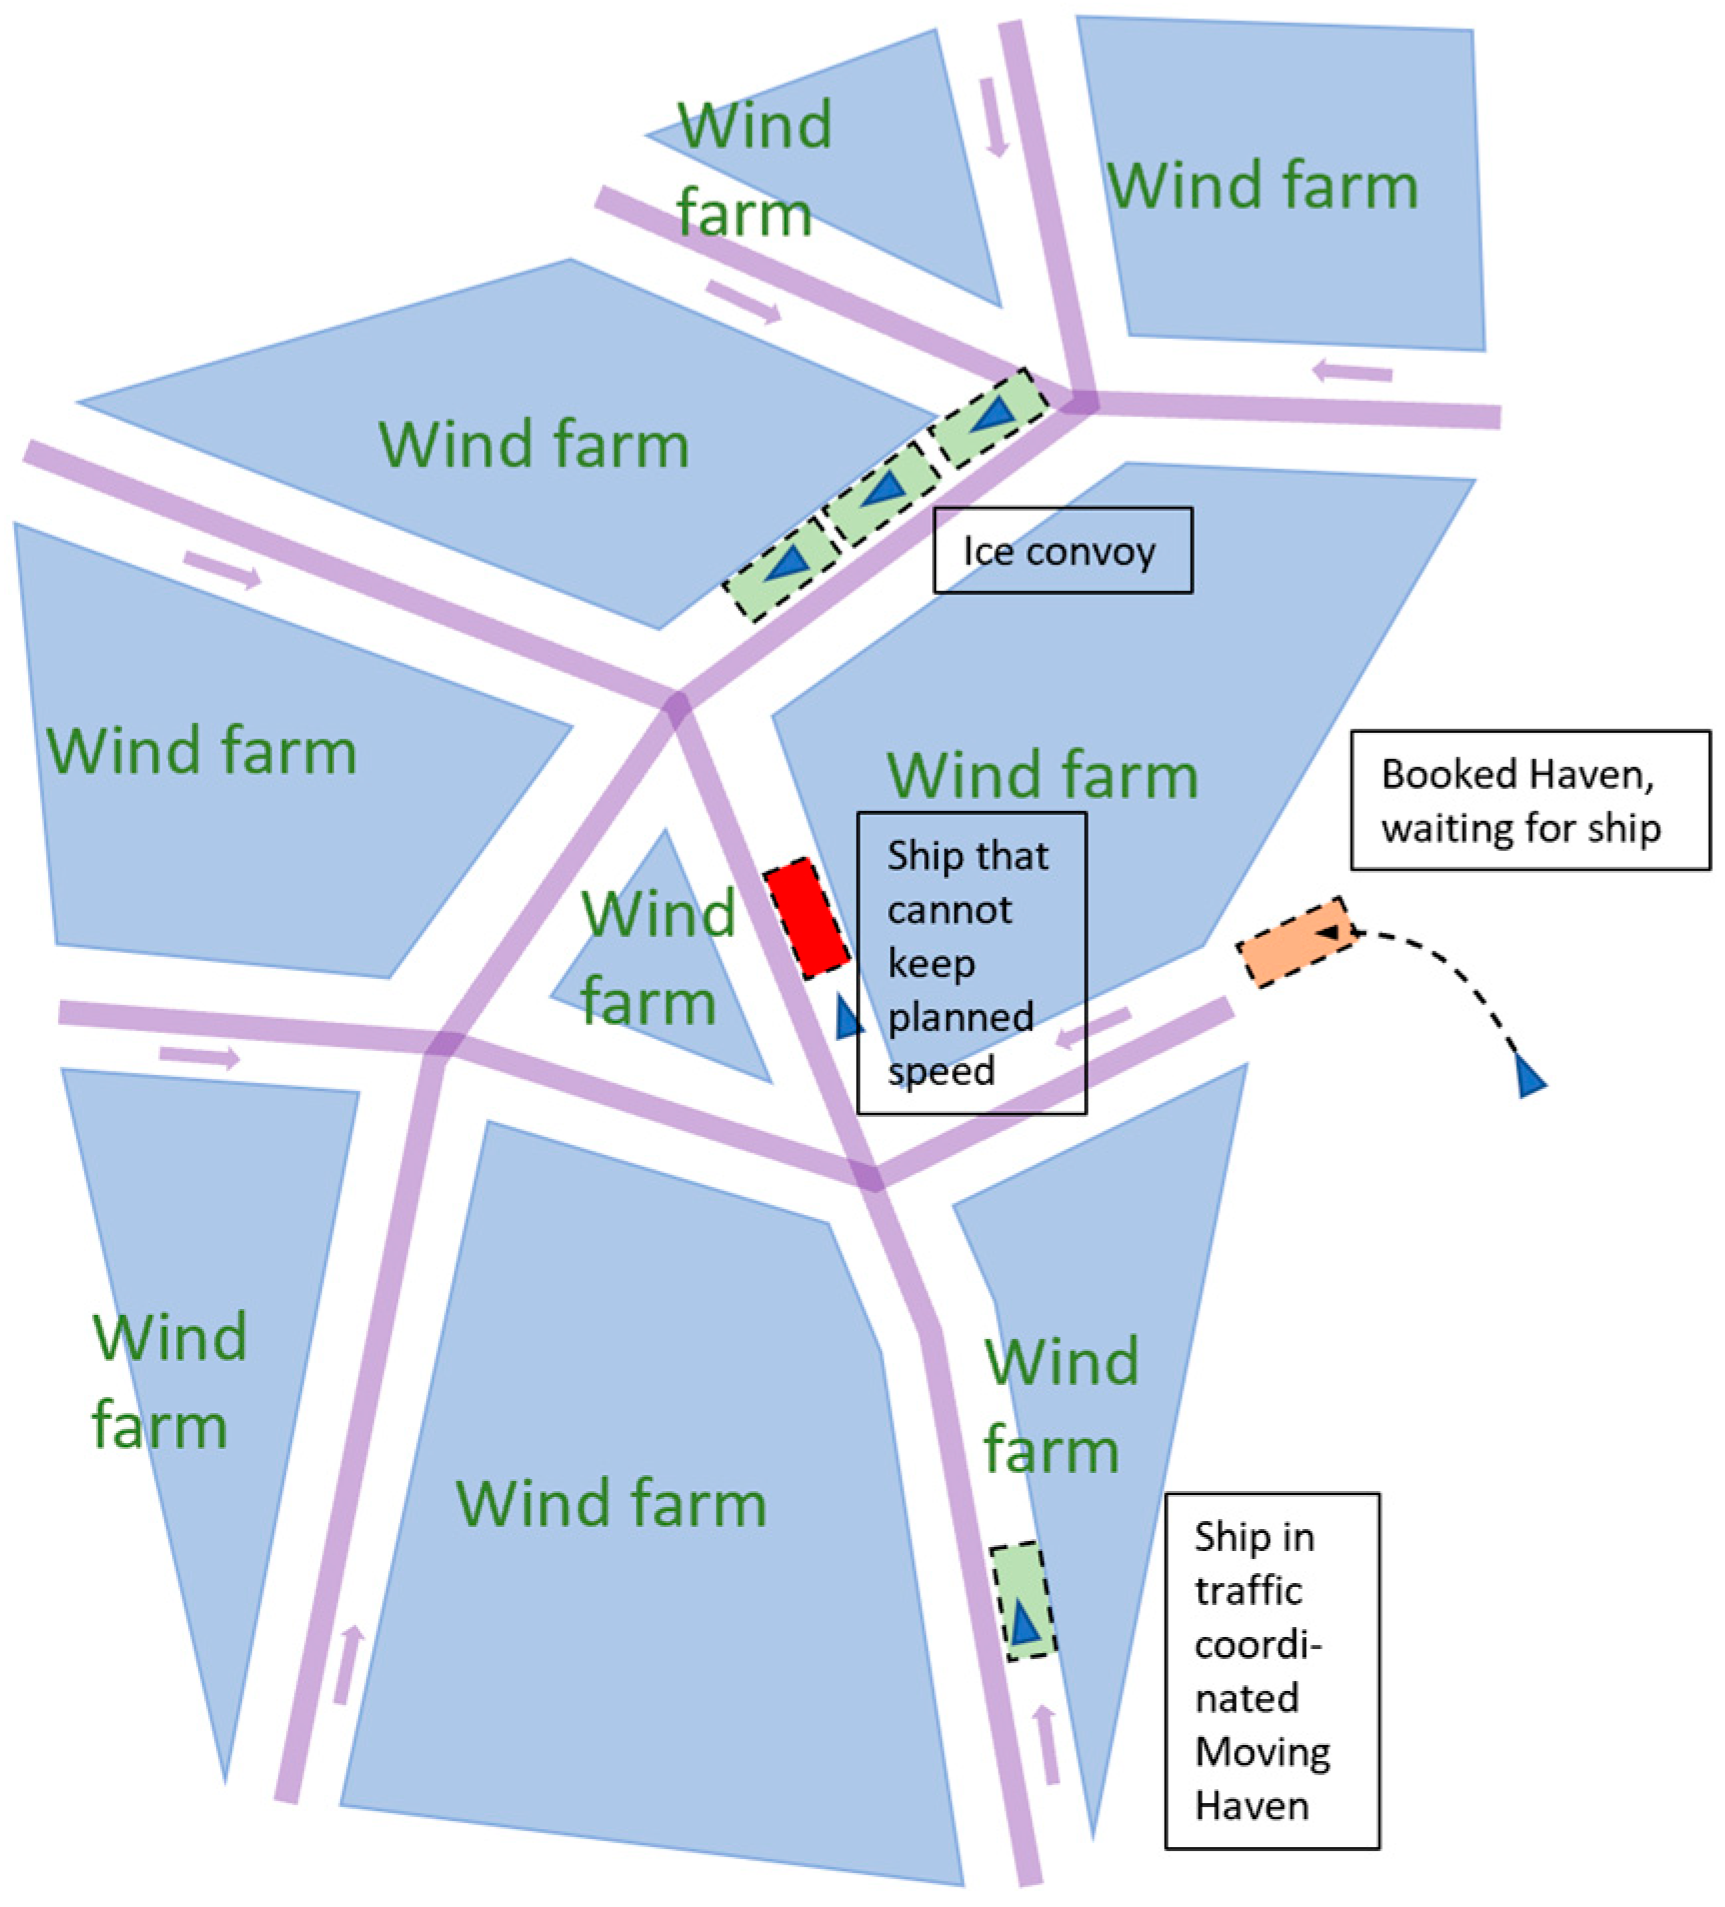
With a standard safety zone around each wind turbine of 500 m and each turbine in a grid 1000 m apart, an offshore wind farm creates a completely closed NoGo zone for ships (the green areas in
Figure 8, right). Instead, shipping is confined to street-like conditions in corridors of varying widths in between the wind farm areas. This is good enough for normal weather, but what happens when extreme weather forces ships to head into wind and waves from whatever direction? Most likely, traffic will need to be organized and coordinated in such a way that “traffic lights” at each junction will not be necessary.
Is it possible that the situation in the Bay of Bothnia might end up like the sketch in
Figure 9? Where the white areas are traffic-separated shipping routes and the blue areas are NoGo areas for wind power or fish farming? In such a street-like traffic environment, ship traffic must be coordinated to a much higher degree that before. And what happens during winter conditions? How will the wind farms affect winter traffic? Some tools are already available today in the form of route exchange, investigated in projects previously mentioned here, and presently in the STM and the Balt Safe projects.
Route Exchange and Moving Havens
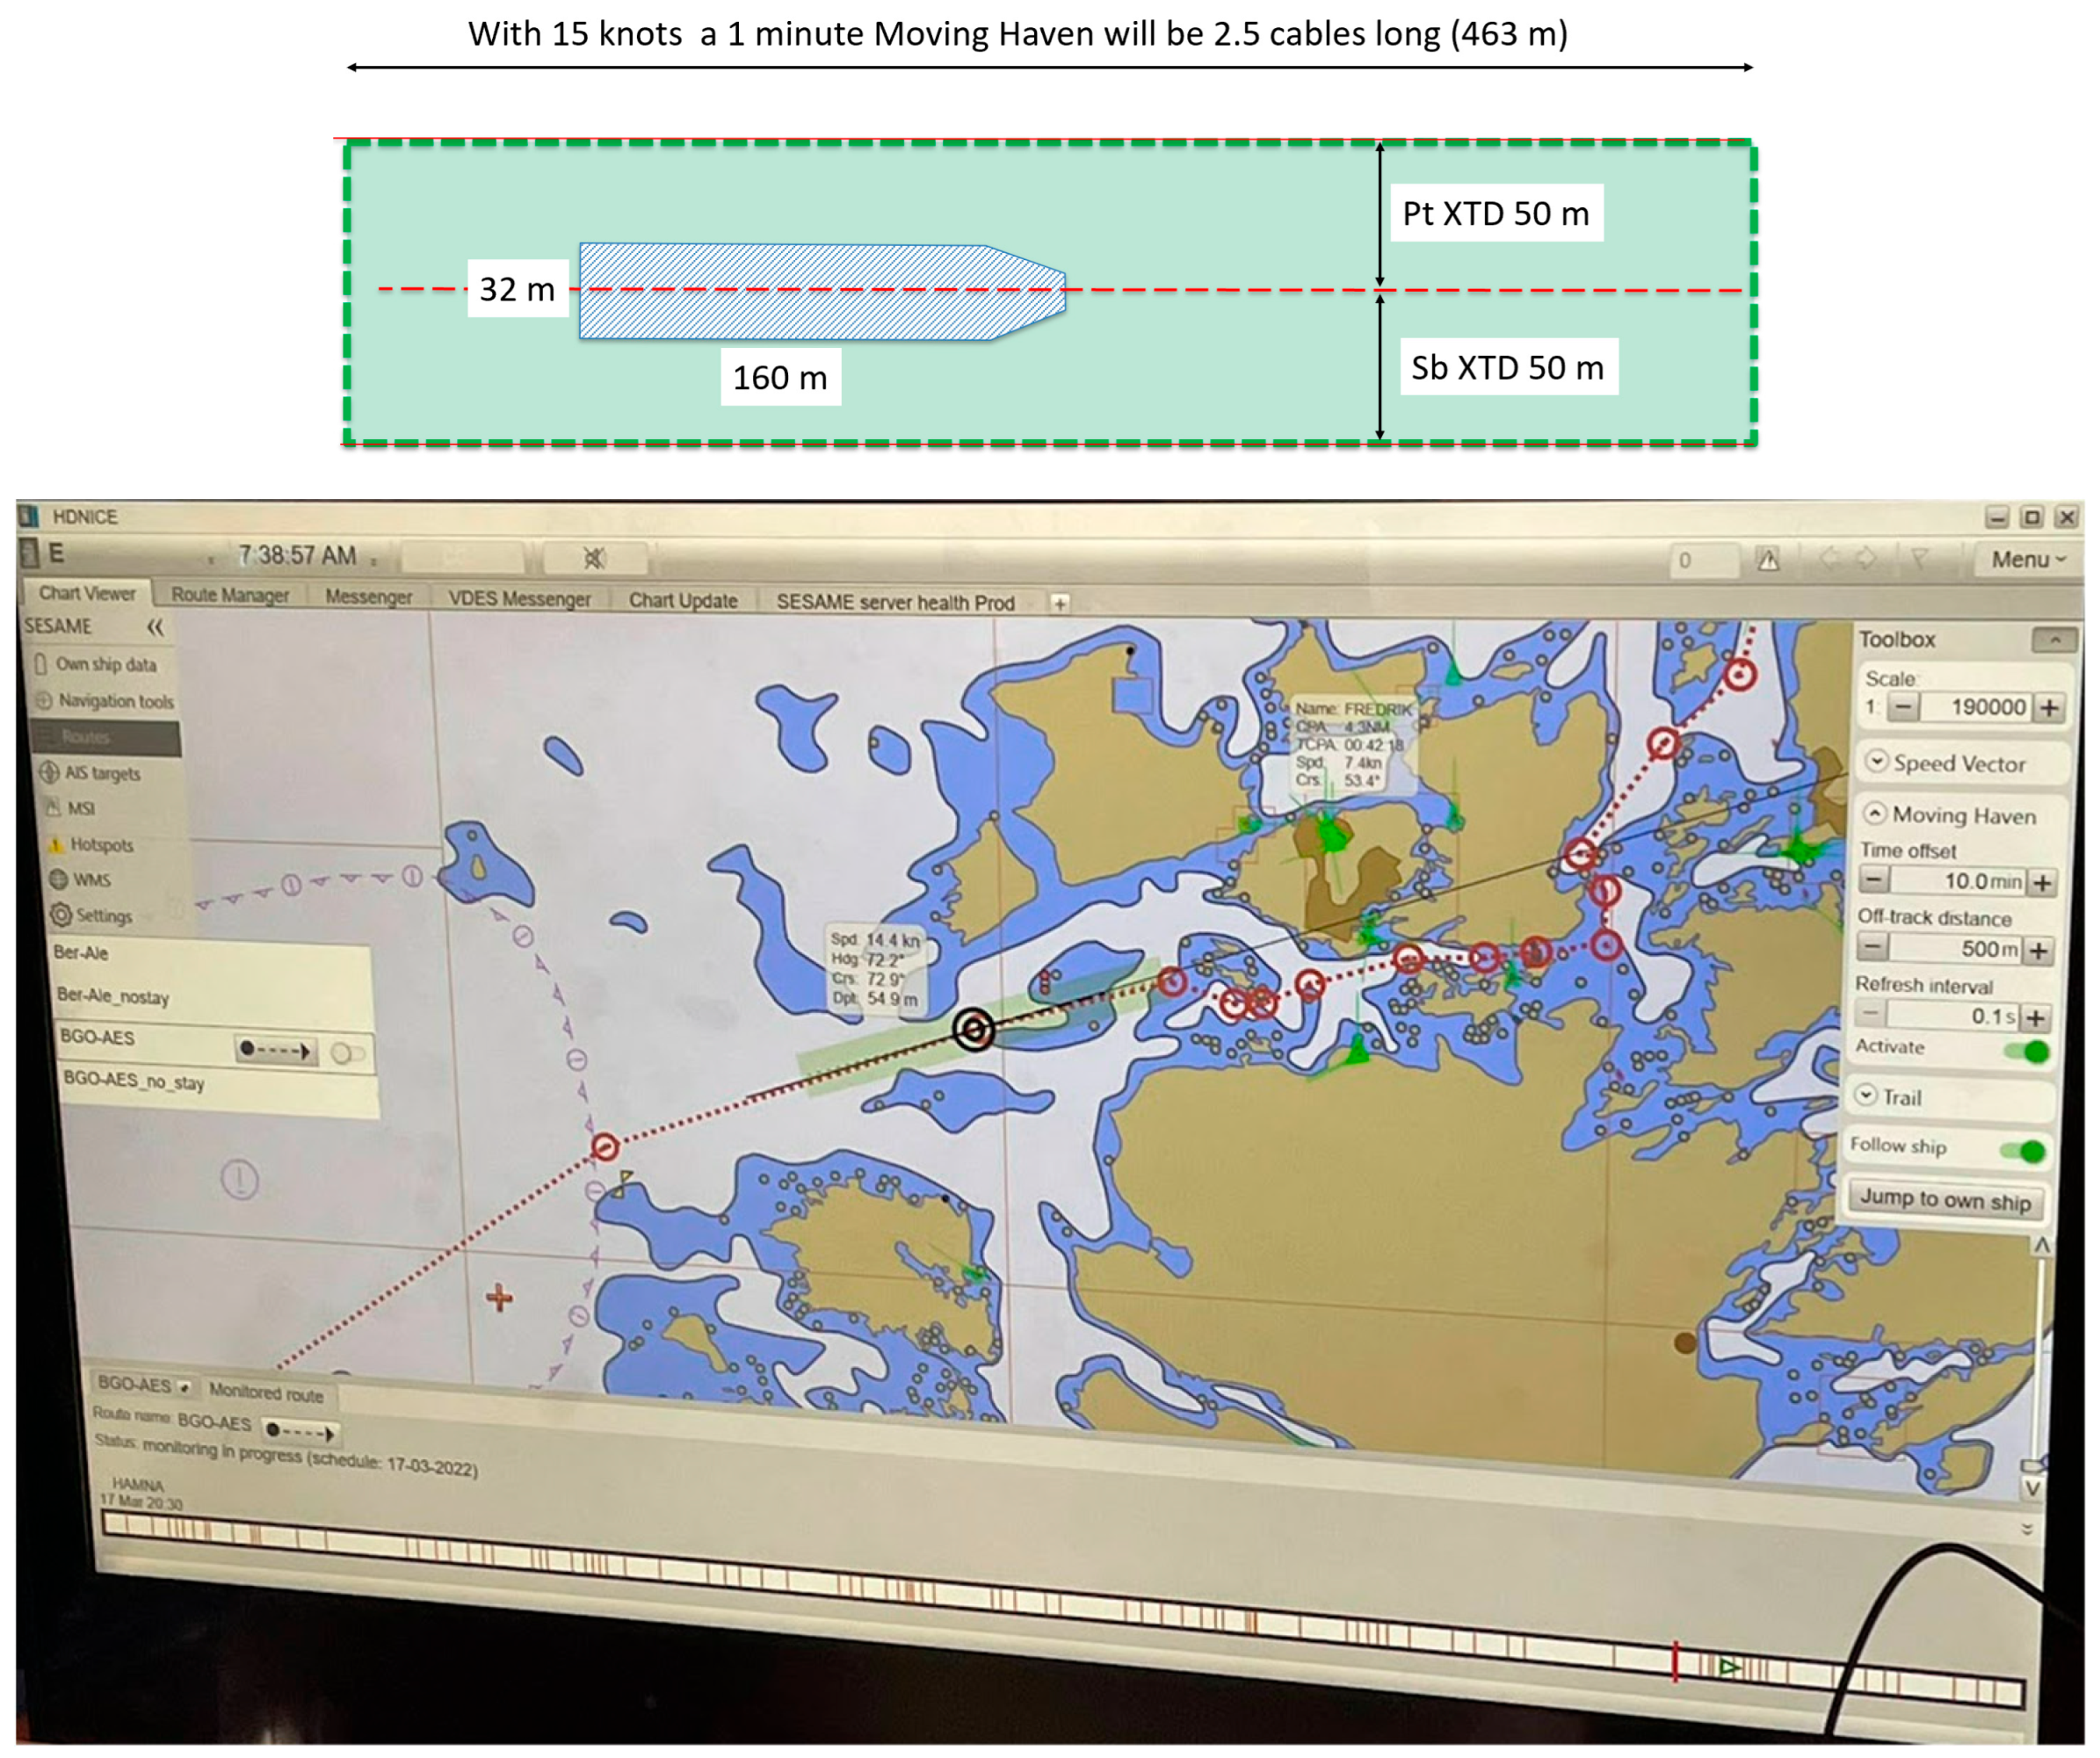
All ships sail in accordance with a voyage plan. IMO regulations mandate ships to make a voyage plan “from berth to berth” before leaving the port of departure. This voyage plan also contains an estimated time of arrival (ETA) at the destination. The voyage plan must be programmed into the electronic chart system (ECDIS) and can thus be visualized as a dotted line on the chart display which the watch officer should sail along. The ETA at the destination is used for the booking of pilots, locks, and linesmen. To keep your final ETA, you have an implicit ETA at each waypoint along the route. This can include speed changes. Given this, you can visualize the position where you need to be at each moment during the voyage with a box, a “Moving Haven”, that keeps moving in you chart system. By keeping your ship inside the box, you are on track, and on time. A theoretical example of how a Moving Haven with a time precision of 1 min is shown in
Figure 10, on the top [
18]. What it can look like in an experimental ECDIS is shown in
Figure 10, on the bottom. Moving Havens can be used as an organization tool for ship traffic in wind farm areas.
5. Discussion
What will the future look like and how can we prepare for it? These are questions that research is constantly trying to answer. We have half a century of experience with navigating in ice with icebreakers, but how wind farms with fixed foundations will influence ice behavior and ice navigation we have next to no knowledge of. We know for certain that climate change will come, and with it a huge need for fossil-free renewable energy production. Maybe ice in the Bay of Bothnia will not be a problem in the future? We do not know. But we know that extreme weather will come more often. Research must in any case continue to gather knowledge, identify potential problems, and suggest solutions.
Traffic coordination using slot-thinking where the bridge officer is reduced to an actuator whose job is to keep the ship in a box on a screen will be annoying to many. But, tomorrow, some ships might sail automatically, and then it will be highly interesting to be able to exactly predict their future movements.

