Abstract
We describe the degradation states of vegetation using a CMOS camera with NIR narrow band filters. Infrared bands provide vegetation parameters through reflectance, such as the water content and the cell order inside the leaf. Therefore, we can observe cellulose decomposition. We observe these parameters by measuring the differential reflectance between 766 nm and 1064 nm. We conclude that the NIR narrow bands add essential information to distinguish the water content and the decomposition of vegetation.
1. Introduction
The spectral analysis of vegetation is a suitable topic in forest preservation. Moreover, the spectral analysis of vegetation is relevant to monitoring the growth and health of crops, and their use as biofuels. A common technique used for establishing the vegetation indexes is through reflectance measurement [1]. The disadvantage of this method is computing the indexes via the relationship of two bands using other relative values [2]. We are interested in measuring the radiometric spectral reflectance to quantify the state of the vegetation in energetic terms.
In Figure 1a, we see the spectral signature of the widely known dry and healthy vegetation in remote sensing. A significant change occurs in the visible range (450 nm–680 nm) due to the photosynthetic pigments, but this is not our focus. In the near-infrared band (680 nm–1500 nm), we see changes in the reflectance but they retain the main features of the cell structure via the cellulose and lignin, as shown in Figure 1b.
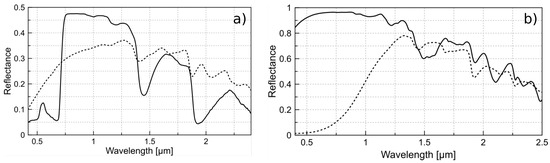
Figure 1.
(a) Typical reflectance of healthy (solid line) and dry (dash line) vegetation; (b) reflectance of cellulose (solid line) and lignin (dash line). Data acquired from USGS Spectral Library Version 7: U.S. Geological Survey Data Series.
2. Materials and Methods
We consider that the leaf cellular structure remains unaltered because it is dried since cellulose dehydrates with its internal order intact. However, some changes take place in the spectrum reflectance due to water loss, the deterioration of the cuticle and the degradation of the photosynthetic components [3].
In this work, we determine the differences between images captured with a CMOS sensor employing three narrow band filters to identify the leaf degradation. The vegetation samples are leaves of an unidentified leafy tree from a university campus, apparently healthy. We collect some leaves with different degrees of decomposition, considering their color and stiffness. In Figure 2, the first sample (left) is dry, so it is completely rigid and fragile; the second and third leaves (left to right) have some degree of senescence with dehydration but are not completely dry; and the last sample (right) is a healthy leaf.
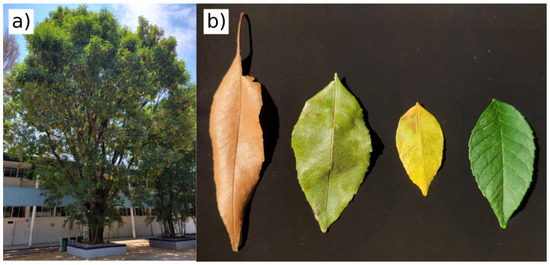
Figure 2.
Leaves used: (a) the tree of the sampled leaves was located at the university campus; (b) the senescent leaves were collected under the tree and the healthy leaf was cut along with a small branch to maintain freshness.
Experiment
The image sensor used is the AR0130CS model from the manufacturer ON Semiconductor, a 1/3 inch CMOS digital sensor with an active-pixel array of 1280 H × 960 V installed over an electronic board to send the signal by a USB port to the PC. The filters are a narrow band pass with a central wavelength at 766 nm, 830 nm and 1064 nm. All filters have a linewidth () of 10 nm. The optics include a manual-focus lens system without an IR-CUT filter and an adjustable aperture ring of about 5 mm. The sun irradiance was measure with a spectroradiometer SpectriLight model ILT950, on the surface where the samples are placed. This surface is a 20 × 20 cm high-absorbance velvet-coated sheet.
As a calibration step, we register the irradiance and then adjust the exposure time of the CMOS camera with a calibrated reflectance panel. After the calibration process, we capture the images of leaves. We repeated the calibration and capture processes three times, as the IR filters were placed between the lens and the sensor, as shown in Figure 3. Once we adjusted the camera exposure time to get the reflectance reference, we set up the leaf samples to take the images. We captured the pictures with the same solar irradiance and adjusted the exposure time for each filter.
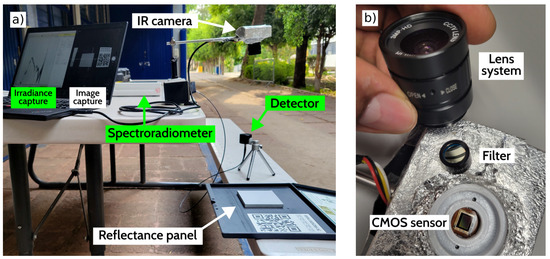
Figure 3.
(a) Calibration equipment in the experimental site; the green background labels are the components of the spectroradiometer. On the right side is the head of the detector, connected by fiber optics to the spectroradiometer, which communicates with the computer with a USB connector. The white background labels are the components of the camera adjustment; the camera views the reflectance panel that is located where the samples are placed. (b) Camera optics; the filter position is between the sensor and lens and is replaced by the three narrow band filters one by one.
3. Results
Figure 4b presents the measured spectral solar irradiance from 300 nm to 1049 nm. This is the radiometric reference value to probe the responsivity of the CMOS detector (Figure 4a) to explain the results of the images of the leaves. The entire irradiance of the narrow band is and .
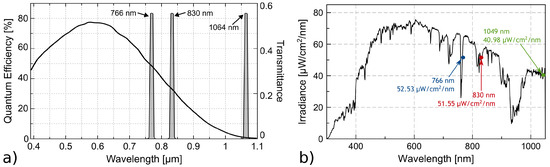
Figure 4.
(a) Responsivity of CMOS sensor and narrow band of filters; (b) irradiance measured over visible and near-infrared range. Capture parameters; integration time 10 ms, scan averages 32.
In Figure 5, we compare the images obtained with the three filters. In each frame, we show the four leaves in different states of decomposition (S1, S2, S3, S4). The color image is a reference used to identify visible features, but it is necessary to detail other characteristics to explain the results. Table 1 summarizes the sample characteristics and the information on the intensity levels of the images related to the reflectivity of the leaves.
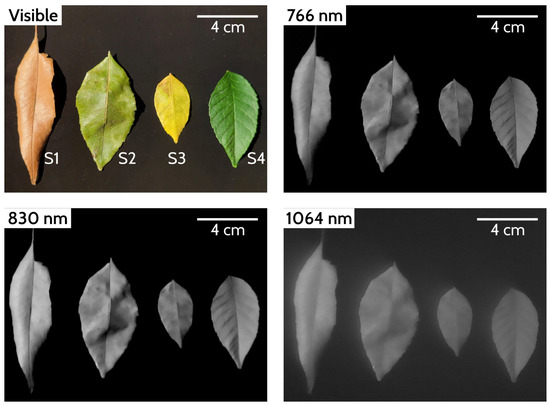
Figure 5.
Images captured with the three different filters together with the reference image in the visible range. In the images taken with infrared filters (grayscale), a lighter color represents greater reflectivity, and a darker tone represents less reflectivity. In the case of a black background, it is understood that there is no reflected radiation.

Table 1.
Characteristics of the leaves and the descriptions of the intensity images. The grayscale of the intensity pixels has values from 0 to 255 (dark to white).
4. Conclusions
The differences between the images of these wavelengths appear the same, but the intensity of pixels indicates greater reflectance with the 830 nm filter, especially in sample S1. This makes sense because the sample is completely dry, meaning that there is no absorption of water molecules, and although the sensor has less sensitivity at 830 nm compared to 766 nm, it obtains a better response because the total solar irradiance of the narrow band is more prominent and the reflectivity of the cellulose is higher in this region (Figure 1).
The image obtained with the filter CW 1064 nm is blurry because it is above the detection limit of the sensor. Moreover, although we do not know the irradiance at this wavelength because the spectroradiometer does not cover this area, we know from black body theory that the power emitted by the sun at this wavelength is lower than at other wavelengths. Therefore, as a result, we obtain an image with a low signal-to-noise ratio (SNR), which, although calibrated, does not present adequate conditions to determine its use for vegetation analysis.
Author Contributions
R.C.B., optics adaptation and writing and review; M.S., analysis and writing and review; R.G.-R., methodology, conceptualization, and writing. All authors have read and agreed to the published version of the manuscript.
Funding
This research received no external funding.
Institutional Review Board Statement
Not applicable.
Informed Consent Statement
Not applicable.
Data Availability Statement
The data are not publicly available.
Acknowledgments
The authors acknowledge the helpful discussions with Guillermo García-Torales.
Conflicts of Interest
The authors declare no conflict of interest.
Abbreviations
The following abbreviations are used in this manuscript:
| CMOS | Complementary Metal Oxide Semiconductor |
| NIR | Near-Infrared |
| IR | Infrared |
| CW | Central Wavelength |
| SNR | Signal-to-Noise Ratio |
References
- Im, J.; Jensen, J.R. Hyperspectral Remote Sensing of Vegetation. Geogr. Compass 2008, 2, 1943–1961. [Google Scholar] [CrossRef]
- Steven, M.D.; Malthus, T.J.; Baret, F.; Xu, H.; Chopping, M.J. Intercalibration of vegetation indices from different sensor systems. Remote. Sens. Environ. 2003, 88, 412–422. [Google Scholar]
- Barragán, R.C.; Castrellon-Uribe, J.; Garcia-Torales, G.; Rodríguez-Rivas, A. IR characterization of plant leaves, endemic to semi-tropical regions, in two senescent states. Appl. Opt. 2020, 59, E126–E133. [Google Scholar]
Disclaimer/Publisher’s Note: The statements, opinions and data contained in all publications are solely those of the individual author(s) and contributor(s) and not of MDPI and/or the editor(s). MDPI and/or the editor(s) disclaim responsibility for any injury to people or property resulting from any ideas, methods, instructions or products referred to in the content. |
© 2023 by the authors. Licensee MDPI, Basel, Switzerland. This article is an open access article distributed under the terms and conditions of the Creative Commons Attribution (CC BY) license (https://creativecommons.org/licenses/by/4.0/).