
5G NR Radio Network Planning at 3.5 GHz and 28 GHz in a Business/Dense Urban Area from the North Zone in Quito City †


Abstract
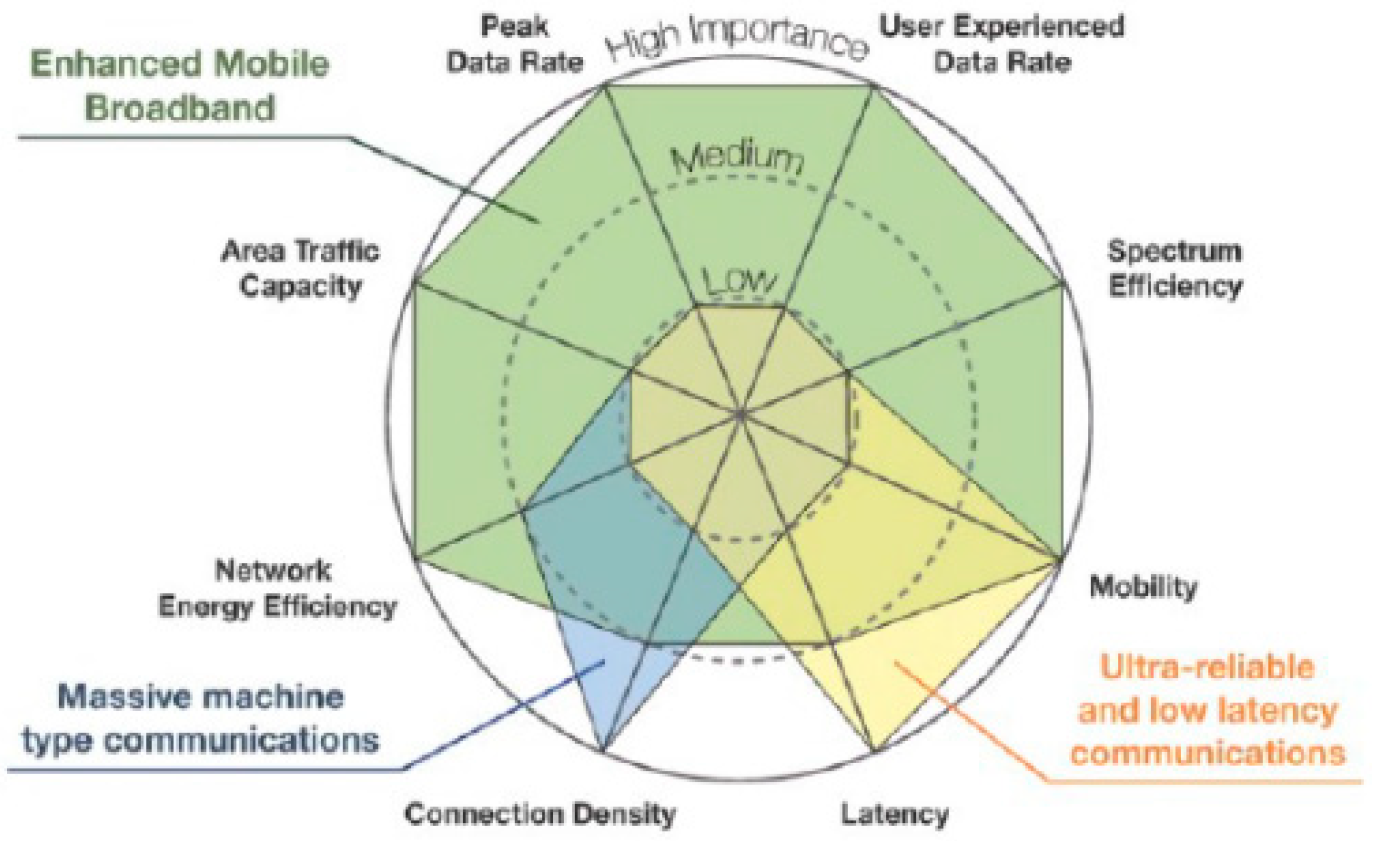
:1. Introduction
2. Methodology of Research, Radio Planning, and Design of 5G Network
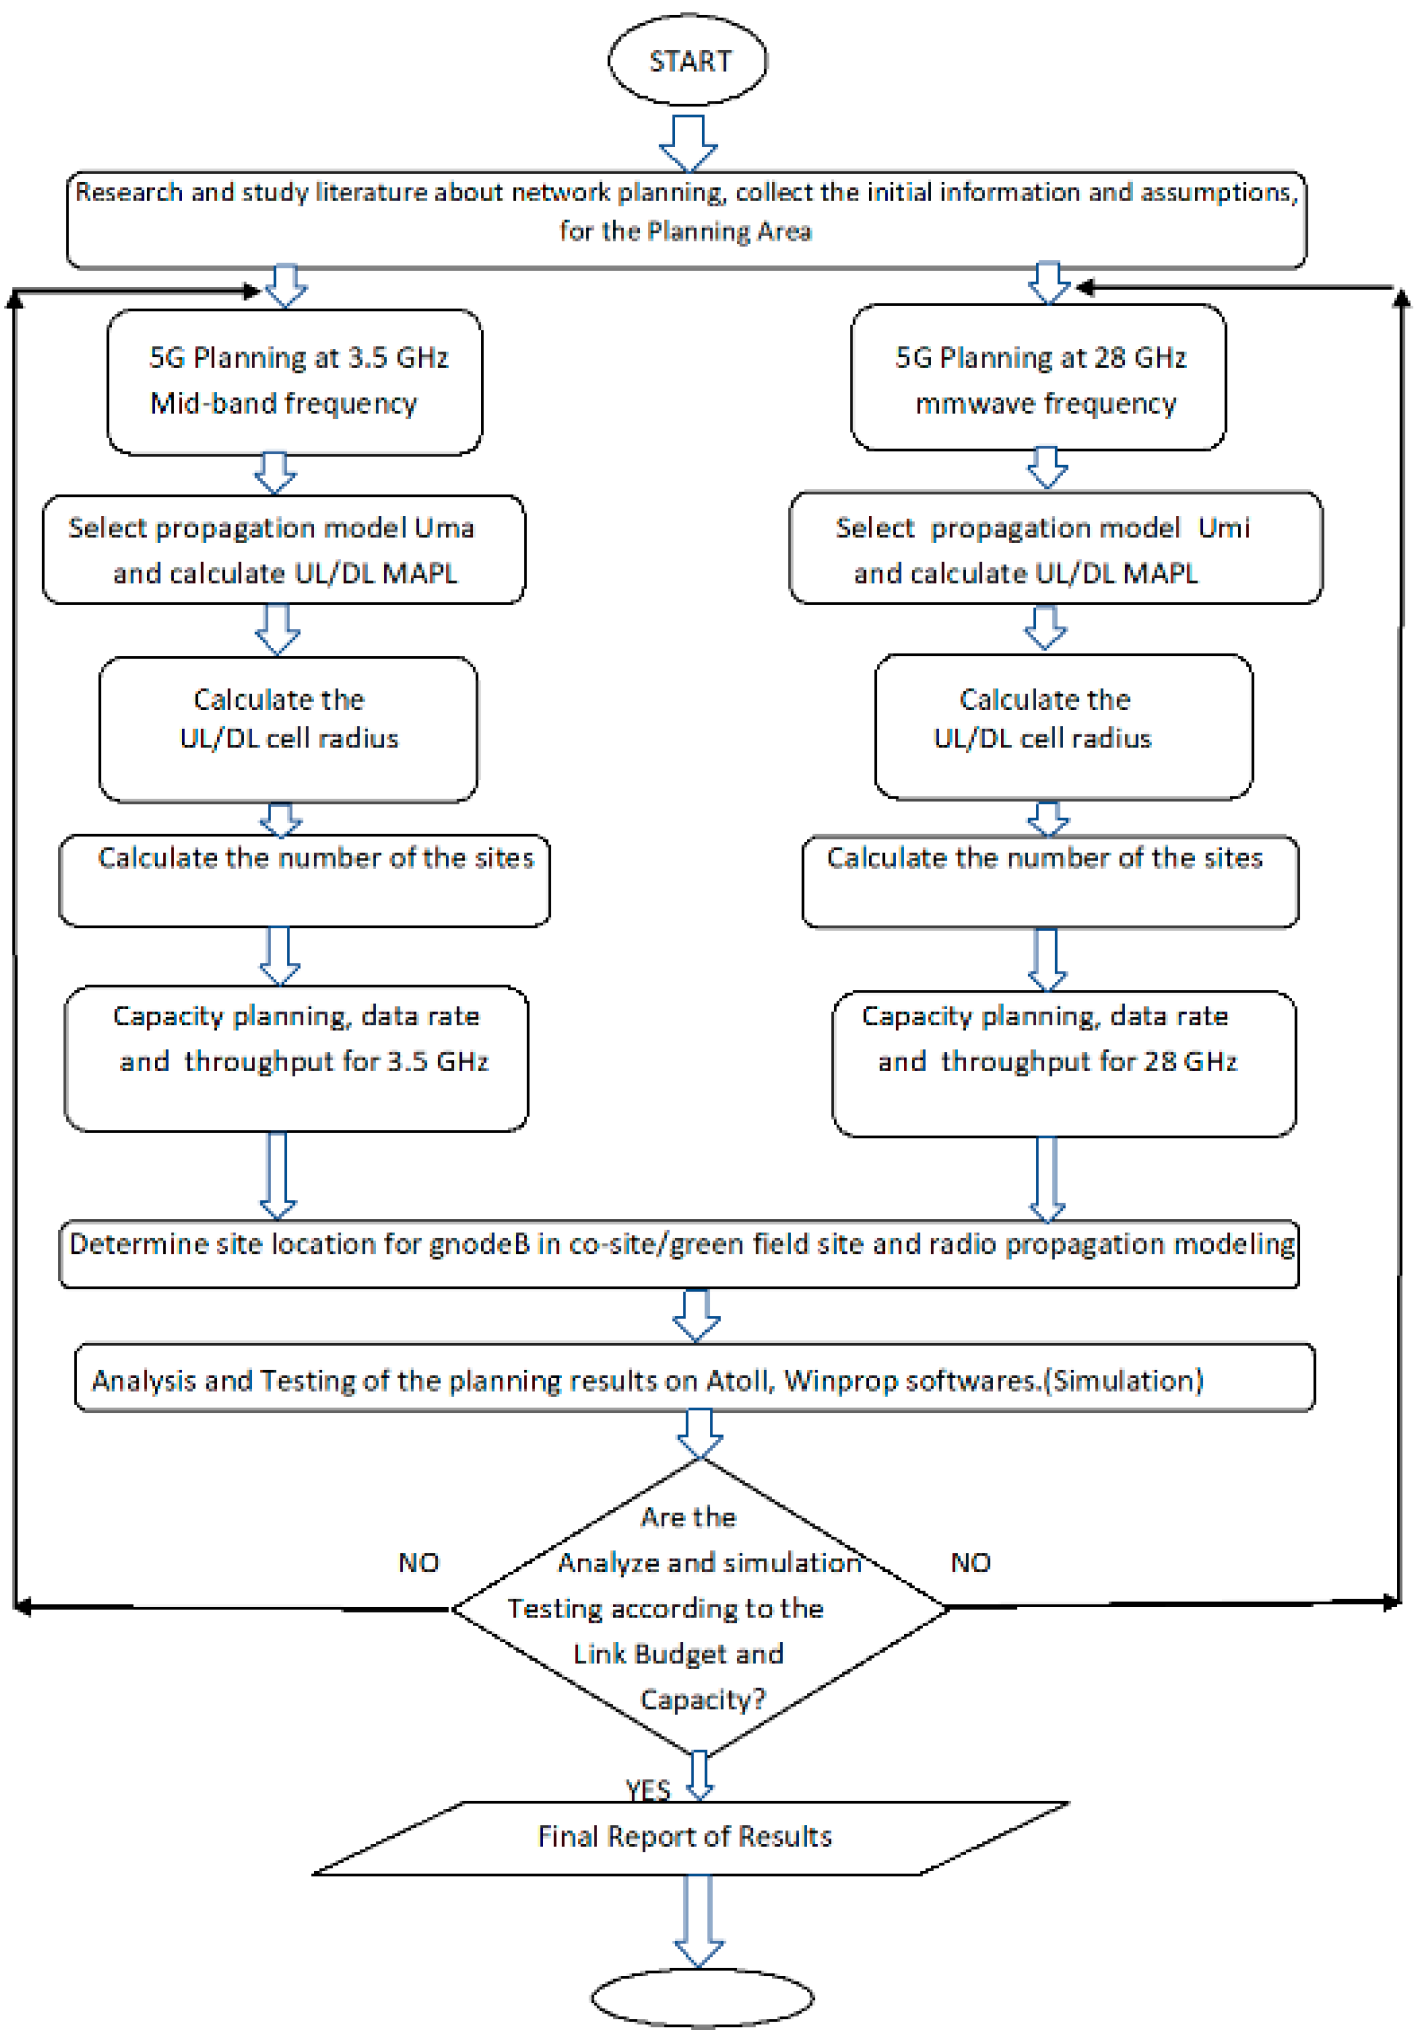
2.1. Methodology and General Process Flowchart for Radio Network Planning
2.2. Link Budget Dimensioning and Planning
- K = Boltzmann Constant (1.38 × 10⁻²³ J/K)

| Parameters for Calculate (MAPL) | |||||
|---|---|---|---|---|---|
| Parameter | Notation | Downlink | Uplink | Downlink | Uplink |
| C-Band: 3.5 GHz | mmwave Band: 28 GHz | ||||
| gnodeB transmitter power (dBm) | a | 43 | - | 36.5 | - |
| SCS (KHz)/B (MHz) | - | 30/100 | 30/100 | 60/200 | 60/200 |
| Resource Block | RB | 273 | 273 | 264 | 264 |
| Subcarrier quantity | b | 3276 | 3276 | 3168 | 3168 |
| gnodeB antenna gain(dBi) | c | 25 | 25 | 33.5 | 33.5 |
| gnodeB cable loss (dBi) | d | 0 | 0 | 0 | 0 |
| Penetration loss (dB) | e | 28 | 28 | 19 | 19 |
| Folliage loss (dB) | f | 10 | 10 | 10 | 10 |
| Body block loss (dB) | g | 3 | 3 | 7 | 7 |
| Interference margin (dB) | h | 6 | 2 | 1 | 1 |
| Rain/Ice margin (dB) | i | 0 | 0 | 3 | 3 |
| Slow fading margin (dB) | j | 7 | 7 | 7 | 7 |
| UE antenna gain (dB) | k | 0 | 0 | 0 | 0 |
| Noise Bandwidth (SCS) (MHz) | B | 0.03 | 0.03 | 0.06 | 0.06 |
| Boltzmann Constant | K | 1.38 × 10⁻²³ | 1.38 × 10⁻²³ | 1.38 × 10⁻²³ | 1.38 × 10⁻²³ |
| Temperature (°K) | T | 293 | 293 | 293 | 293 |
| Thermal Noise Power (dBm) | l | −129.1592799 | −129.1592799 | −126.14898 | −126.14898 |
| UE noise figure (dB) | m | 9 | 9 | 9 | 9 |
| Demodulation threshold SNR (dBm) | n | −1 | −1 | −1 | −1 |
| Planning Area (Km2) | A | 6.72 | 6.72 | 6.72 | 6.72 |
| Bandwidth | SCS (KHz)—3.5 GHz | Bandwidth | SCS (KHz)—28 GHz | |||
|---|---|---|---|---|---|---|
| 15 (KHz) | 30 (KHz) | 60 (KHz) | 60 (KHz) | 120 (KHz) | ||
| 20 (MHz) | 106 | 51 | 24 | 50 (MHz) | 66 | 32 |
| 50 (MHz) | 270 | 133 | 65 | 100 (MHz) | 132 | 66 |
| 100 (MHz) | N/A | 273 | 135 | 200 (MHz) | 264 | 132 |
- and,
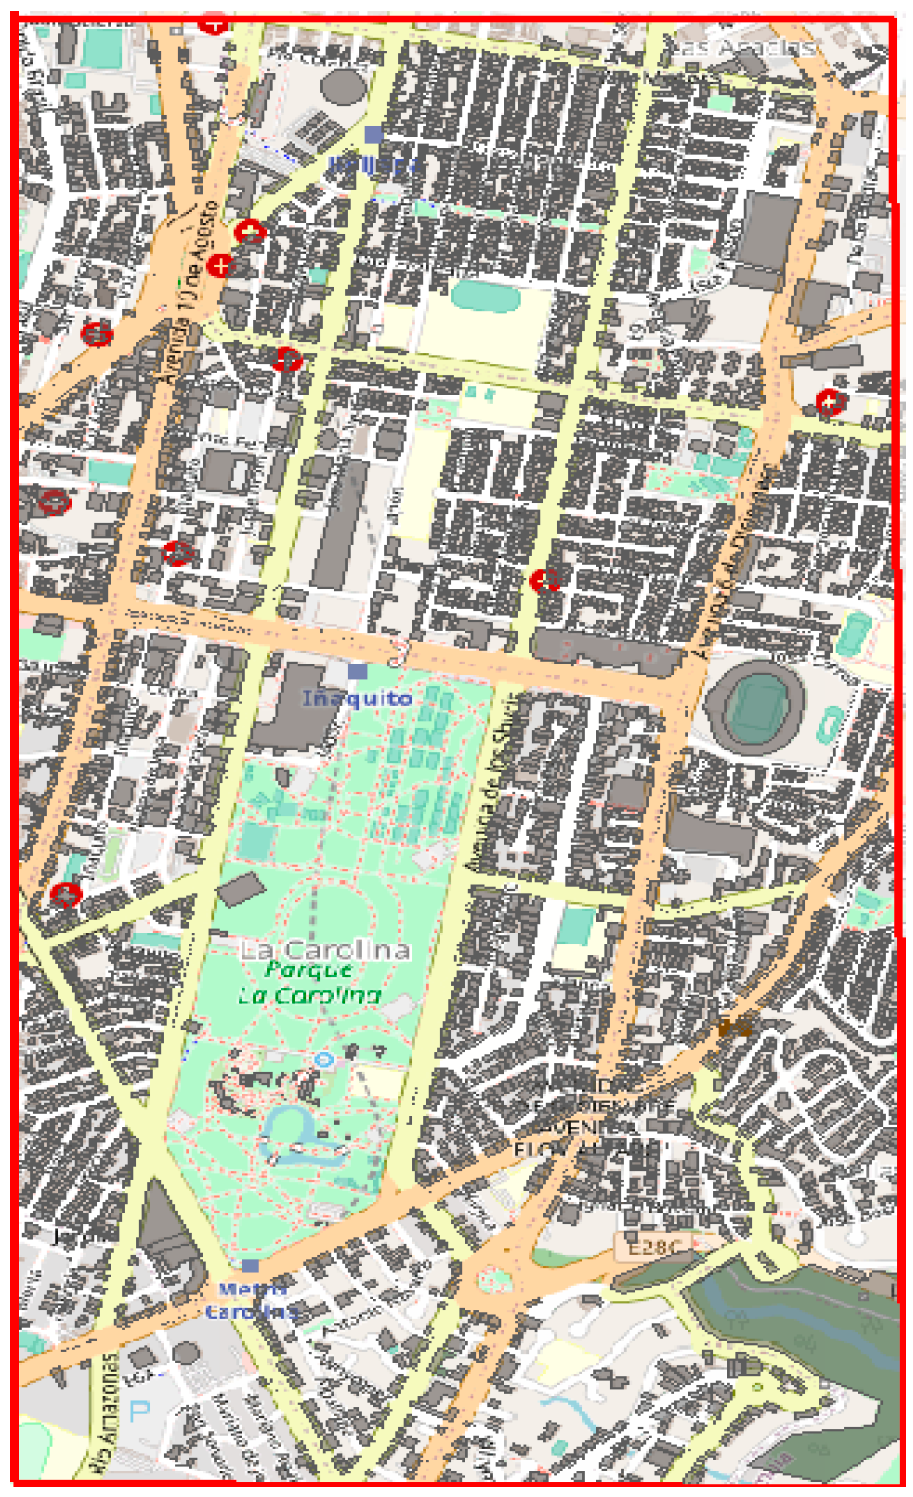
2.3. Coverage Area Planning
2.3.1. 5G NR Reference Signal-Received Power (SS-RSRP)-Parameter Secondary Synchronization
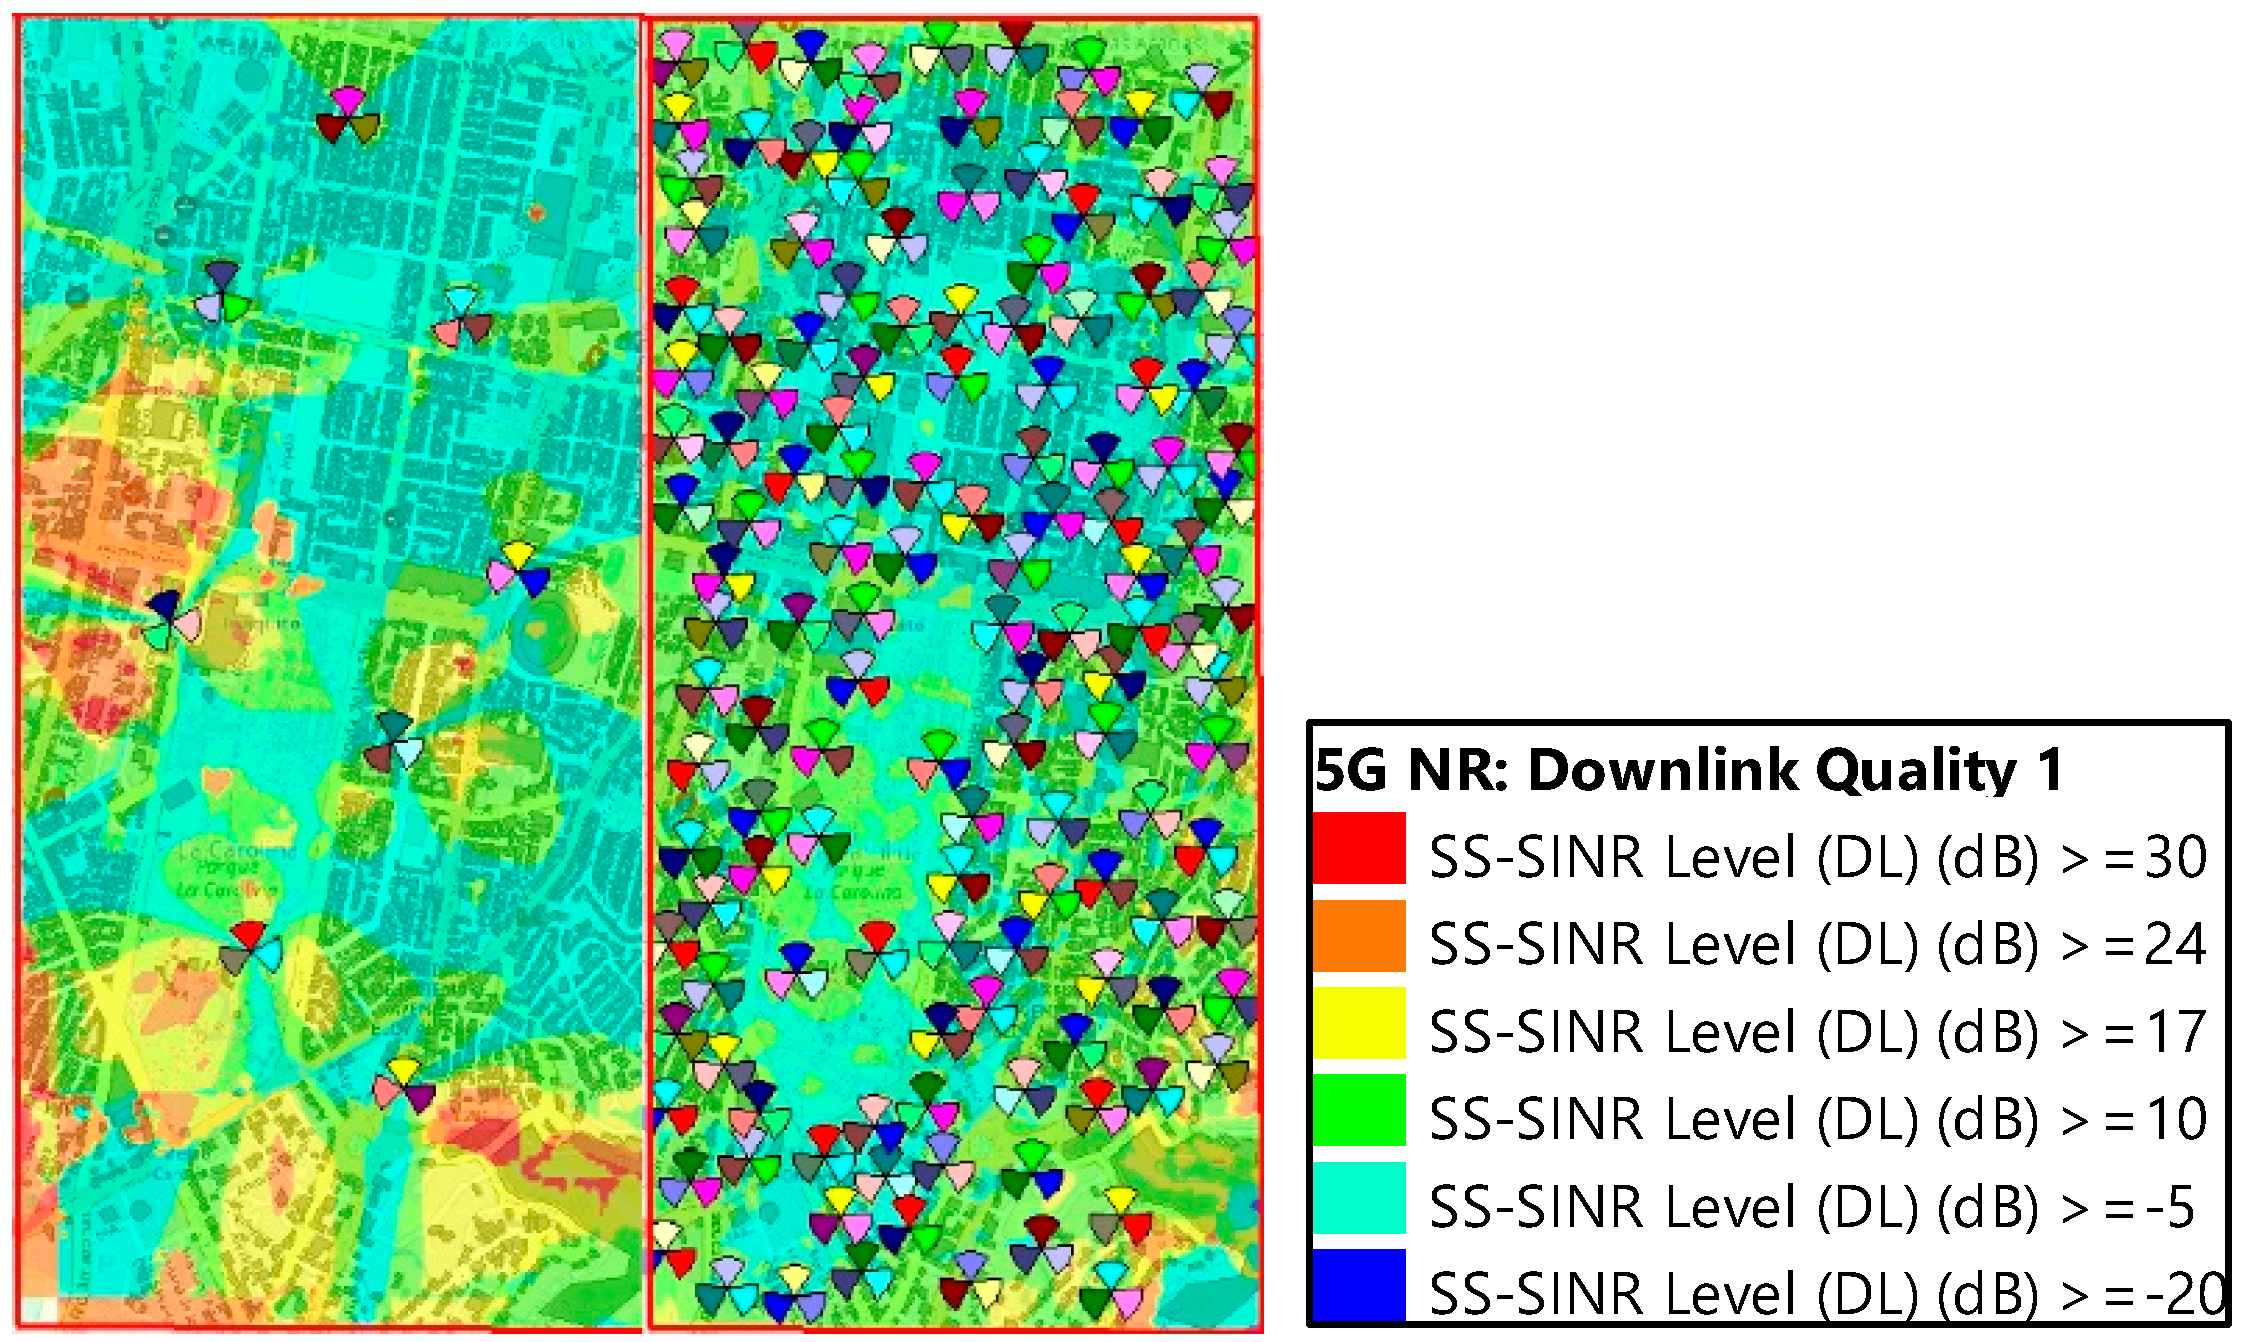
2.3.2. 5G NR Signal-to-Noise and Interference Ratio (SS-SINR)
2.4. Capacity Planning
3. Results, Analysis, and Simulations
3.1. Model Propagation Uma and Umi for 5G NR Radio Network Planning
3.2. Link Budget, Coverage, and Capacity Calculation Results
3.3. Simulation Planning Results Based on Link Budget, Coverage, and Capacity Calculations
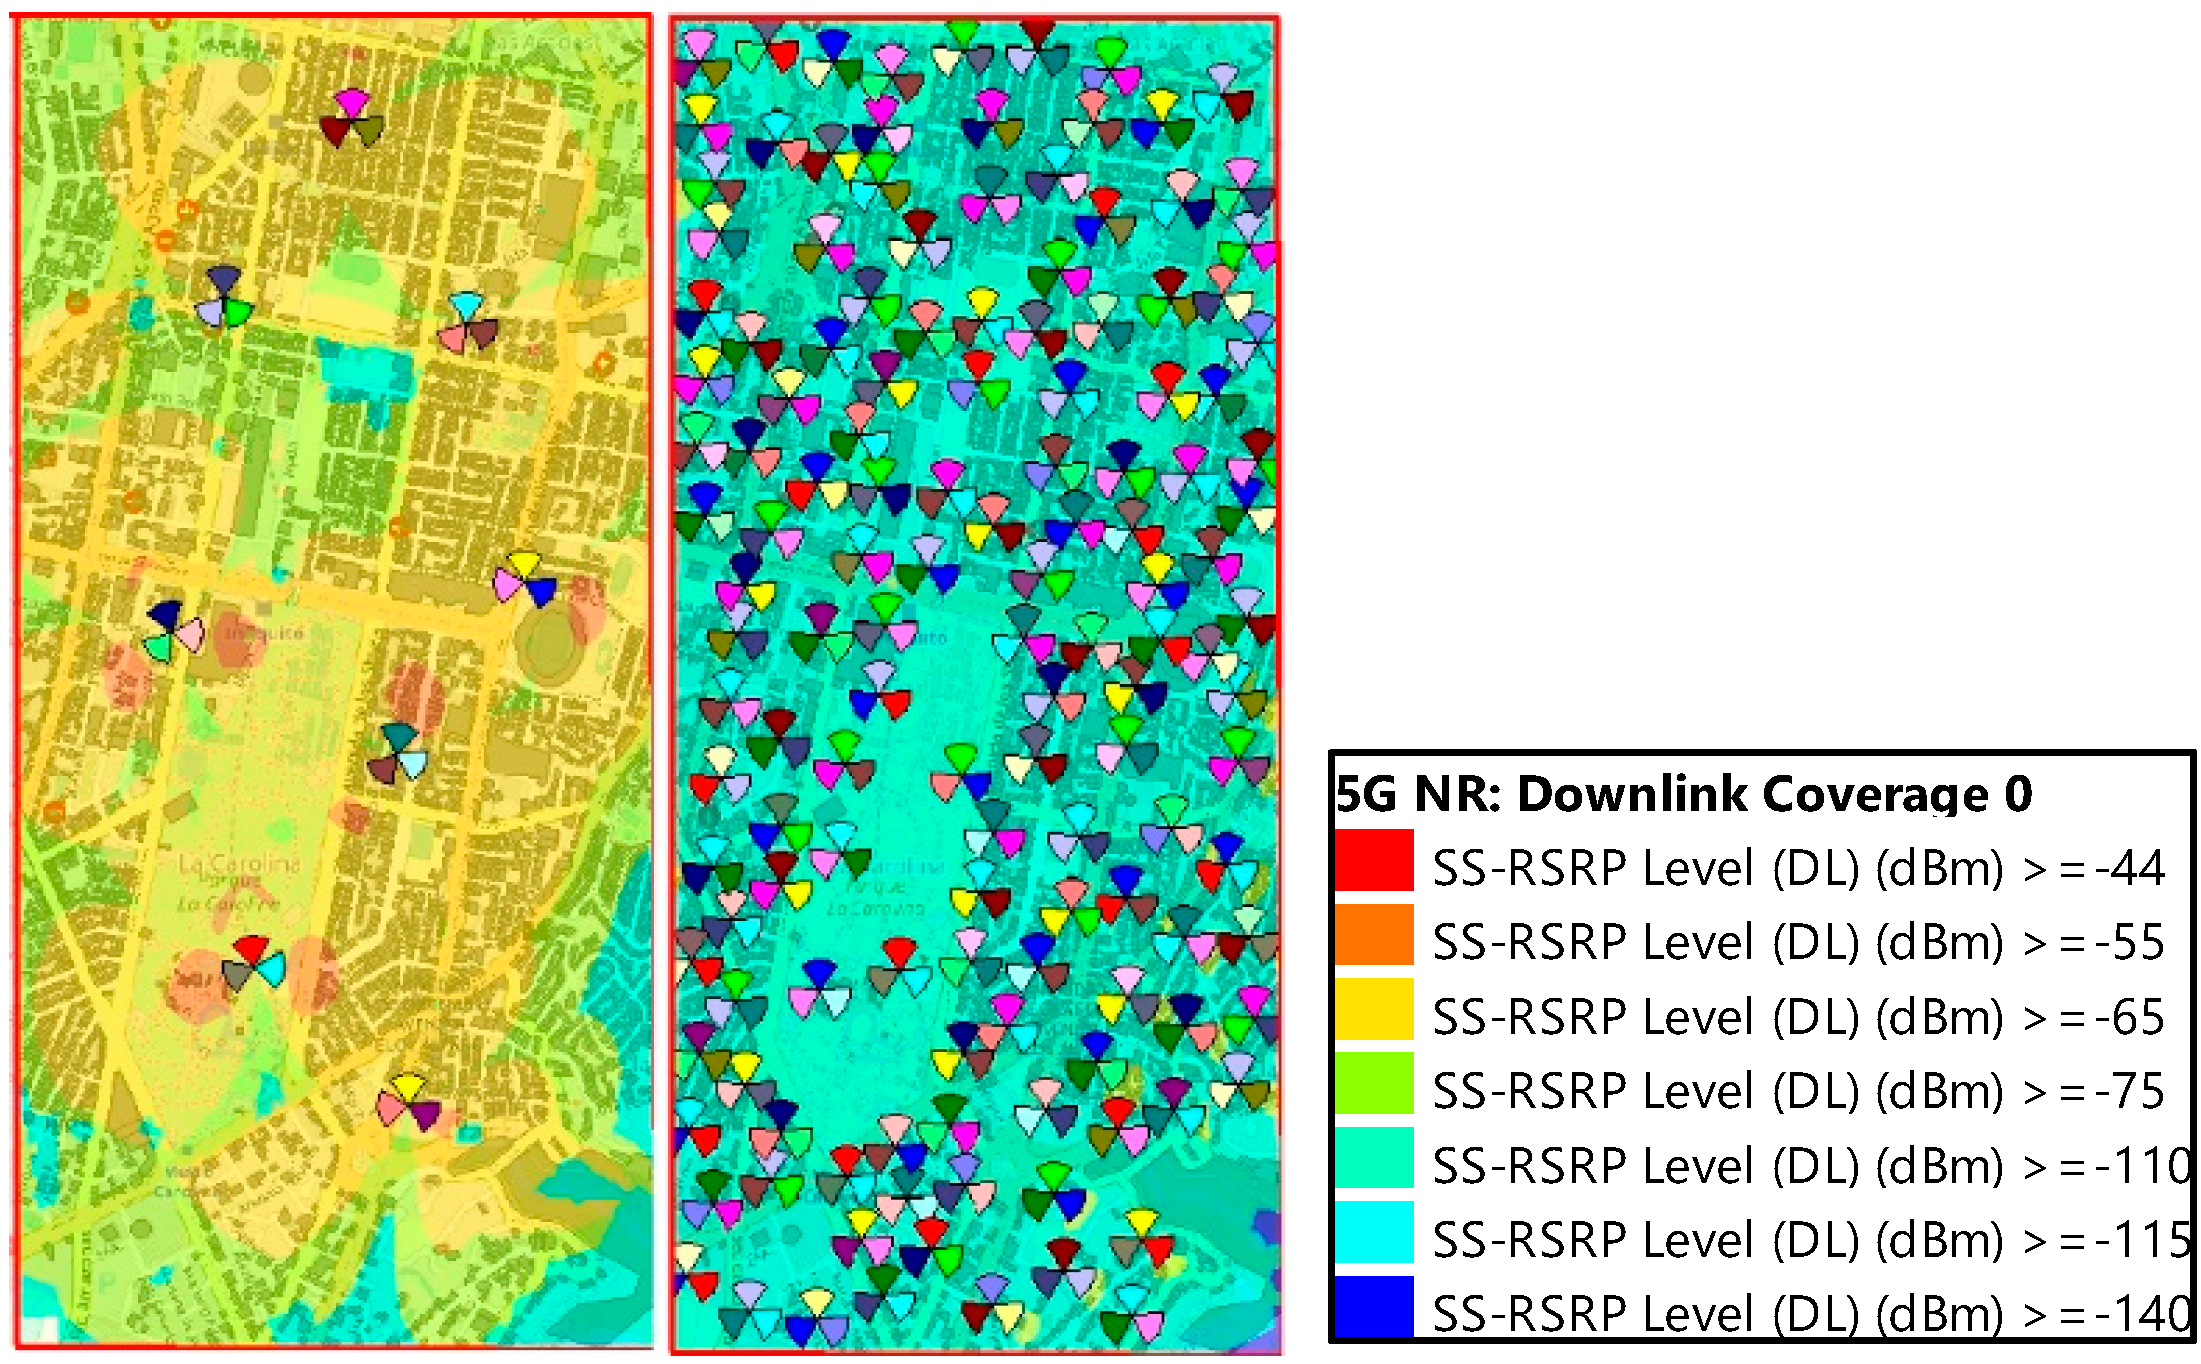
3.3.1. Scenario 1–2: O2O Downlink—SS-RSRP
3.3.2. Scenario 1–2: O2O Downlink—SS-SNR
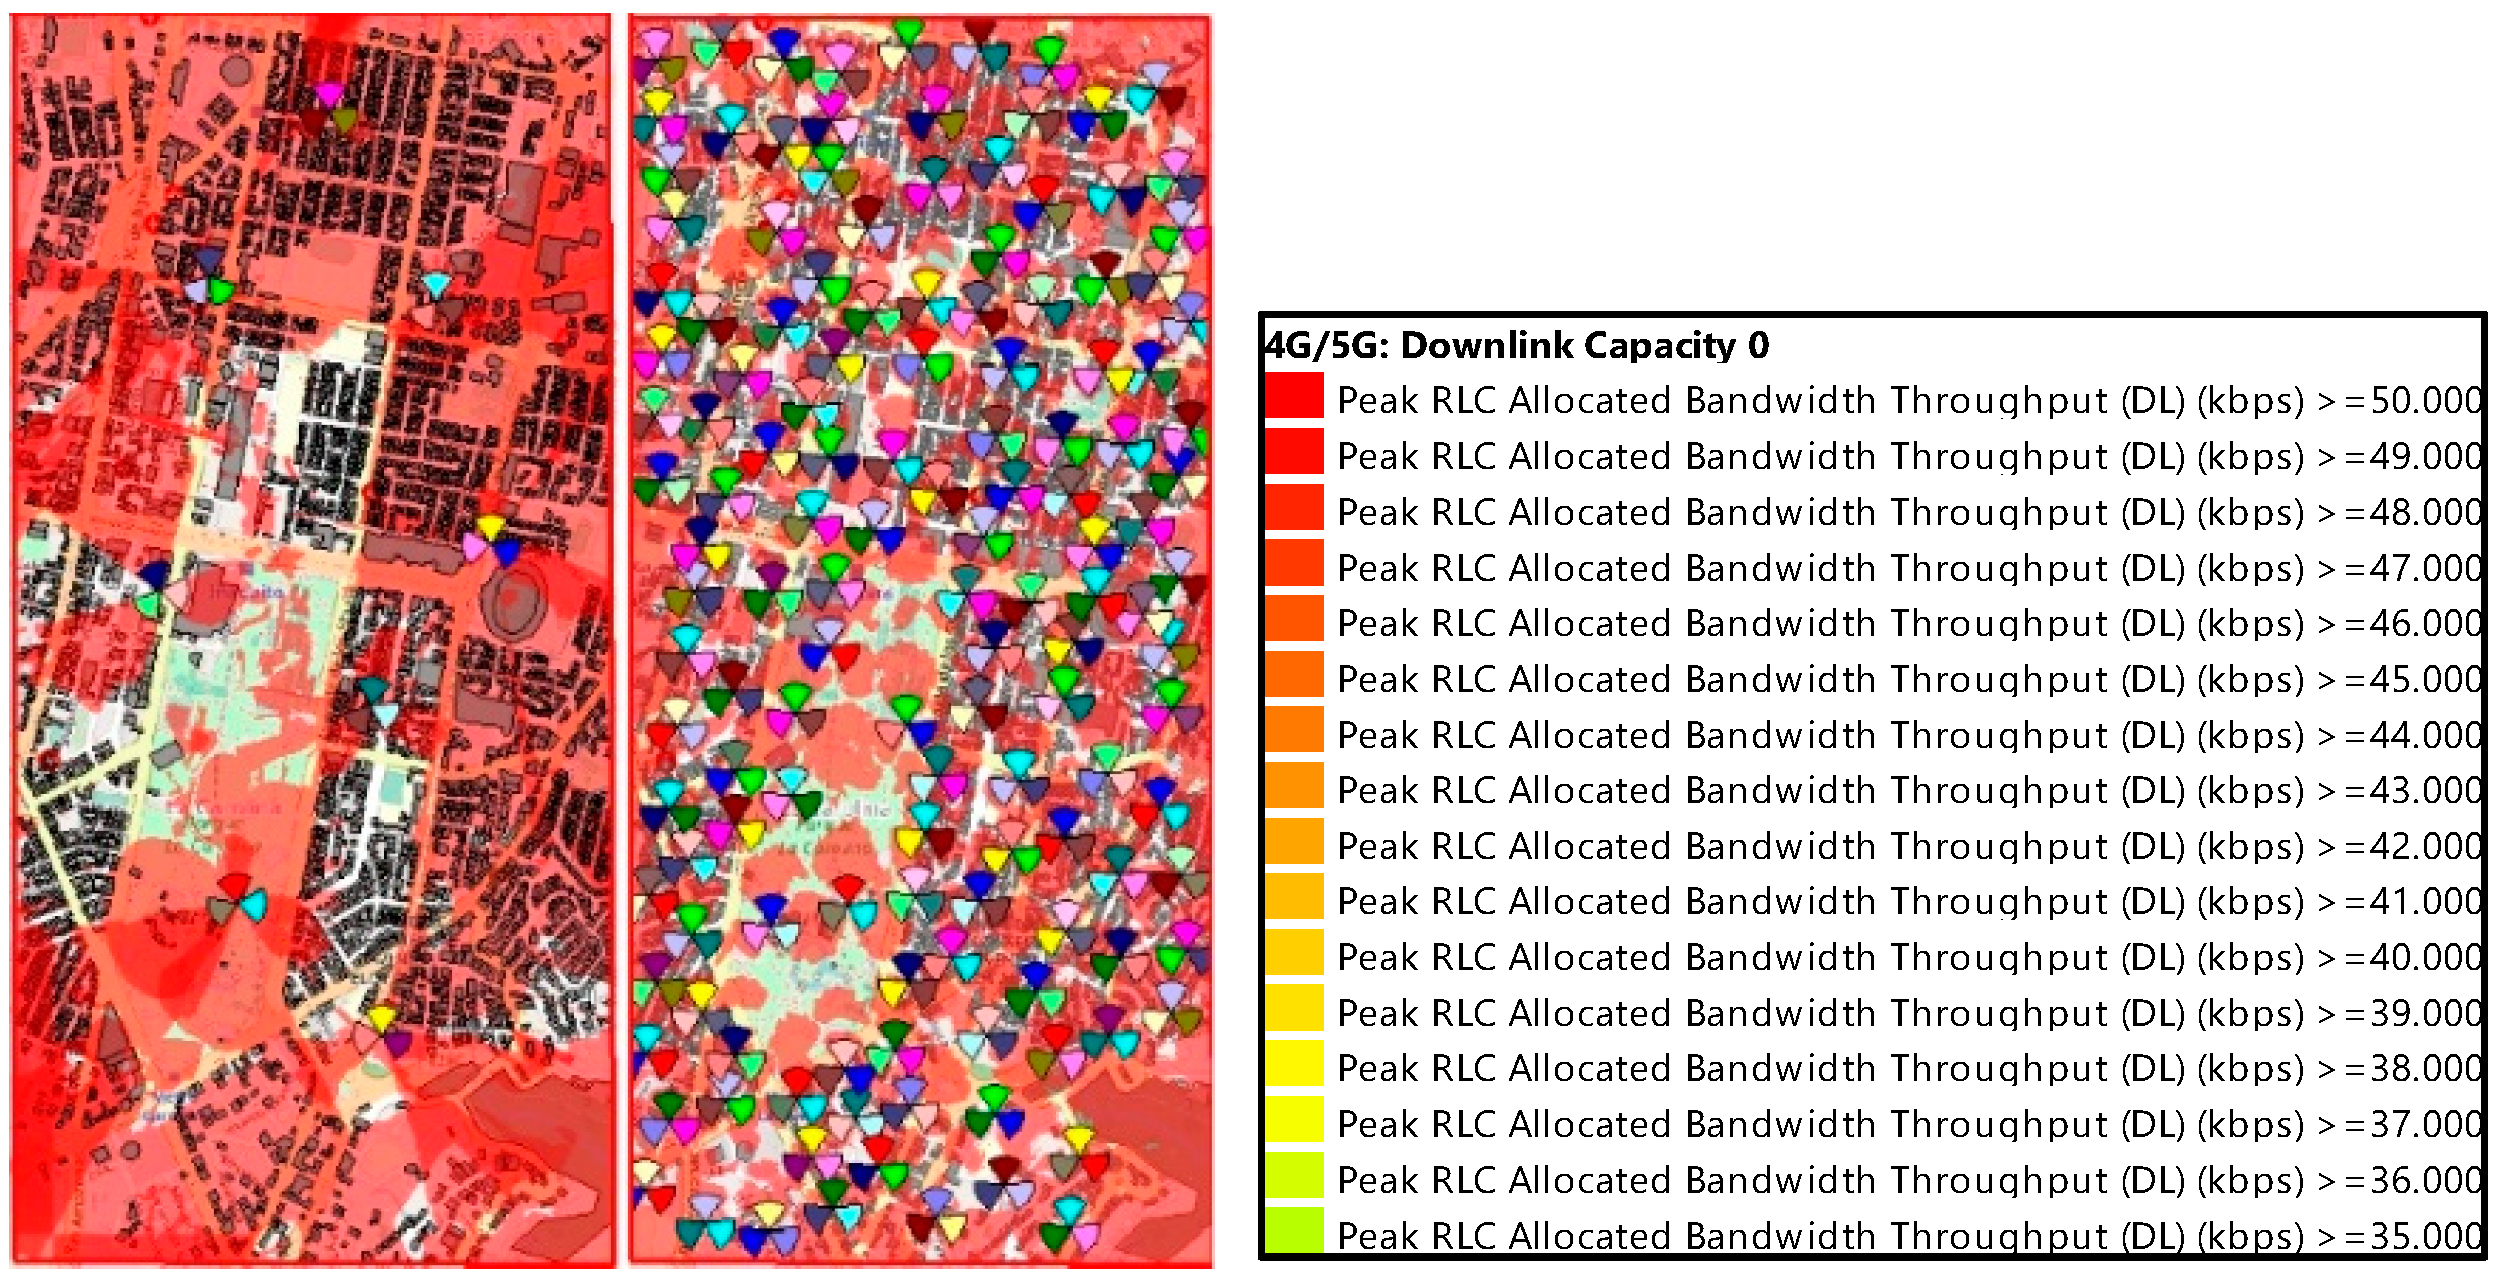
3.3.3. Scenario 1–2: O2O Downlink—Data Rate Throughput
4. Conclusions
- We have significantly contributed with a speedy and efficient way of performing the designs, calculations, and planning of 5G NR networks for business/dense urban areas in compliance with coverage, quality, and capacity objectives. In our case, this was accomplished by applying the existing 3GPP standards for 5G through the use and selection of the correct criteria, adequately applying the propagation models, urban density scenarios type, topography, LOS/NLOS criteria, service use cases, bandwidths for the user, link budget parameters, and frequency spectrum, and following best practices from commercial 5G network deployments.
- The link budget calculations and coverage, quality, and capacity simulations obtained with the Atoll tool were highly accurate and consistent with the theoretical calculations obtained. This can be verified and confirmed by the average levels achieved for the coverage SS-RSRP (>90 dBm) and quality SS-SNR (>10 dB), which ensures a good data experience, good coverage for the target area, and outstanding data throughput levels (>50 Mbps per user), with all these being observed in both planned scenarios (3.5/28 GHz).
- The results obtained from our contribution can make it easier for local mobile network operators to plan their 5G networks. This allows them to approach their designs more effectively, conducting their commercial deployments with successful commercial frequency bands in 5G networks.
Author Contributions
Funding
Institutional Review Board Statement
Informed Consent Statement
Data Availability Statement
Conflicts of Interest
References
- Shaddad, R.Q.; Al-Kmali, F.S.; Noman, M.A.; Ahmed, N.K.; Marish, E.M.; Al-Duais, A.M.; Al-Yafrsi, A.A.; Al-Sabri, F.A. Planning of 5G Millimeterwave Wireless Access Network for Dense Urban Area. In Proceedings of the 2019 First International Conference of Intelligent Computing and Engineering (ICOICE), Hadhramout, Yemen, 15–16 December 2019; pp. 1–4. [Google Scholar] [CrossRef]
- Shah SA, W.; Khattab, T.; Shakir, M.Z.; Hasna, M.O. A distributed approach for networked flying platform association with small cells in 5G+ networks. In Proceedings of the GLOBECOM 2017—2017 IEEE Global Communications Conference, Singapore, 4–8 December 2017. [Google Scholar]
- Chen, Z.; Lee, J.; Quek, T.Q.; Kountouris, M. Cooperative caching and transmission design in cluster-centric small cell networks. IEEE Trans. Wirel. Commun. 2017, 16, 3401–3415. [Google Scholar] [CrossRef]
- Fallgren, M.; Timus, B. Scenarios Requirements and KPIs for 5G Mobile and Wireless System. Available online: https://cordis.europa.eu/docs/projects/cnect/9/317669/080/deliverables/001-METISD11v1pdf.pdf (accessed on 7 August 2023).
- Jamalzadeh, M.; Ong, L.-D.; Mohd, M.N.B. 5GTechnologies: A New Network Architectures and Design. J. Internet Technol. 2018, 19, 1983–1991. [Google Scholar]
- Sukarno, A.; Hikmaturokhman, A.; Rachmawaty, D. Comparison of 5G NR Planning in Mid-Band and High-Band in Jababeka Industrial Estate. In Proceedings of the 2020 IEEE International Conference on Communication, Networks and Satellite (Comnetsat), Batam, Indonesia, 17–18 December 2020; pp. 12–17. [Google Scholar] [CrossRef]
- Situmorang, A.C.; Gunawan, D.; Anggraini, V.G. 5G Trials on 28 GHz Band in Indonesia. In Proceedings of the 28th Wireless and Optical Communication Conference (WOCC 2019), Beijing, China, 9–10 May 2019. [Google Scholar]
- Al-Mekhlafi, A.A.; Al-Kamali, O.M.; Shaddad, R.Q.; Abduljalil, M.A. Dense 5G Network Planning for Coastal Area at Aden City, Yemen. In Proceedings of the 2019 First International Conference of Intelligent Computing and Engineering (ICOICE), Hadhramout, Yemen, 15–16 December 2019; pp. 1–7. [Google Scholar] [CrossRef]
- Rianti, D.; Hikmaturokhman, A.; Rachmawaty, D. Techno-Economic 5G New Radio Planning Using 26 GHz Frequency at Pulogadung Industrial Area. In Proceedings of the 2020 3rd International Seminar on Research of Information Technology and Intelligent Systems (ISRITI), Yogyakarta, Indonesia, 10 December 2020; pp. 272–277. [Google Scholar] [CrossRef]
- Ekawibowo, S.A.; Pamungkas, M.P.; Hakimi, R. Analysis of 5G Band Candidates for Initial Deployment in Indonesia. In Proceedings of the 2018 4th International Conference on Wireless and Telematics (ICWT), Nusa Dua, Bali, 12–13 July 2018; pp. 1–6. [Google Scholar]
- Fahira, G.; Hikmaturokhman, A.; Danisya, A.R. 5G NR Planning at mmWave Frequency: Study Case in Indonesia Industrial Area. In Proceedings of the 2020 2nd International Conference on Industrial Electrical and Electronics (ICIEE), Lombok, Indonesia, 10–11 June 2020; pp. 205–210. [Google Scholar] [CrossRef]
- Esa, R.N.; Hikmaturokhman, A.; Danisya, A.R. 5G NR Planning at Frequency 3.5 GHz: Study Case in Indonesia Industrial Area. In Proceedings of the 2020 2nd International Conference on Industrial Electrical and Electronics (ICIEE), Lombok, Indonesia, 10–11 June 2020; pp. 187–193. [Google Scholar] [CrossRef]
- Karo, F.K.; Hikmaturokhman, A.; Amanaf, M.A. 5G New Radio (NR) Network Planning at Frequency of 2.6 GHz in Golden Triangle of Jakarta. In Proceedings of the 2020 3rd International Seminar on Research of Information Technology and Intelligent Systems (ISRITI), Yogyakarta, Indonesia, 10 December 2020; pp. 278–283. [Google Scholar] [CrossRef]
- Huawei. 5G Link Budget ‘Best Partner for Innovation. Available online: https://telecomfiles.com/5g-link-budget (accessed on 1 August 2023).
- 3GPP, 5G. Study on Channel Model for Frequencies from 0.5 to 100 GHz (3GPP TR 38.901 version 14.0.0 Release 14). ETSI TR138.901; 3GPP: Valbonne, France, 2017. [Google Scholar]
- 3GPP, 3rd Generation Partnership Project. In Technical Specification Group Radio Access Network. NR. User Equipment (UE) Radio Access Capabilities; 3GPP: Valbonne, France, 2019.

| Category | Frequency and Bandwidth | Usage Scenario Typical | Frequency Center | Range |
|---|---|---|---|---|
| Low-Frequency Bands Coverage Layer | Below 1 GHz bandwidth up to 20 MHz | mMTC | Band of 0.7–1.9 GHz | 0.7–1.990 GHz |
| Medium-Frequency Bands Coverage Layer | 1–6 GHz bandwidth up to 100 MHz | mMTC, eMBB | Band of 3.5–15 GHz | 3.3–4.2 GHz |
| High-Frequency Bands Coverage Layer | Above 6 GHz bandwidth up to 800 MHz | eMBB, uRLLC | Band of 26–28 GHz | 24.25–27.5 GHz 26.5–29.5 GHz |
| Category | Range of Signal Level |
|---|---|
| Good | −90 ≤ RSRP ≤ −70 dBm |
| Normal | −110 ≤ RSRP ≤ −90 dBm |
| Bad | −130 ≤ RSRP ≤ −110 dBm |
| Parameter | Scenario 1: 3.5 GHz (FR1 Band) | Scenario 2: 28 GHz (FR2 Band) | ||
|---|---|---|---|---|
| LOS | NLOS | LOS | NLOS | |
| Thermal Noise | −129.1592799 | −126.14898 | ||
| Subcarrier quantity | 3276 | 3168 | ||
| Pathloss | 100.005841 | 106.1411282 | ||
| h’BS | 24 | 24 | ||
| h’UE | 0.5 | 0.5 | ||
| d’BP | 560 | 4480 | ||
| d3D | 600.3236595 | 85.92038528 | 135.90535 | 31.55408462 |
| d2D/Cell Radius | 600.3234512 | 85.91893044 | 135.90443 | 31.55012291 |
| Coverage Area (Km2) | 0.93700944 | 0.019193363 | 0.04802204 | 0.002588067 |
| Target Area (Km2) | 6.72 | 6.72 | 6.72 | 6.72 |
| Number of gnodesB | 7.171752721 | 350.1210328 | 139.935755 | 2596.532806 |
| Data Rate Downlink (Mbps) | 4.456, 60 | 1.114, 15 | 8.619, 37 | 2.154, 84 |
| Data Rate Uplink (Mbps) | 2.445, 70 | 611, 42 | 4.730, 14 | 1.182, 54 |
| DL/UL Throughput service per user (Mbps) | 50 | 50 | 100 | 100 |
| Number of user per use case DL | 89.13 | 22.28 | 86.19 | 21.55 |
| Number of user per use case UL | 48.91 | 12.23 | 47.30 | 11.83 |
| Key Parameter | Spectrum Details | |||
|---|---|---|---|---|
| Technology/Duplex | 5G NR/TDD | |||
| Carrier Frequency/Bandwidth | 3.5 GHz | 100 MHz | 28 GHz | 200 MHz |
| Start Frequency–End Frequency | 3300 MHz | 4200 MHz | 26,500 MHz | 29,500 MHz |
Disclaimer/Publisher’s Note: The statements, opinions and data contained in all publications are solely those of the individual author(s) and contributor(s) and not of MDPI and/or the editor(s). MDPI and/or the editor(s) disclaim responsibility for any injury to people or property resulting from any ideas, methods, instructions or products referred to in the content. |
© 2023 by the authors. Licensee MDPI, Basel, Switzerland. This article is an open access article distributed under the terms and conditions of the Creative Commons Attribution (CC BY) license (https://creativecommons.org/licenses/by/4.0/).
Share and Cite
Farré, V.; Vega Sánchez, J.D.; Carvajal Mora, H. 5G NR Radio Network Planning at 3.5 GHz and 28 GHz in a Business/Dense Urban Area from the North Zone in Quito City. Eng. Proc. 2023, 47, 24. https://doi.org/10.3390/engproc2023047024
Farré V, Vega Sánchez JD, Carvajal Mora H. 5G NR Radio Network Planning at 3.5 GHz and 28 GHz in a Business/Dense Urban Area from the North Zone in Quito City. Engineering Proceedings. 2023; 47(1):24. https://doi.org/10.3390/engproc2023047024
Chicago/Turabian StyleFarré, Valdemar, José David Vega Sánchez, and Henry Carvajal Mora. 2023. "5G NR Radio Network Planning at 3.5 GHz and 28 GHz in a Business/Dense Urban Area from the North Zone in Quito City" Engineering Proceedings 47, no. 1: 24. https://doi.org/10.3390/engproc2023047024
APA StyleFarré, V., Vega Sánchez, J. D., & Carvajal Mora, H. (2023). 5G NR Radio Network Planning at 3.5 GHz and 28 GHz in a Business/Dense Urban Area from the North Zone in Quito City. Engineering Proceedings, 47(1), 24. https://doi.org/10.3390/engproc2023047024