Abstract
This paper illustrates the application of the indirect seasonal adjustment approach to the index series of hours worked per capita from the Istat VELA survey, which is currently seasonally adjusted using the direct approach instead. The experience already gained during the Istat LFS allowed us to test the reliability of the indirect approach on the VELA series. In this case, the use of the indirect approach was twofold: firstly, the seasonally adjusted index series was obtained by seasonally adjusting the series of hours and the series of the employed separately and then relating them. Secondly, for the numerator, as well as for the denominator, the different series disaggregated by the variables of interest were seasonally adjusted separately.
1. Introduction
The quarterly Istat official survey on job vacancies and hours worked (VELA) collects information on hours worked and Short-Time Working Allowance (Cig in Italian). Two main indices on labor input can be derived from this survey: the number of hours worked and hours worked per capita. These indices are on a fixed basis and can be obtained for each economic activity sector as a ratio between the value of the indicator in the reference quarter and the average value of the base year (currently 2015). The number of hours worked is the sum of the hours worked by employees (ordinary and extraordinary). The hours worked per capita are obtained by dividing the total hours worked with the average number of employee positions occupied in the quarter.
Following the Eurostat guidelines, the direct approach is advisable when the component series have similar characteristics (Eurostat, 2015). Conversely, in cases where the series characteristics are very different, it is preferable to use an indirect approach, recommended when the seasonally adjusted aggregate also contains component series that show a weak seasonality that is difficult to identify.
The use of one approach or the other when the series are similar leads to results with negligible discrepancies. Otherwise, when series differ, the discrepancies reflected in the seasonally adjusted aggregate series may be significant: it is often the case that a relevant number of inconsistencies (also known as out-of-range data) are observed between the quarter-on-quarter changes in the aggregated activity sectors and those in each of their component sections.
The impact of the COVID emergency, which affected the economic activity section in various significant ways, revealed some of the limits of the direct approach. For the number of hours worked, switching from the direct to the indirect approach is relatively simple, while the implementation of the indirect approach for per capita hours worked is more complex and is the object of this work.
The experience gained from the seasonal adjustment of a per capita variable in the ISTAT Labor Force Survey (LFS) has been very useful. In particular, the indirect seasonal adjustment method adopted is based on the seasonal adjustment of each single series separately (for the numerator as well as for the denominator), and the series can then be re-aggregated according to the area of interest. For example, the seasonally adjusted (SA) number of hours worked per capita can be obtained as the ratio of the SA hours worked to the SA number of employed persons.
This paper describes the integration experience—and the resulting synergies—of the seasonal adjustment method between two official surveys on labor supply (LFS) and demand (VELA).
In particular, the next section deals with a comparison of when the application of the direct and indirect seasonal adjustment approaches are most recommended.
Section 3 describes in detail the indirect method, adopted by the LFS, for seasonally adjusting the hours worked per capita series and its application to the VELA ones.
In the Section 4, the main revision measures are considered in order to assess the impact of the transition to the indirect seasonal approach on the VELA series.
2. Seasonal Adjustment Approaches: Direct Versus Indirect
Official economic indicators are represented within a system characterized by elementary series (or components), the aggregation of which results in sub-total or total (marginal) series. For example, economic series are disaggregated according to the NACE Rev.2 classification of economic activities by the specific sector of economic activity (the economic activity sections) and their aggregations by macro sector.
Aggregated, or marginal, time series can be treated for seasonal effects using two main approaches, with different properties and results [1,2] (Eurostat 2015, Metodi e Norme, Oros 2019):
- -
- The direct approach consists of individually seasonally adjusting all series, both elementary and aggregates. A possible indicator would first be calculated by aggregating the raw data of its component series and then the data would be seasonally adjusted.
- -
- The indirect approach involves combining two or more seasonally adjusted series. The indicator in this case would be calculated by combining the component series after they have been seasonally adjusted separately.
In practice, it is also possible to use a combination of the two approaches: for example, when the quality of seasonal adjustment cannot be guaranteed at the lowest level of detail, one can consider using a direct approach up to a certain level and an indirect approach for higher levels of aggregation.
These two methods do not lead to the same results and are not equivalent. With the direct approach, which is easier to implement, seasonal adjustment is applied directly to the series of interest. If, for example, the raw series are not additive, the direct method is simpler and more transparent. If the raw series are additive, the indirect approach guarantees by construction that the sum of the seasonally adjusted components is equal to the seasonally adjusted aggregate, since the aggregate is obtained by summing the components. Moreover, seasonal adjustment with the direct approach can lead to inconsistency problems between aggregate and disaggregated data, generating inconsistencies (also known as out-of-range data), although these can be overcome by applying appropriate reconciliation techniques. On the contrary, as mentioned above, with the indirect approach, the internal consistency between aggregate and component series is always respected by construction.
The decision to apply one approach or the other must be made while taking into account the characteristics of the raw series and the consistency between aggregates at different levels. The choice of one approach or the other is an open question: there is no theoretical or empirical evidence in favor of one or the other. For each case, different assessments have to be made according to statistical and other considerations, empirical rules and criteria, and certain properties to be obtained a priori. According to Eurostat, if the seasonally adjusted component series have similar trends, the direct approach is preferred; if, on the other hand, they have very different characteristics and vary in weight over time, the indirect approach is preferred.
3. Integration of the Indirect Approach on Hours Worked: The Labor Force Survey Experience Applied to the Vacancies and Hours Worked One
With a view to the integration and harmonization of the methodologies applied to different surveys in Istat, it was possible to share with the quarterly survey on vacancies and hours worked (VELA) the experience gained within the framework of the Labor Force Survey (LFS) on the seasonal adjustment of the variable hours worked.
The Labor Force Survey makes available comparable time series of data from 2004 onwards, both monthly and quarterly, for the main aggregates associated with the labor market. In addition, the number of hours usually worked and the number of hours actually worked by the employed, detailed with respect to their main characteristics, are collected.
3.1. The Indirect Approach in the Seasonal Adjustment of Hours Worked per Capita in the LFS
During the period of the COVID pandemic, it was realized that information on employment trends alone was not exhaustive for analyzing the labor market and that the analysis of hours worked could be useful. In fact, along with employed persons, those affected by lay-offs (in Cig) and those who had stopped working, either partially or completely, were counted. On the other hand, the availability of the series on actual hours worked, in particular by referring to the hours per capita, provided a timely, dynamic, and easily interpretable reading of the labor input.
Therefore, in order to assess the impact on the productivity of the employed, the monthly information on the number of employed people was supplemented by information on the number of hours actually worked.
However, in order to properly analyze the trend, it was necessary to adjust the series of hours worked to account for seasonal effects. The production of monthly, seasonally adjusted data on hours worked was made possible by the use of internationally established seasonal adjustment techniques.
For the seasonal adjustment of the indicator on hours per capita, the indirect approach was used. The decision to use the indirect method arose from the strong difference between the seasonality that characterizes the series of the total hours in the numerator and that of the employed in the denominator. In these cases, international best practices on seasonal adjustment recommend that, instead of proceeding directly on the aggregate series, we proceed separately on the components and then aggregate them to obtain the aggregate seasonally adjusted series. In the case of hours per capita, the use of the indirect approach was twofold: firstly, the seasonally adjusted index series was not obtained by seasonally adjusting the raw index series (i.e., the series of ratios between the raw series of hours at the numerator, and the raw series of employed persons at the denominator—direct method). It was obtained instead by seasonally adjusting the series of hours and the series of the employed separately and then relating them. Secondly, for the numerator, as well as for the denominator, the different series disaggregated by the variables of interest were seasonally adjusted separately.
The formulae below summarize the two different approaches. Let X denote the series of total hours and Y that of the employed, disaggregated according to one or more variables of interest. Let M then be a mode of a variable of interest, expressible as the sum of n subcategories {M1, …, Mi, …, Mn}, for which:
If by SA(I) we denote the seasonally adjusted I index of hours per capita, the direct approach can be written as:
while the indirect approach can be expressed as:
The breakdown variables chosen are those most associated with the indicator of interest; in particular, for the employed and hours worked, the use of a logistic model identified the variables relating to gender, professional position (employee or self-employed), and type of working time (part-time and full-time) as most explanatory.
By way of example, Figure 1 shows the difference in the seasonal patterns of the hours worked by male and female part-time employees (a vs. b) and of the number of part-time employees who were male and female (c vs. d). At the same time, it is possible to highlight the different seasonal patterns between the number of hours worked and the number of part-time employees who were male (a vs. c) and female (b vs. d).
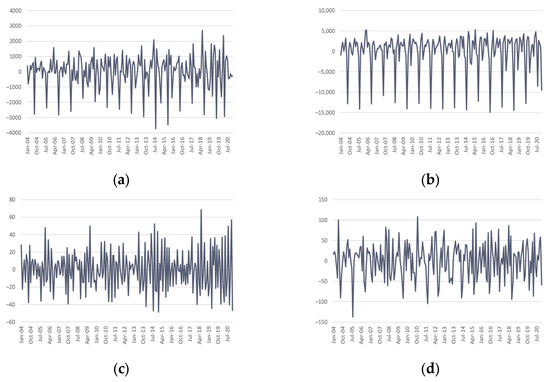
Figure 1.
Seasonal pattern of part-time employees: hours worked by males (a) and females (b); number of part time employees who were male (c) and female (d). Monthly series, Jan 2004–Dec 2020 (in thousands).
3.2. The Indirect Approach in VELA
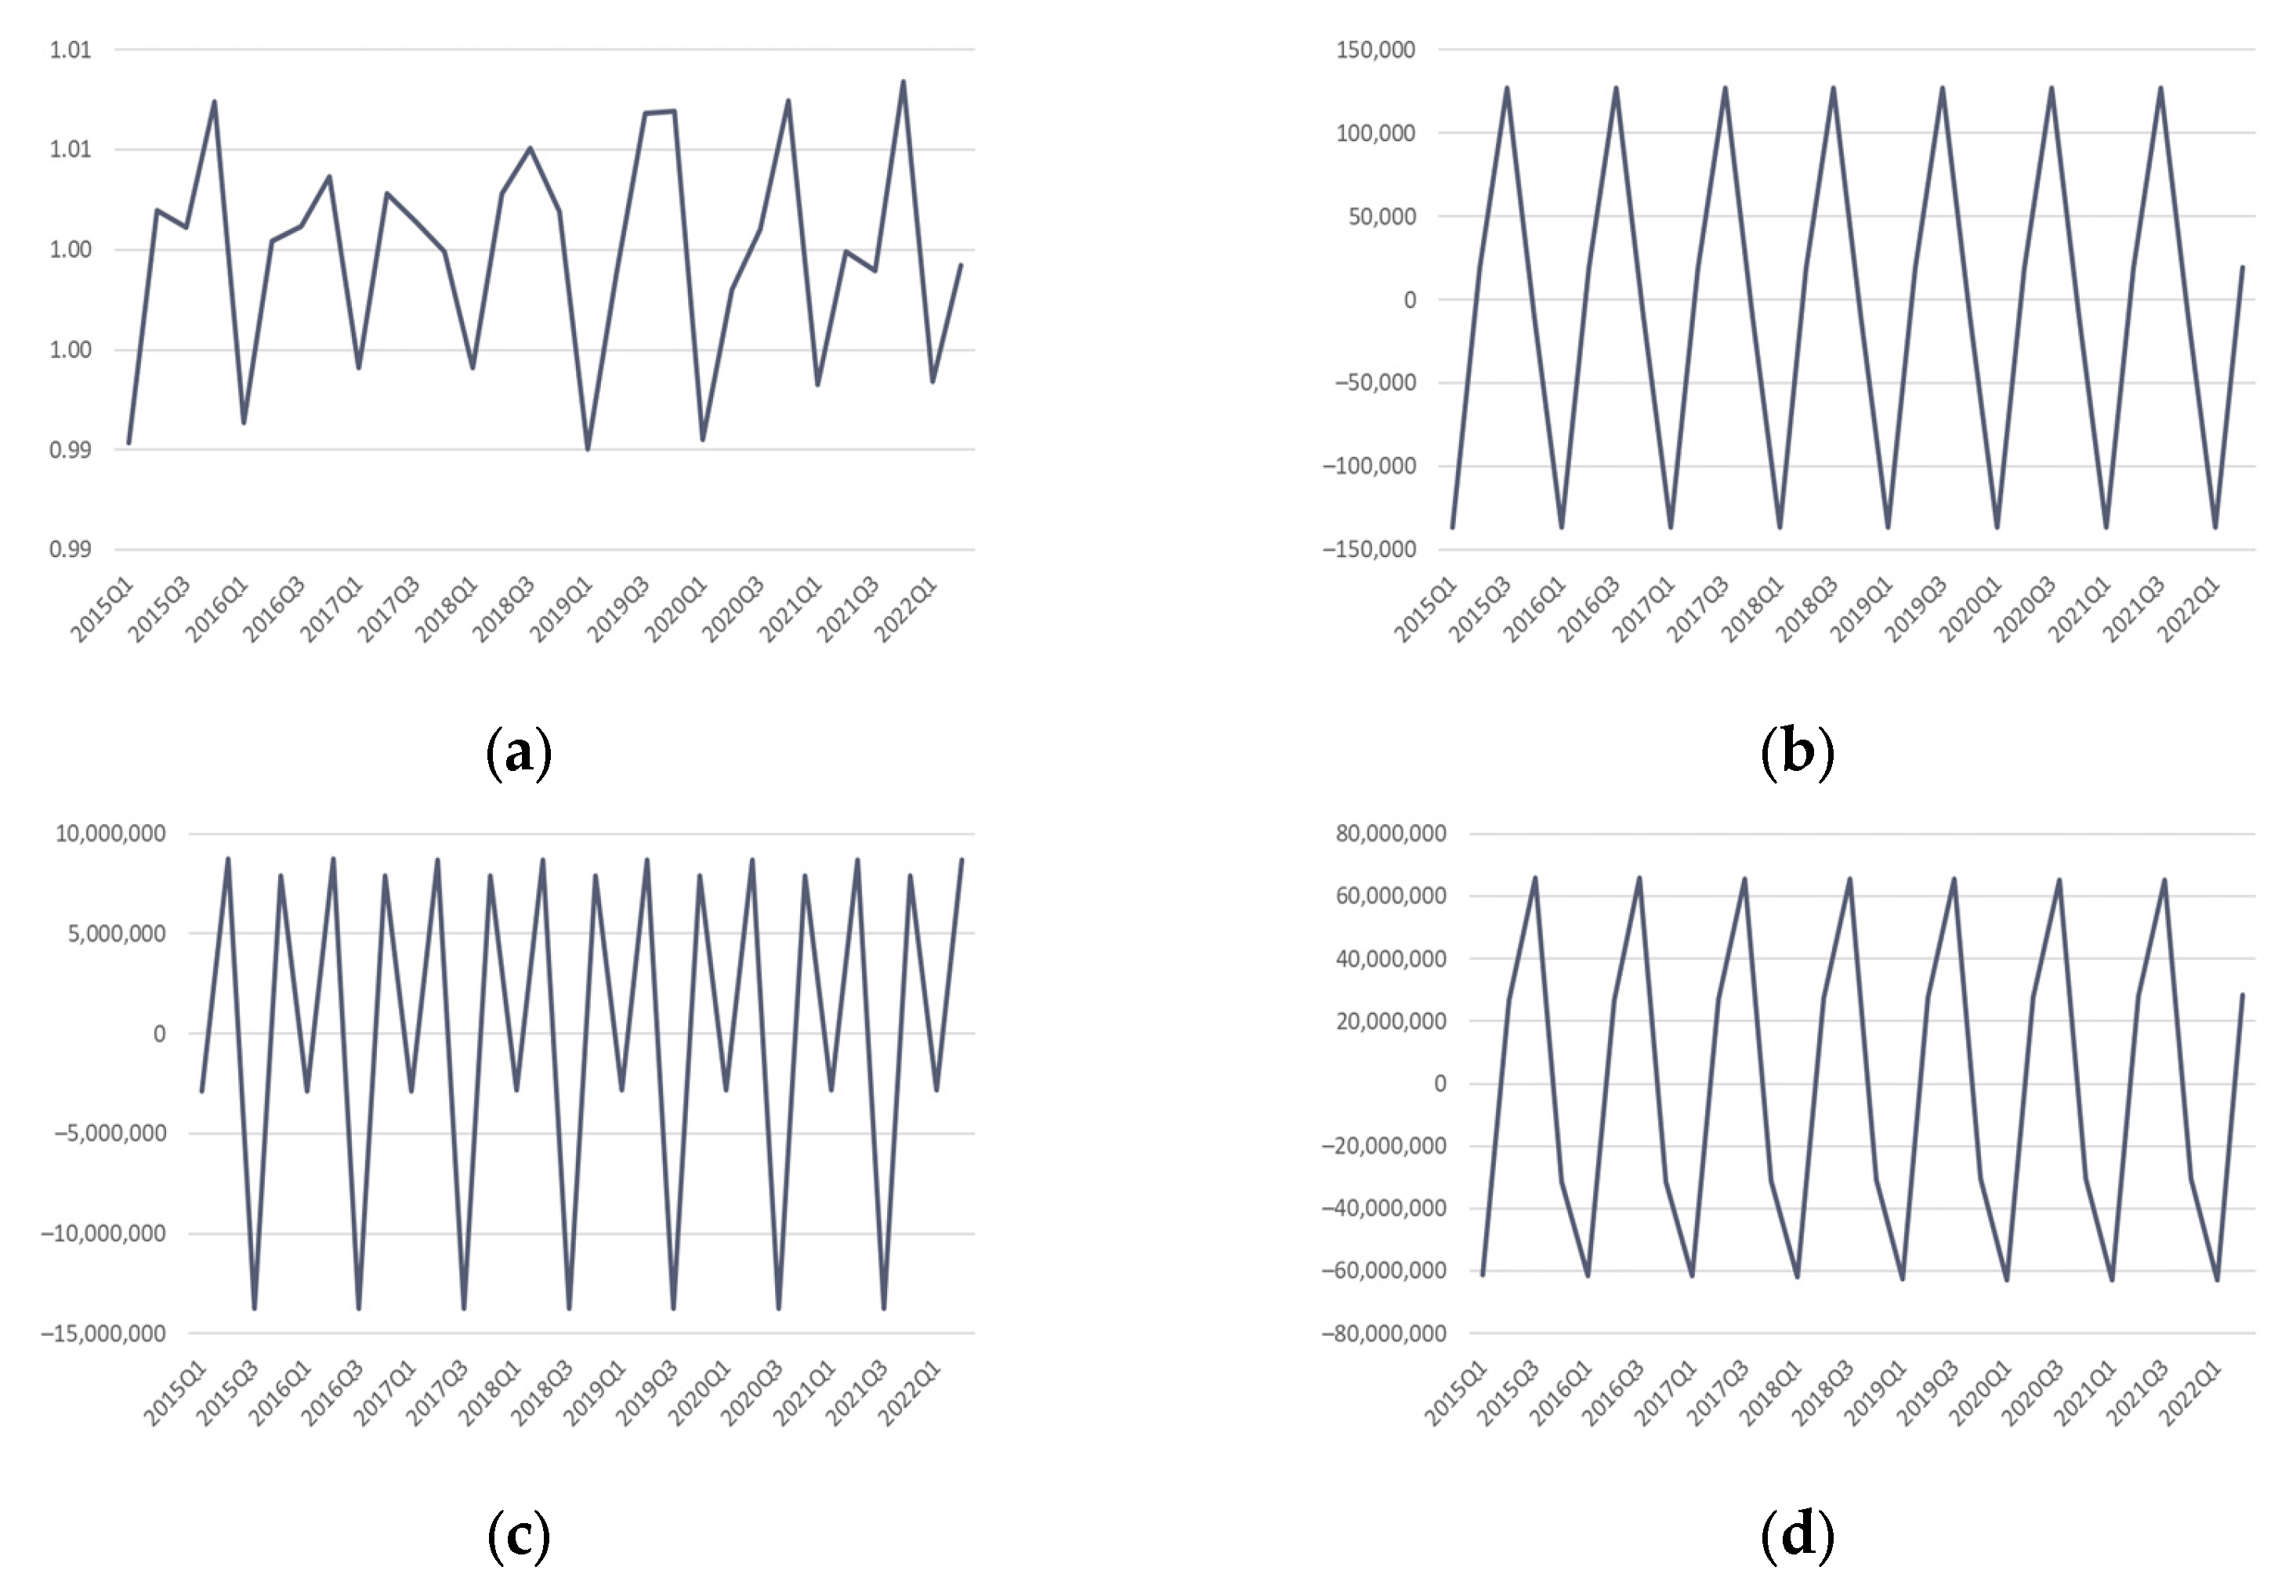
Different seasonal patterns are observed also in VELA data series (Figure 2); in particular, the seasonality of the number of hours (a and b) and employees (c and d) in the economic activity sectors H (a and c) and I (b and d) are shown here. Sector H (transport and storage) and sector I (accommodation and food service activities) are two of the main sectors contributing to the market services aggregate (sectors G to N), with a weight of between 10 and 15%. The difference in seasonality emerges both in the hours worked in the two sectors (a vs. b), with sector H (a) having almost no seasonality, and in the number of employees employed in them (c vs. d). The comparison of hours worked and employees employed within the same sector (a vs. c for sector H and b vs. d for sector I) also reveals strong seasonal differences that justify the application of the indirect approach.

Figure 2.
Seasonal patterns in sector H and I: hours worked (a,b); number of employees (c,d). Quarterly series, 2015Q1–2022Q2.
The use of the indirect method also makes it possible to re-aggregate the number of seasonally adjusted hours and number of employees according to the detail of interest, and to obtain, through a ratio of these figures, the number of hours actually worked per capita, adjusted for seasonal effects.
The quality of this methodology was assessed using all of the indicators defined in the literature. In particular, in the seasonal adjustment phase of the single series, the guidelines established by Eurostat [1] for model definition, outlier detection, the use of calendar effects where present, etc. were respected, while in the evaluation phase of the results, checks on residual seasonality were carried out, as well as a revision analysis.
For the seasonal adjustment of each series, the TRAMO/SEATS algorithm [3] implemented in JDemetra+ was used.
This algorithm, adopted by leading European statistical agencies and central banks, allows each series to be decomposed into its stochastic, not directly observable components: the trend cycle, the seasonality, and the erratic component. The decomposition of the series is achieved via a parametric ARIMA model-based procedure. The first stage of the method (TRAMO) allows for the pre-treatment of the series: calendar-related systematic components and possible outliers are identified. It also performs the automatic selection of the ARIMA model and estimation of its parameters, as well as regression coefficients related to outliers and calendar-related systematic effects. In the second step (SEATS), the linearized series obtained from the pre-treatment is then decomposed into its cyclo-trend, seasonal, and irregular components.
In the case of the Labor Force Survey, and for the following application to the VELA series, the presence of calendar effects was checked only for the series relating to hours actually worked, for which it is plausible that the presence of holidays results in fewer hours worked. In contrast, for the denominator series relating to the employed, the absence of calendar effects was imposed because, by definition, an individual’s employment status is not affected by the number of working days but depends on having worked at least one hour in the reference week.
TRAMO’s automatic identification procedure was relied upon to identify outliers, subject to ex-post evaluation of their significance and eligibility.
As mentioned above, once the seasonally adjusted series have been obtained, the application of the indirect method allows for the aggregation of the series of total hours with that of employment according to the detail of interest and the construction of the index of hours actually worked per capita. Then, the series obtained indirectly by aggregation or by ratios are again processed in TRAMO/SEATS to check the absence of residual seasonality. The possible presence of residual seasonality would require a new seasonal adjustment of the series in search of the optimal decomposition, with negative seasonality tests at the aggregation stage.
All of the above regarding the methodology adopted in the Labor Force Survey for the production of the hours actually worked per capita was applied to the VELA survey series.
The quarterly Istat official survey on job vacancies and hours worked (VELA) collects information on hours worked and Cig hours. Two indices regarding labor input are derived from this survey: the number of hours worked and hours worked per capita. The indices are on a fixed basis and are obtained for each economic activity section as a ratio of the value of the indicator in the reference quarter to the average value of the base year (2015). The number of hours worked is the sum of the hours worked by employees (ordinary and extraordinary). The hours worked per capita are obtained by dividing the total hours worked by the average number of employee positions occupied in the quarter.
A direct approach is currently used in the VELA Survey to produce a seasonally adjusted index of hours worked per capita.
The exercise on VELA involved adopting the indirect approach but using disaggregated numerator and denominator series for the economic activity sector only. Specifically, 17 numerator and denominator series corresponding to 17 macro-sectors of economic activity identified according to the NACE Rev.2 classification were seasonally adjusted.
In this case, at the aggregation stage, the absence of residual seasonality was checked both in the aggregate series at the sector level, separately for total hours and number of employees, and in the index series given by the ratio of total hours actually worked to the number of employees. The aggregation covers, in detail, macro-sectors B to E; B to F; B to N; B to S, G, H, and I; G to N; G to S; M and N, L, M, and N; and P to S.
Once the indicator series had been obtained via the indirect method, an initial validation was carried out by comparing them with the same ones produced by the direct method and then also with those derived from other closely related surveys, in order to assess their consistency (for more details, see Section 5). The comparison was carried out on the series of cyclical changes by using indicators usually applied in the revisions analysis that allowed us to assess the magnitude and significance of the occurred differences between different releases of the same series.
In the following sections (see Section 5), the indicators resulting from the comparisons will be detailed. Through an analysis of them, it will be possible to give an assessment of the eligibility of the indirect method in the seasonal adjustment of hours actually worked per capita derived from the VELA survey.
4. Revision Measures Applied
The quality of the new VELA seasonally adjusted series has been assessed by means of the main revision standard measures [4,5].
In particular, to assess the average magnitude of revision, the following were considered: the mean absolute revision (MAR), which provides a measure of the revision adjusted for the offsetting effect due to opposite revisions, expressed by Formula (3) as
where Lt represents the value of the cyclical change at time t relative to the series calculated by the indirect method and Pt that of the series obtained by the precedent method; and the relative mean absolute revision (RMAR), or RMA normalization, illustrated by Formula (4):
This was to take into account the fact that, in periods characterized by very large fluctuations, revisions may be larger and to compare series for different economic sectors or time periods with each other.
For an assessment of the direction of the revisions (underestimation/overestimation), the mean revision (MR), of which only the sign and not the numerical value was considered (Formula (5)), was considered, accompanied by the corresponding test on the hypotheses that it is or is not significantly different from zero:
Therefore, a positive (negative) mean revision with significant test denotes a systematic underestimation (overestimation) by the source series (P) compared with the L series defined by the indirect method.
5. Main Results
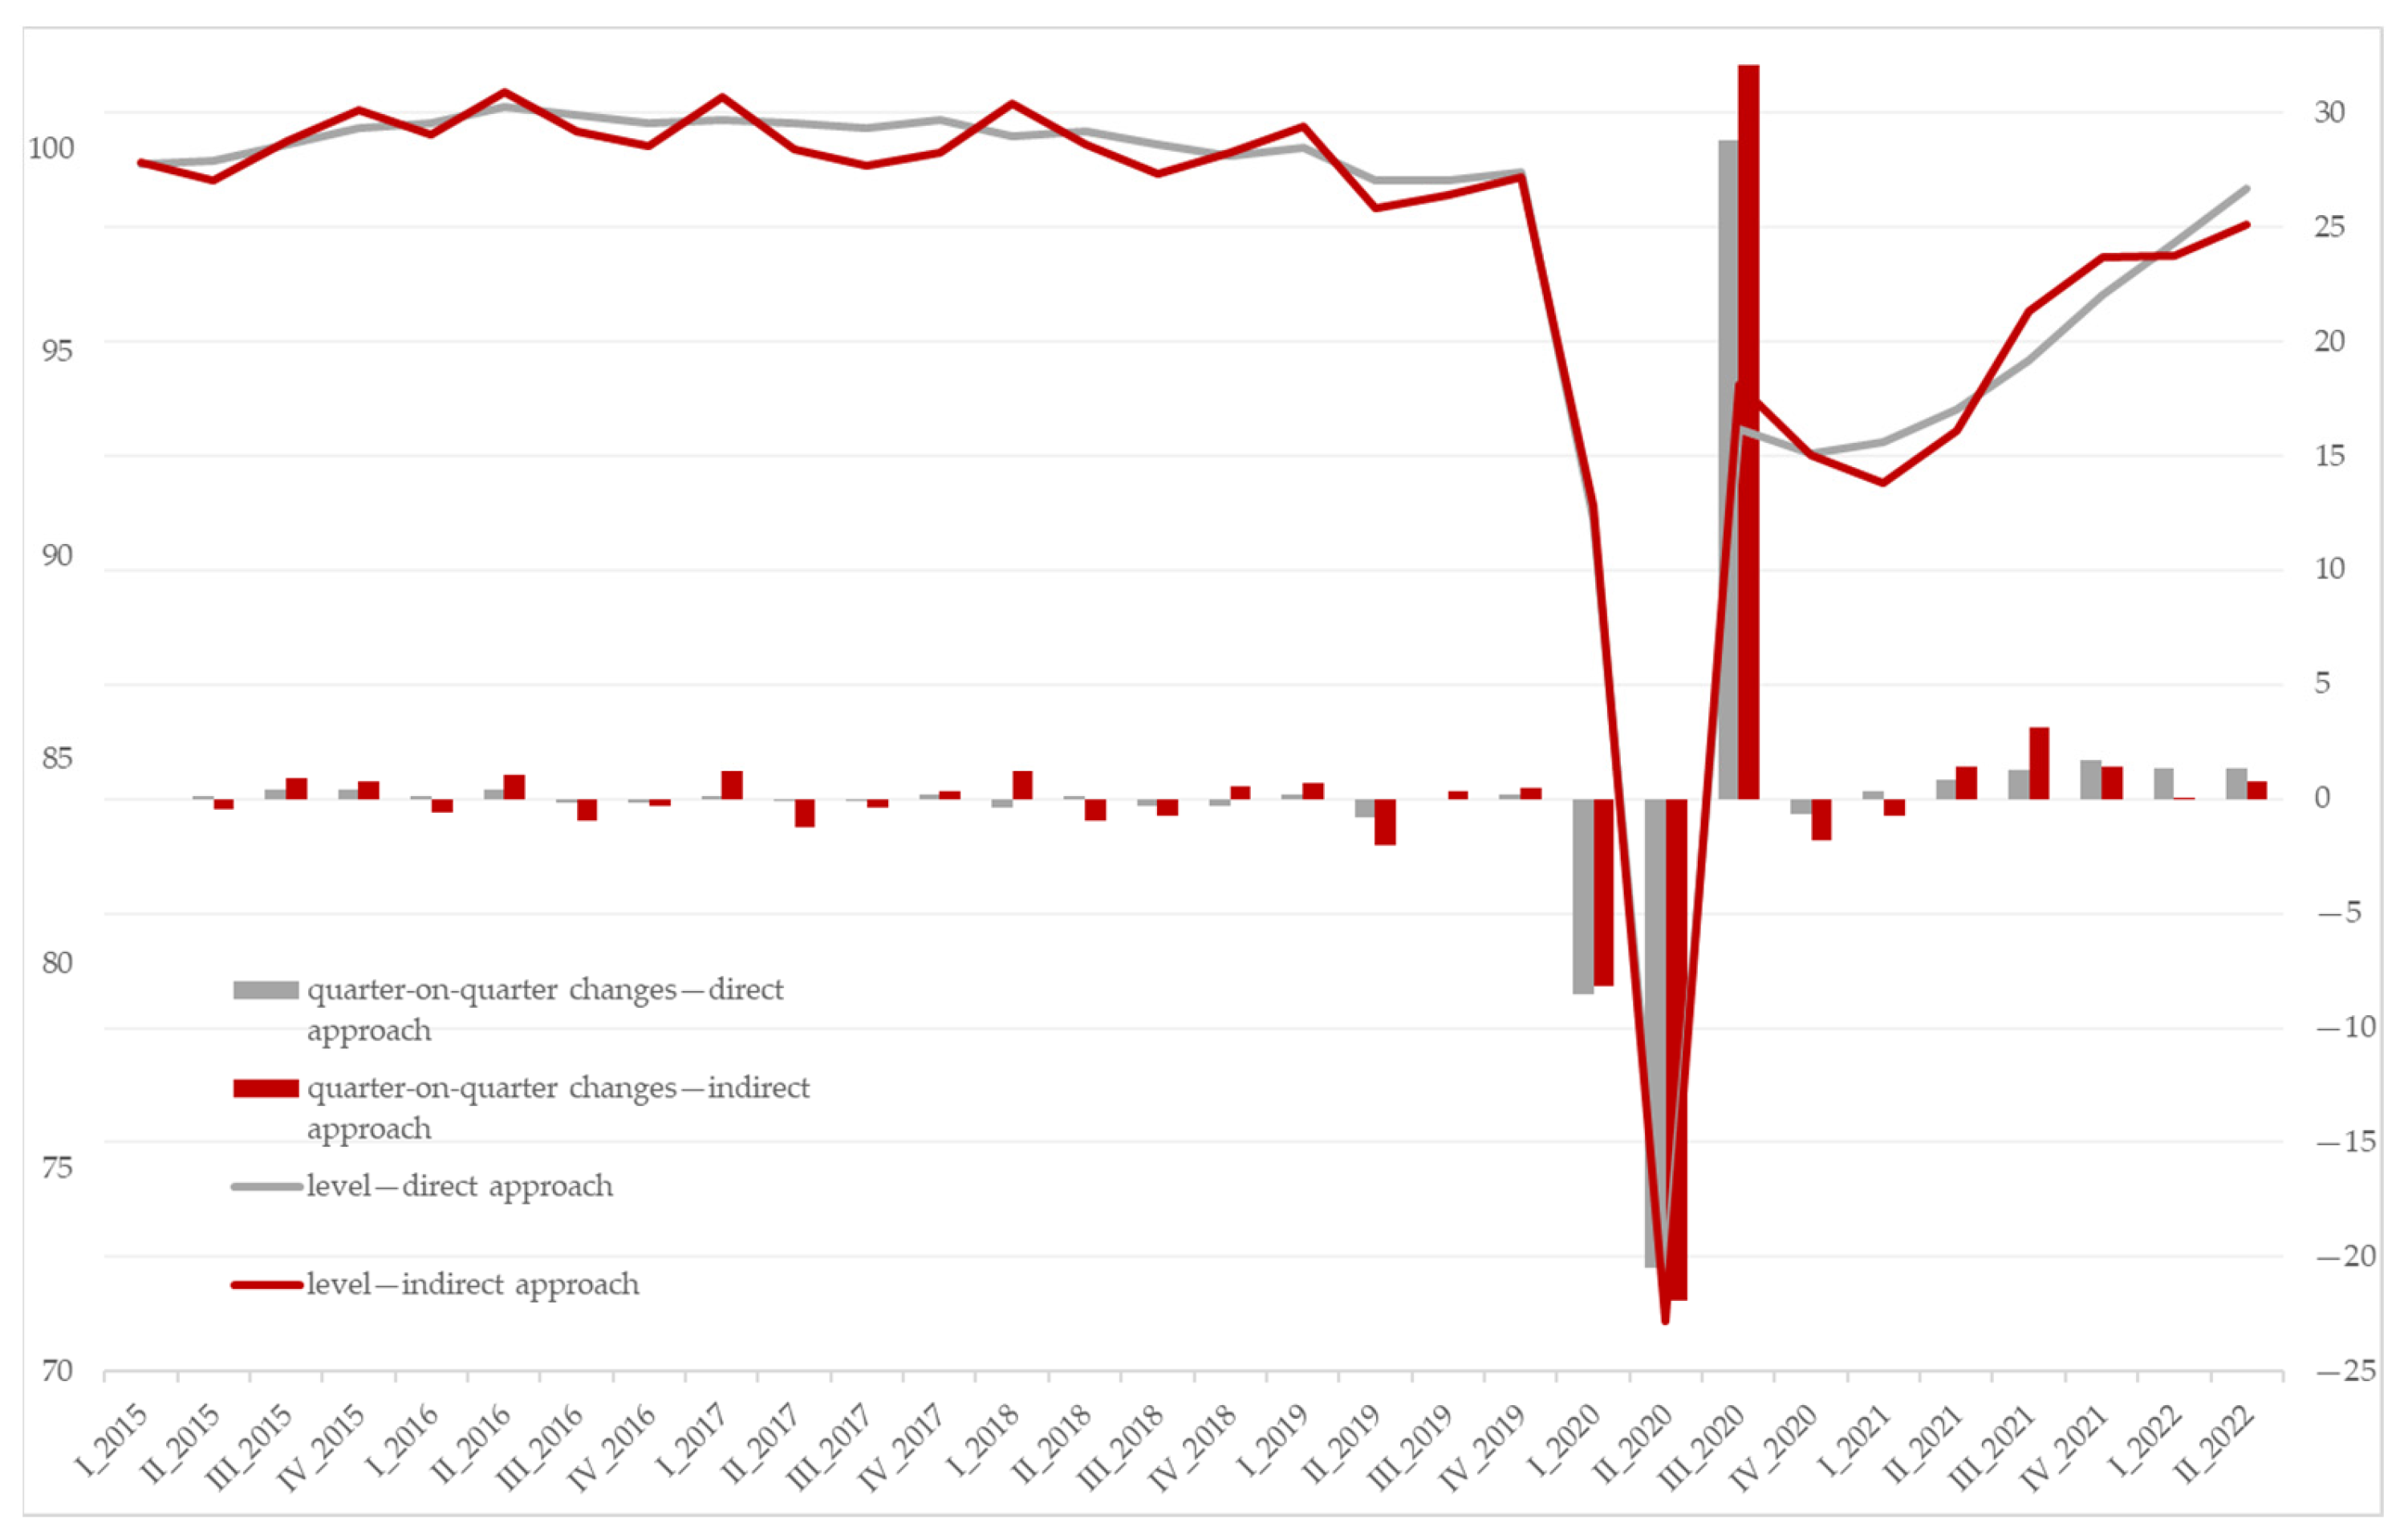
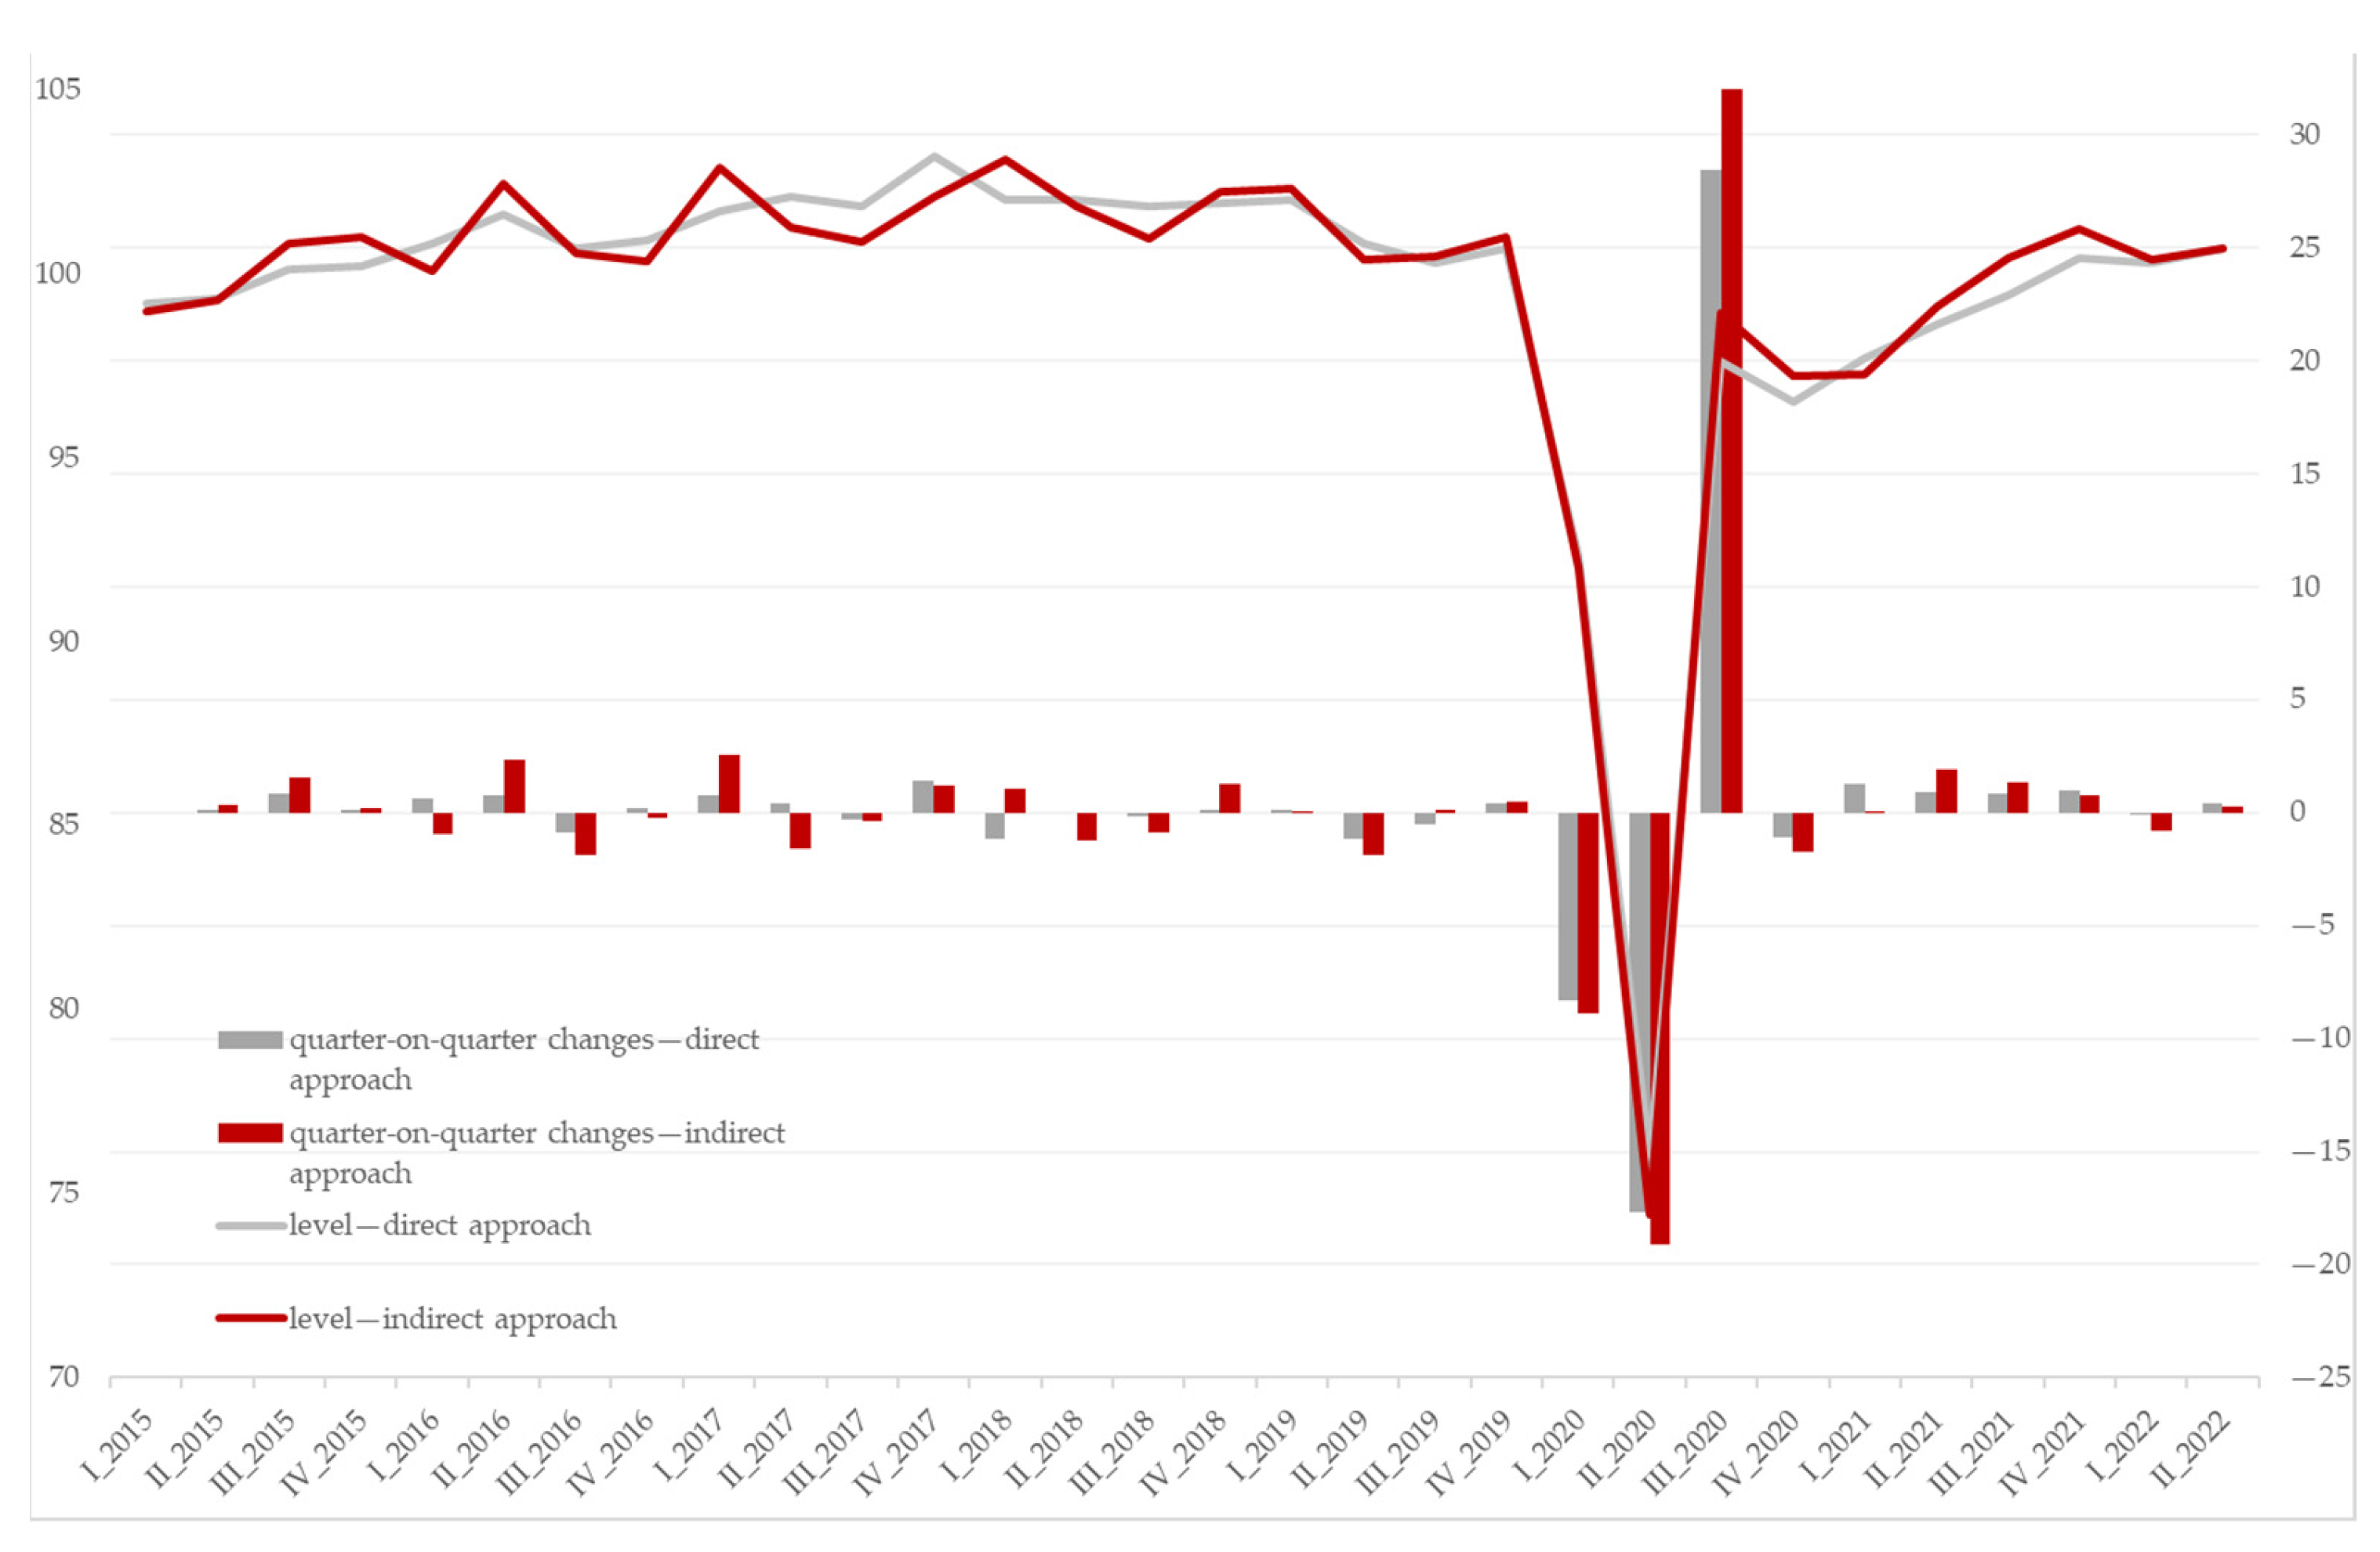
A comparison has been made between the use of the indirect and direct approach when applied to the seasonally adjusted VELA worked hours per capita indices. In particular, Figure 3, Figure 4 and Figure 5 show the hours worked per capita and their quarterly-on-quarterly changes in the two seasonal adjustment approaches, for the total economy (economic activity sections from B to S of the classification NACE Rev. 2), industry (sections from B to F), and services (G–S), separately.
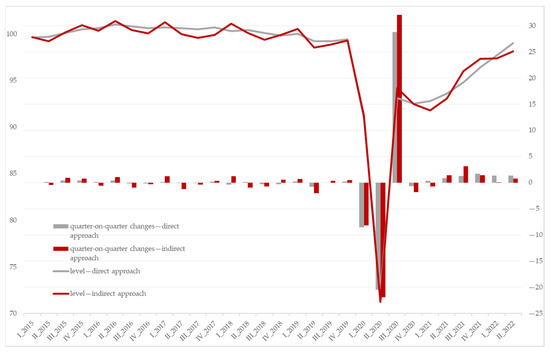
Figure 3.
VELA worked hours per capita indices, indirect vs. direct approach. Total economy (B–S)—I quarter 2015–II quarter 2022. Level (left scale) and quarter-on-quarter changes (right scale). Seasonally adjusted indices.

Figure 4.
VELA worked hours per capita indices, indirect vs. direct approach. Industry (B–F)—I quarter 2015–II quarter 2022. Level (left scale) and quarter-on-quarter changes (right scale). Seasonally adjusted indices.
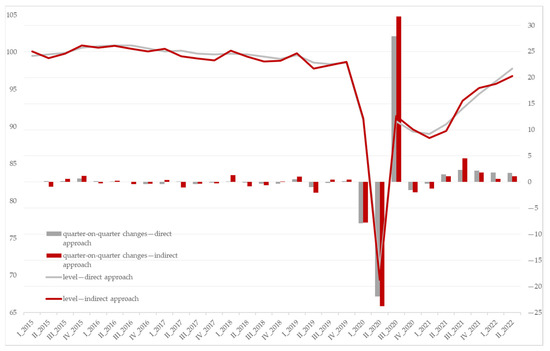
Figure 5.
VELA worked hours per capita indices, indirect vs. direct approach. Services (G–S)—I quarter 2015–II quarter 2022. Level (left scale) and quarter-on-quarter changes (right scale). Seasonally adjusted indices.
As the figures show, the series seasonally adjusted by the indirect method show cyclical changes that are slightly larger—mainly in the aggregated industry sector—than those obtained by the direct method, and of the same sign in most quarters (around 80%). This was somewhat expected as the indirect method allows the seasonally adjusted aggregate series to better represent the different characteristics and behavior of each component series than the direct approach.
Moreover, the MAR and RMAR revision measures were calculated based on the quarter-on-quarter changes and taking into account all the economic activity sections (Table 1).

Table 1.
MAR and RMAR revision measures by NACE Rev. 2 economic activity section—average values, I quarter 2015–II quarter 2022.
The absolute differences account for less than two percentage points, with the exception of sectors I (Accommodation and food services) and R (Arts, entertainment, and recreation). These two sectors were the most affected by the COVID emergency in the period between Q3 2020 and Q3 2021. Therefore, they were characterized by higher quarterly changes during this period. In this case, the RMAR measure is a more reliable revision measure for understanding the actual impact of the new seasonal adjustment method. For these two sections, the RMAR measure shows no significant differences compared to the other sections.
In addition to this, the signs of quarter-on-quarter changes in the new VELA series were compared with those of other Istat macroeconomic indicators, related to hours worked: namely, the total employee jobs from the OROS (employment, wages and salaries, and social charges) survey, the Industrial Production Index, the Construction Production Index, and the Turnover in Services Index. The signs are concordant between 60% and 90% of the total quarters, depending on the economic activity section. Moreover, the average difference between quarter-on-quarter changes in the new VELA series and those of the above-mentioned indicators does not exceed 3%, on the total quarters considered, varying according to the economic activity section.
After these preliminary analyses of the performance of the new VELA series compared to those currently in use, the impact of the new method on reducing the number of outliers and the size of the residual outlier was evaluated. No out-of-range data were observed with the new method, whereas the current procedure based on the direct method produced around 20 out-of-range data points in the period under observation, mainly concentrated in the industry sector. As mentioned above, in this sector, the new indirect approach seems to have modified the original series more than in the service sector.
6. Conclusions
The application of the indirect approach to the seasonal adjustment to the VELA hours worked per capita series, as produced by the LFS, has led to important results both in terms of quality and as an example of the synergies developed by integrating the methodologies followed by different surveys.
The impact of the COVID emergency, which affected the economic activity sectors in various significant ways, highlighted the presence of a non-negligible number of inconsistencies (also called out-of-range data) between the quarter-on-quarter changes of aggregated activity sectors and those of each component section.
Using the method adopted by the LFS, the number of out-of-range data points was greatly reduced, with the advantage that the VELA series did not demonstrate significant revisions when switching from the direct to the indirect method.
This work represents a positive example of the replication of methodologies among surveys with different characteristics. The use of a common methodology is also an important step in the direction of greater comparability between data from different sources.
The encouraging results shown so far by the application of the LFS seasonally adjusted method to the VELA indicator on hours worked per capita encourage us to continue in this direction.
Author Contributions
C.G. wrote Section 4; A.L. wrote Section 5; M.L. wrote Section 3.2; E.M. wrote Section 2; A.S. wrote main text of Section 3 and Section 3.1. All authors wrote the Introduction and Conclusion sections. All authors have read and agreed to the published version of the manuscript.
Funding
This research received no external funding.
Institutional Review Board Statement
Not applicable.
Informed Consent Statement
Not applicable.
Data Availability Statement
Data sharing is not applicable to this article. The data presented in this study are still experimental, as they are the result of a preliminary exercise under development.
Conflicts of Interest
The authors declare no conflict of interest.
References
- Eurostat. ESS guidelines on seasonal adjustment. In Eurostat Manuals and Guidelines; Eurostat: Luxembourg, 2015. [Google Scholar]
- Istat. La rilevazione trimestrale OROS su occupazione e costo del lavoro: Indicatori e metodologie. In Metodi e Norme; Istat: Rome, Italy, 2019. [Google Scholar]
- Gomez, V.; Maravall, A. Programs TRAMO and SEATS: Instructions for the user. Mimeo Banco de España 1997, 1–129. [Google Scholar]
- Di Fonzo, T. The OECD project on revisions analysis: First elements for discussion. In Proceedings of the OECD STESEG Meeting, Paris, France, 27–28 June 2005. [Google Scholar]
- McKenzie, R.; Gamba, M. Interpreting the results of Revision Analyses: Recommended Summary Statistics. Contribution to the OECD/Eurostat Task Force on “Performing Revisions Analysis for Sub-Annual Economic Statistics”. 2008. Available online: https://www.oecd.org/sdd/40315546.pdf (accessed on 27 June 2023).


Disclaimer/Publisher’s Note: The statements, opinions and data contained in all publications are solely those of the individual author(s) and contributor(s) and not of MDPI and/or the editor(s). MDPI and/or the editor(s) disclaim responsibility for any injury to people or property resulting from any ideas, methods, instructions or products referred to in the content. |
© 2023 by the authors. Licensee MDPI, Basel, Switzerland. This article is an open access article distributed under the terms and conditions of the Creative Commons Attribution (CC BY) license (https://creativecommons.org/licenses/by/4.0/).