Abstract
The carpet-Type materials painted yellow in pedestrian waiting areas are safety devices used to prevent collisions with vehicles and children. They are primarily recommended to be placed on both the pavement and the wall sides, but local governments in the Republic of Korea place them only on the pavement side, excluding the wall part to reduce the deployment costs and increase the number of deployment sites. The difference in effectiveness between these Types may be different, but this has not yet been proven. This study examines the difference between these Types found in the field test. The test employed two different measures: (1) the level of driver visibility and (2) the vehicle deceleration rate. As a result of the analysis, the yellow carpet installed on both the pavement and the wall sides was comparatively more effective. The test results suggest that this yellow carpet Type should be installed on both pavement and wall sides, particularly for school zone areas, to maximize its safety effects.
1. Introduction
In the Republic of Korea, various efforts have been made to reduce the number of traffic accident victims of a young age. In order to prevent such encounters between children and vehicles in advance, local highways near (a 300 m radius) elementary schools and kindergartens are designated as school zones in the Republic of Korea. Various traffic safety devices, such as speed humps and traffic safety signs, are installed in these areas. Among them, the yellow carpet ensures the drivers’ visibility to children by installing a waiting space in yellow before the crossing.
According to the yellow carpet installation standards prepared by the Ministry of Public Administration and Security, yellow materials should be painted on the walls and pavements, or yellow temporary surfaces should be installed if there are no walls [1]. However, due to local governments, they are sometimes installed only on the pavements for various reasons, such as reducing installation.
The yellow carpet’s effect of promoting ‘traffic safety for children’ may be different when the ‘yellow blocks’ that draw attention to child pedestrians are (1) installed only on the pavement and (2) installed on walls built together with the pavement. If ‘yellow blocks’ are installed only on the pavement without the walls, it may be difficult to easily spot children standing on the yellow carpet from the driver’s point of view. However, the effect of promoting children’s traffic safety as a result of these two situations has not been examined. Hence, this study compares the difference in the effectiveness of children’s traffic safety when yellow carpets are installed in two different ways.
2. Research Approach
In this study, two Types of yellow carpets were installed as shown in Table 1, with Type A installed on the pavement and rear walls at the same time and Type B installed only on the pavement.

Table 1.
Comparison of yellow carpet Types deployed in the field.
The two Types of indicators in Table 2 were applied to analyze the difference in effects observed in the above two morphological facilities.
Table 2.
Analysis measures and data collection methods.
2.1. Drivers’ Visibility Analysis Method
In this study, the VAS (Visual Attention Software) analysis method performed in previous studies was applied to quantify the ‘level of drivers’ visibility’. As mentioned above, VAS is a technology that quantifies the degree to which the eyes are dispersed or concentrated on products arranged in a specific place as ordinary consumers enter the store. This study estimates the degree to which drivers focus their attention in the direction of the ‘yellow carpet’ as they enter the school zone by applying this technology.
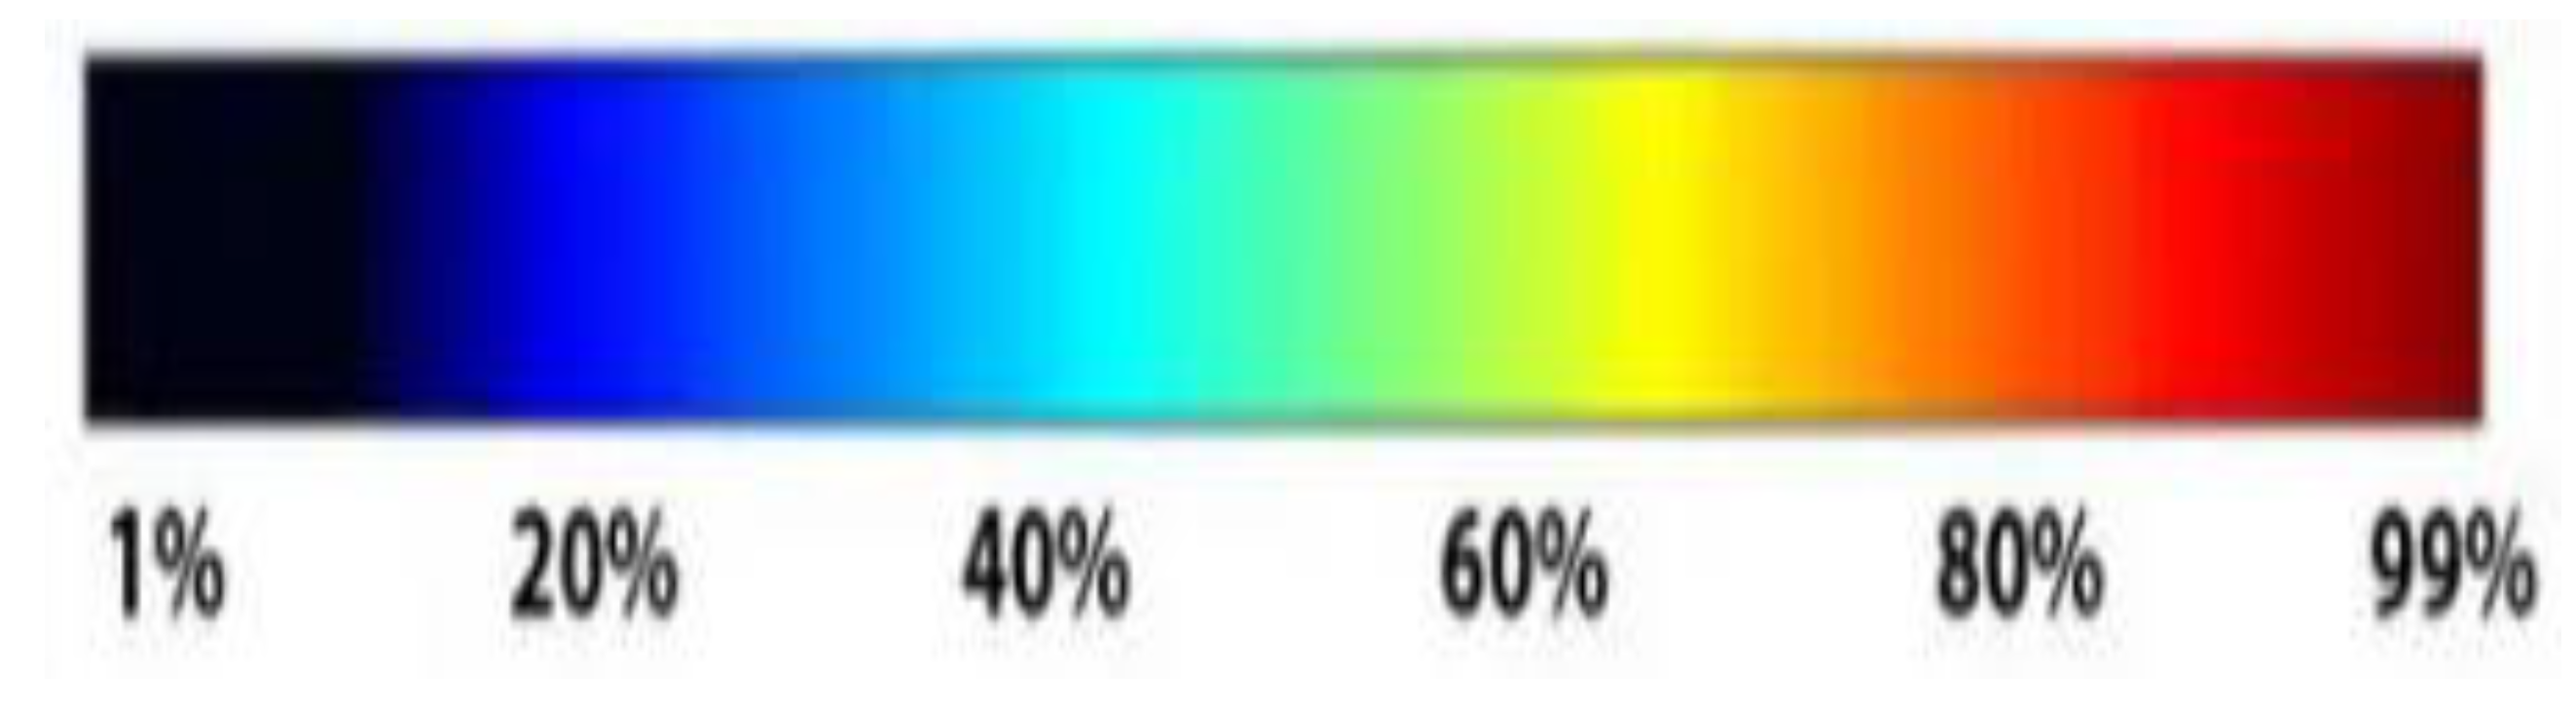
VAS numerically expresses the probability that a person will focus on a specific object. As shown in Figure 1, the high concentration point is expressed as ‘red’, the middle concentration point is expressed as ‘yellow’, and the low concentration point is expressed as ‘dark’ [2]. Through this color scheme, the concentration of the gaze is expressed with a heating map.

Figure 1.
VAS heat map visibility range.
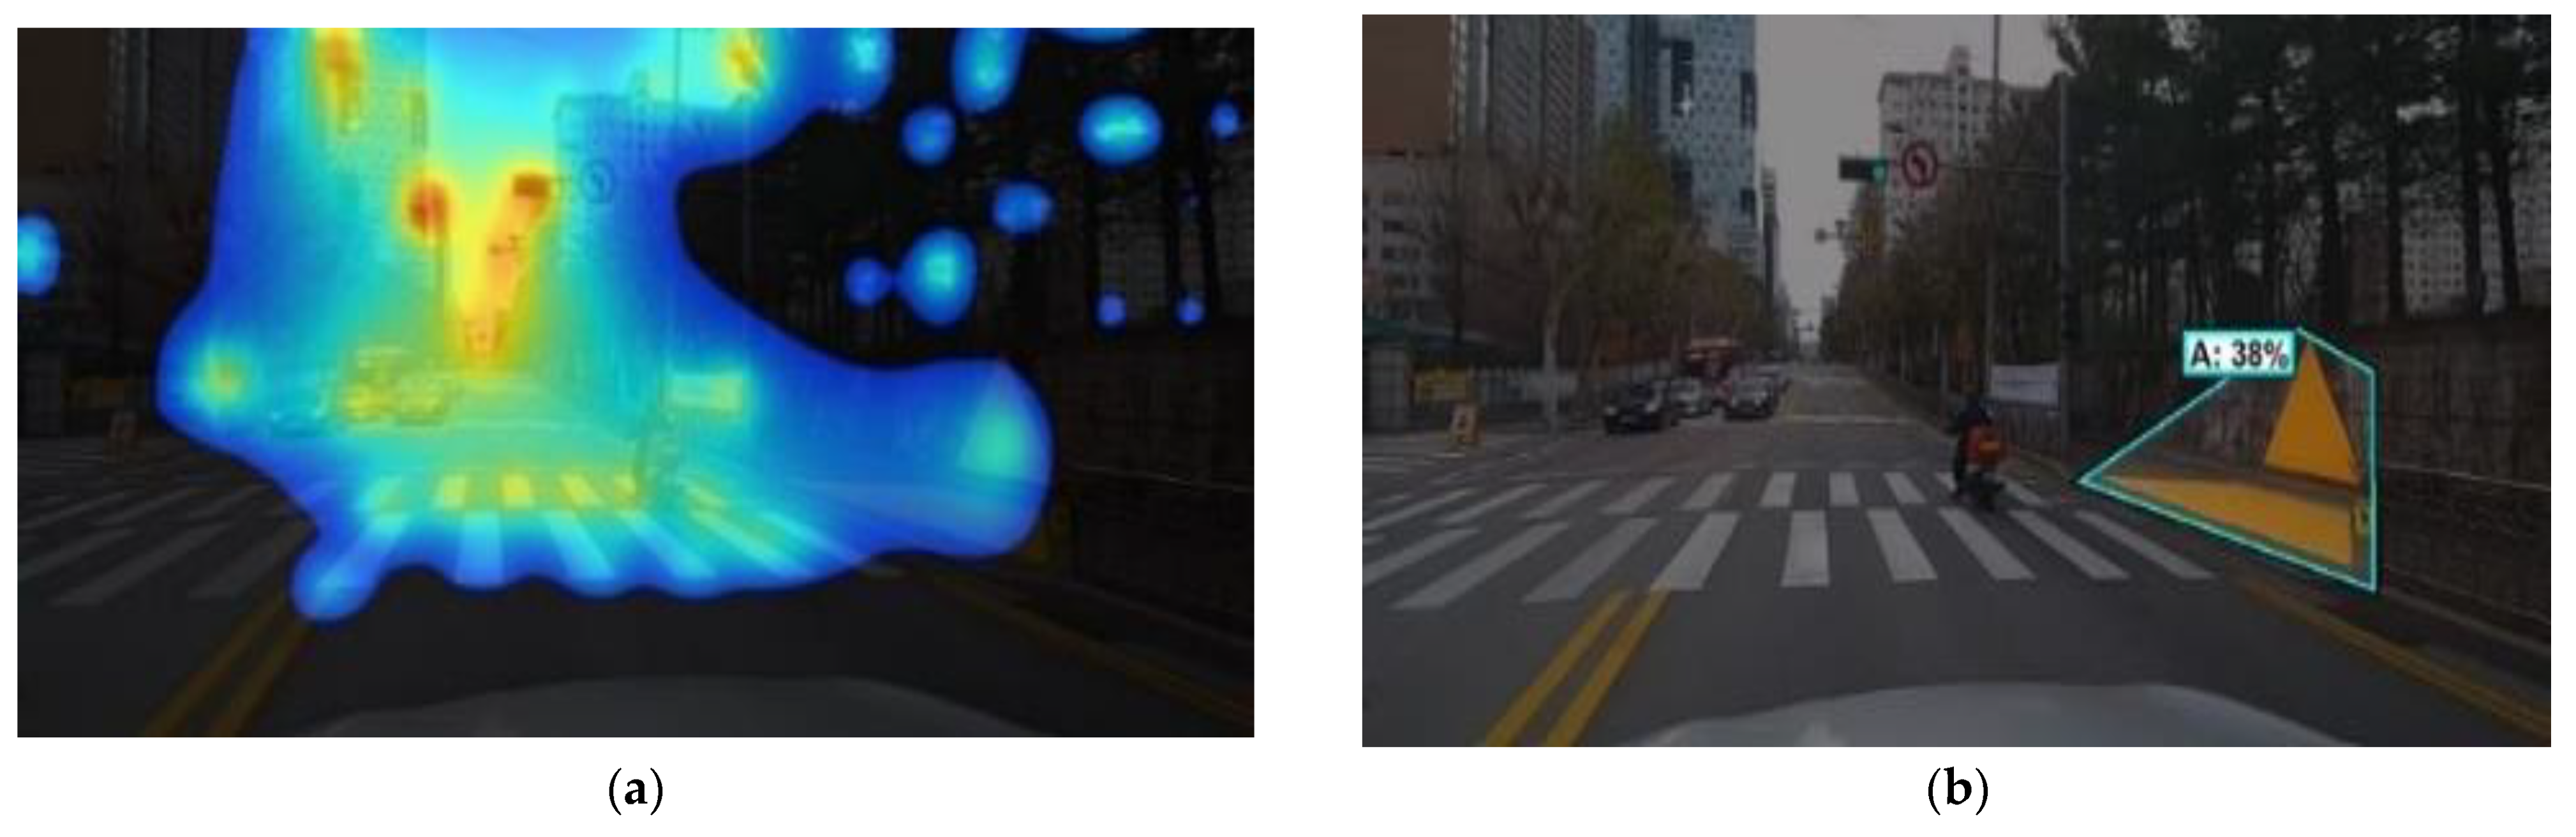
Figure 2 is an example of an analysis after setting a yellow carpet for the ‘area of interest’. Figure 2a is a ‘drivers’ visibility concentration’ heat map derived through VAS analysis, and Figure 2b presents the results of the ‘drivers’ visibility concentration’ analysis related to a specific point in connection.

Figure 2.
(a) Intermediate heat map analysis results. (b) Drivers’ visibility.
2.2. Cruising Speed Analysis Method
The point speed collection method was not adopted to collect data on the change in cruising speed, but the interval speed collection method was selected in this study to collect data on the change in cruising speed.
The field video data collection method using a drone was applied as a method of collecting driving speed indicator data in a school zone. After collecting on-site video data through drone aerial shooting, driving speed data were extracted by referring to location and time information obtained per image frame using the Vegas Pro 17 image-processing program. Based on the collected data, the driving trajectory data of individual vehicles were analyzed, and through this, data on changes in driving speed were collected. Night shots of drones are not institutionally allowed. Therefore, this analysis excluded a night driving speed analysis from the scope of the study.
3. Results
A paired t-test was conducted to confirm whether the analysis results were statistically significant. The null hypothesis and the opposing hypothesis are outlined below. The hypothesis test was conducted at the 95% confidence level ( = 0.05):
: No difference in visibility and speed after installation of the yellow carpet.
: Visibility and deceleration effects after installation of the yellow carpet.
3.1. Visibility
3.1.1. Daytime
Table 3 shows the drivers’ visibility concentration before and after installation according to the yellow carpet Type in the daytime. Both yellow carpet forms A and B rejected the null hypothesis and confirmed that visibility was improved.
Table 3.
Drivers’ visibility t-test according to yellow carpet installation Types A and B—daytime.
3.1.2. Night-Time
Table 4 shows the drivers’ visibility concentration before and after installation according to the yellow carpet Type at night-time. As a result of the analysis, only the yellow carpet installed in the form of Type A was rejected. Therefore, it was found that only Type A has an effect in enhancing the drivers’ visibility.
Table 4.
Drivers’ visibility t-test according to yellow carpet installation Types A and B—night-time.
3.2. Cruising Speed
Table 5 shows the cruising speed before and after installation according to the Type of yellow carpet. Both yellow carpet Types A and B rejected the null hypothesis, confirming that the cruising speed decreased.
Table 5.
Cruising speed t-test according to yellow carpet installation Types A and B.
3.3. Overall Result
Table 6 summarizes the results derived from this study.
Table 6.
Yellow carpet installation effect (95% confidence level).
It was determined that the on-site yellow carpet was effective compared to the situation where there was no yellow carpet (95% confidence level), without distinguishing between Type A and Type B. However, it was determined that the installation of ‘Form A’ had a positive effect in night situations, while ‘Form B’ had no safety promotion effect because it was statistically the same as the situation without the ‘Yellow Carpet’ (95% confidence level).
Referring only to the figures derived from this study, it was found that the installation effect of ‘Yellow Carpet Type B’ was half that of ‘Yellow Carpet Type A’, and the effect could not be evaluated in the night-time.
When safety management in a child protection zone is not limited to daytime but also includes night-time, it would be desirable to install a yellow background color in a form that can be effective for night-time. It is a “Type A” that applies to both the pedestrian waiting space pavement and the wall.
4. Conclusions
In preparation for the absence of a yellow carpet, situations in which the yellow carpet is installed in the form of two different Types were classified, compared, and analyzed. In the case of yellow carpets, it was determined that full installation, including the wall, rather than installation on the pavement alone, met the goal of promoting traffic safety in the school zone. Therefore, when local governments install yellow carpets, additional efforts are needed to create a safe transportation environment for children by installing the materials on pavements and walls.
Author Contributions
Conceptualization, J.-T.K. and J.L.; methodology, J.-T.K.; software, J.L.; validation, J.-T.K. and J.L.; formal analysis, J.-T.K.; investigation, J.L.; resources, J.L.; supervision, J.-T.K.; project administration; J.-T.K. All authors have read and agreed to the published version of the manuscript.
Funding
This work was supported by a Korea Institute of Police Technology (KIPoT) grant funded by the Korea government (KNPA) (No.092021C29S02000, Development of on-site control technology for road traffic network control in the event of an incident or disaster).
Institutional Review Board Statement
Not applicable.
Informed Consent Statement
Not applicable.
Data Availability Statement
Not applicable.
Conflicts of Interest
The authors declare no conflict of interest.
References
- Ministry of Public Safety. Yellow-Carpet Fabrication and Installation Guidelines, Republic of Korea. 2018. Available online: http://incrc.org/resources/?pageid=7&mod=document&uid=349 (accessed on 28 June 2023).
- Ahn, H.S.; Kim, J.T. Study on Visual Recognition Enhancement of Yellow-carpet Placed at Near Pedestrian Crossing Areas: Visual Attention Software Implementation. J. Inf. Technol. Serv. 2016, 15, 73–83. [Google Scholar]
Disclaimer/Publisher’s Note: The statements, opinions and data contained in all publications are solely those of the individual author(s) and contributor(s) and not of MDPI and/or the editor(s). MDPI and/or the editor(s) disclaim responsibility for any injury to people or property resulting from any ideas, methods, instructions or products referred to in the content. |
© 2023 by the authors. Licensee MDPI, Basel, Switzerland. This article is an open access article distributed under the terms and conditions of the Creative Commons Attribution (CC BY) license (https://creativecommons.org/licenses/by/4.0/).