Abstract
A production system comprises a series of interconnected processes involving planning, processing, and product distribution. The effectiveness and efficiency of such systems play a vital role in reducing operational costs, enhancing productivity, and improving product quality. As such, regular evaluation of production systems is essential to identify inefficiencies, waste, and bottlenecks, and to develop targeted strategies for improvement. This research aims to construct a simulation model of a production system using FlexSim software as a decision-support tool to facilitate performance evaluation and the development of scenario-based solutions. By employing a simulation-based approach, this study enables the analysis of the production process without interfering with actual operations, thereby minimizing associated risks and reducing the consumption of time and resources. Furthermore, simulation allows for virtual testing of various operational scenarios, including modifications in production capacity, workforce allocation, workflow configurations, and the implementation of emerging technologies. In this case study, the production process was predominantly constrained by operator waiting time, which constituted approximately 30% of the total processing time. In response, an alternative scenario was developed wherein operators with lower utilization rates were reassigned to workstations characterized by high operator wait times. The implementation of this scenario yielded a 29.5% reduction in average queue waiting time and a 31.7% decrease in total production time. These findings demonstrate a substantial improvement in production efficiency. Therefore, the outcomes of this study are expected to provide valuable insights for strategic decision-making and support the optimization of production systems in industrial environments.
1. Introduction
Production systems are crucial to manufacturing operations, involving a variety of interconnected activities, including planning, processing, and distribution, that collectively influence the performance and competitiveness of industrial companies [1]. Modern production systems comprise interwoven processes whose combined performance has a significant impact on operational costs, productivity, and product quality. As global markets demand greater efficiency, quality, and responsiveness, companies need to optimize their production processes to eliminate waste, reduce operating expenses, and increase productivity [2]. However, the complexity and dynamic nature of modern production systems make finding inefficiencies difficult, particularly those linked to resource allocation, process flow, and bottleneck creation.
In response to increasingly dynamic market demands and increased pressure for flexibility, manufacturers are turning to digital solutions to uncover inefficiencies, bottlenecks, and waste without disturbing live operations [3,4]. To address these challenges, simulation modeling has been used in industrial engineering. Discrete-event simulation (DES) enables engineers to replicate and analyze real-world production systems in a virtual environment, allowing for performance evaluation without disrupting actual operations [5]. DES has emerged as a core methodology in industrial engineering for virtual experimentation and risk-mitigated decision support [6]. FlexSim 2019, a popular DES software, simplifies scenario testing and decision-making by allowing users to view production processes, quantify key performance indicators, and experiment with system changes such as layout, staffing, and scheduling. This feature is especially useful for evaluating the impact of suggested modifications in controlled and risk-free environments [7].
Applications across various sectors, from furniture and batik manufacturing to liquefied petroleum gas bottling, have demonstrated significant efficiency gains through FlexSim-based simulation and optimization studies [3,8]. Additionally, hybrid and digital twin frameworks are increasingly integrating DES with continuous modeling, optimization heuristics, and intelligent decision-making, such as genetic algorithms and predictive-maintenance schemes, to enhance adaptability and performance in Industry 4.0 environments [9,10].
In this research, we constructed a simulation model using FlexSim to examine a real-world manufacturing system and investigate different operational scenarios. Using a case-based approach, we identified operator waiting time as a primary source of inefficiency to offer a reallocation method based on operator utilization rates. The study results demonstrate how simulation-based interventions can lead to significant decreases in queue waiting times and total production time, highlighting the potential of digital tools to support strategic manufacturing planning and continuous improvement operations.
2. Methods
2.1. Research Design
We employed a case-based, simulation-driven approach to analyze and optimize a real-world production system. The methodology includes data collection, model development using FlexSim, model validation, performance analysis, and scenario development to identify inefficiencies and examine alternative configurations for enhanced operational performance without disrupting actual procedures. FlexSim simulation software is utilized as the primary tool for visualizing workflows, identifying bottlenecks, and testing improvements. Figure 1 illustrates the overall research workflow.
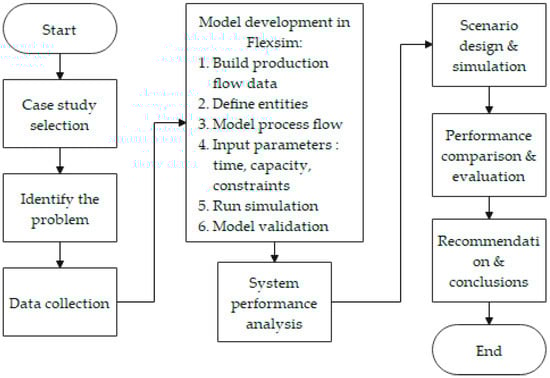
Figure 1.
Research framework.
2.2. Data Collection
Primary data was obtained through direct observation, interviews with production supervisors, and historical production records. The data collected includes the following. The data formed the basis for constructing the simulation model in FlexSim.
- Process flow data: operation sequences, layout, and logic
- Time data: processing time, waiting time, and idle time
- Resource data: operator availability, machine capacity, workstation count
- Product data: types, volumes, cycle times
2.3. Simulation Model
FlexSim was utilized to build a simulation model in alignment with the existing production workflow. To verify the accuracy of the simulation model in representing the actual production system, model validation is conducted by comparing simulated output quantity with empirical data from the real system. The model is deemed valid if the simulation outcomes deviate by no more than 10% from the observed values.
An alternative scenario was developed based on the diagnosis of inefficiencies. In the observed case, operator waiting time emerged as the primary constraint. A scenario was simulated, including reallocating underutilized operators to high-wait-time stations. The scenario is evaluated using the following indicators.
- Average queue time;
- Total production time;
- Resource utilization;
- Throughput.
The scenarios are assessed using quantitative metrics from FlexSim outputs. Performance improvement is measured in percentage reduction in queue waiting time and total processing time.
3. Results and Discussion
In the case studied, the industry comprises several operational processes, ranging from Operation A to H. These operations were equipped with more than one workstation. Table 1 presents the sequence of operations along with the average processing time, time distribution, and the operator assigned to each workstation.

Table 1.
Distribution time of operations.
The industry chosen for the case study was a medium-scale industry, where operators are responsible not only for the main production tasks but also for additional activities outside the primary production process. Figure 2 illustrates the production process layout modeled in FlexSim. Yellow areas represent the main production process stations, while purple areas indicate locations where operators perform activities outside the primary manufacturing process. These non-primary activities are included in the calculation of operator utilization, even though the activities are not directly part of the main manufacturing process. The connecting lines illustrate the assignment and interaction between operators and specific operations within the system.
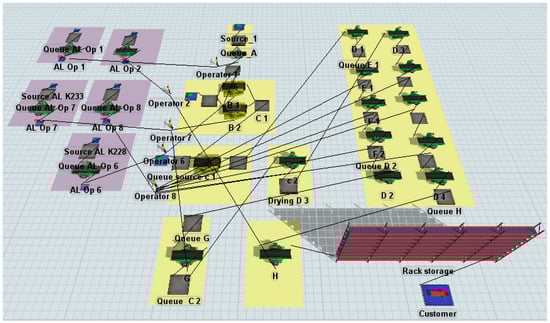
Figure 2.
Flexsim production layout showing main and non-primary production areas in different colors.
Operators work an 8 h shift from 08:00 to 17:00, with a 1 h break. The simulation was run for 366 days, resulting in a total production output of 2440 units. Table 2 presents the analysis results generated by FlexSim for each workstation, using parameters such as the percentage of idle time, processing time, and waiting time for operators. Since all production processes are carried out manually without the assistance of machines, the key indicator used for further analysis is the percentage of time spent waiting for an operator to process the product at a given operation or the average time a work-in-progress product spends in a queue awaiting processing. Based on the simulation results, operation B, particularly workstation B2, showed the largest proportion of waiting for operator processing.
Table 2.
Simulation result of the current model.
When examining the average stay time in the workstation queue, Table 3 indicates that operation B has the highest average time compared to the other operations. Therefore, a scenario was developed to minimize this average queue time.
Table 3.
Average queue time.
The proposed scenario involves assigning the operator with the lowest utilization rate to the operation with the highest average stay time, namely Operation B. Table 4 presents the operator utilization percentages under the current condition, where Operator 4 is identified as having the lowest utilization. Therefore, Operator 4 is also assigned in the proposed model to assist in Operation B.
Table 4.
Operator’s utility of the current model.
The results of the proposed model scenario indicate a 41.57% reduction in the average queue time at Operation B. However, an increase in queue time was observed in several operations handled by Operator 4. Despite this, the overall average queue time across all queues decreased by 29.5%. Figure 3 compares average queue times between the current and proposed models for each workstation queue.
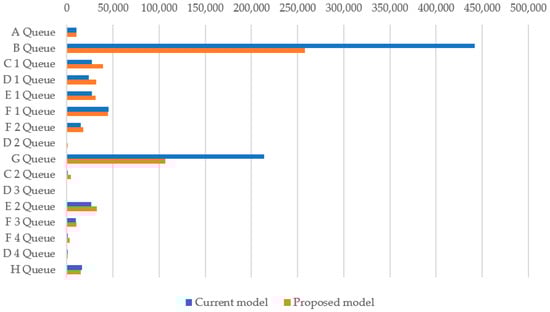
Figure 3.
Comparison of average queue times between the current and proposed models.
Additionally, the proposed scenario contributed to a 31.7% reduction in total production time. Under the current conditions, the production of 2440 units required 366 days, whereas in the proposed model, the same number of units could be completed within 250 days, representing a 31.7% decrease in total production time.
In terms of operator utilization, the average increase was 8.5% (Figure 4). Assigning an operator with lower utilization to assist in operations with high operator waiting times significantly accelerates the production process, enabling the industry to increase its overall production capacity.
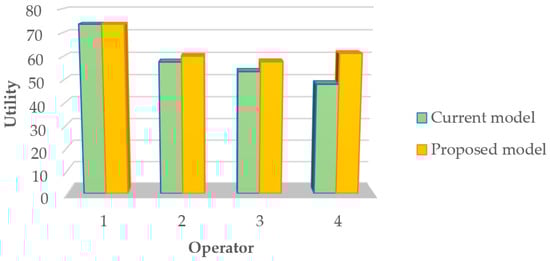
Figure 4.
Comparison of the current and proposed models of operator utilities.
The simulation results from this case-based study demonstrate the potential of production system modeling using FlexSim as a decision-support tool for identifying and addressing inefficiencies in manual production environments. In the studied medium-scale industry, operations are performed entirely manually, and a significant portion of production delays was attributed to operator-related factors, particularly waiting times at certain workstations.
The initial simulation of the current production condition highlighted that Operation B, especially Workstation B2, experienced the highest operator-related delays, both in terms of average queue time and percentage of time spent waiting for operators. These inefficiencies were compounded by the fact that some operators were simultaneously responsible for tasks outside the main production line, thereby affecting their availability and utilization. To mitigate this bottleneck, a scenario was developed that involved reallocating resources, specifically assigning Operator 4, who had the lowest utilization rate, to assist at Operation B. This reallocation reflects a practical, low-cost strategy that does not require structural or technological changes, but rather better workforce coordination.
4. Conclusions
The results of this study demonstrate the effectiveness of simulation-based analysis using FlexSim in identifying and addressing inefficiencies within a manually operated, medium-scale production system. The simulation results revealed that operator-related delays, particularly at Operation B, were the primary bottleneck affecting overall production efficiency. By reallocating an underutilized operator to assist at the most congested workstation, the proposed scenario successfully reduced the average queue time at Operation B by 41.57% and decreased the total average queue time across all operations by 29.5%. This adjustment also led to a significant reduction of 31.7% in total production time, enabling the industry to produce the same output in fewer days.
Additionally, operator utilization improved by an average of 8.5%, indicating a more balanced workload distribution. These findings highlight the potential of resource reallocation strategies to optimize performance without the need for major investments in technology or infrastructure. The study results confirm that discrete-event simulation serves as a valuable decision-support tool, enabling industries to virtually test improvement scenarios, minimize risk, and enhance overall production capacity through informed, data-driven strategies.
Author Contributions
All authors contributed significantly to the completion of this research. S.P.D.K. conceptualized this study, designed the research framework, and led the simulation modeling in FlexSim. V.T. was responsible for data collection, preprocessing, and participated in model scenario analysis. N.E.B. contributed to the literature review, supported the analysis and interpretation of results, and drafted the initial manuscript. R.M.S. provided critical revisions, finalized the discussion and conclusion sections, and ensured the overall coherence and academic quality of this paper. All authors have read and agreed to the published version of the manuscript.
Funding
This research was funded by Atma Jaya Catholic University of Indonesia under the School of Bioscience, Technology, and Innovation (SBTI) Decentralized Research Grant Program, Fiscal Year 2025 (Grant No. 0186/III/LPPM-PM.10.01/03/2025).
Institutional Review Board Statement
Not applicable.
Informed Consent Statement
Not applicable.
Data Availability Statement
The data supporting the findings of this study are available from the corresponding author upon reasonable request. Due to confidentiality agreements with the case study industry, certain datasets may be restricted or anonymized prior to sharing to protect proprietary information.
Acknowledgments
The authors would like to express their sincere gratitude to Atma Jaya Catholic University of Indonesia for the academic support and resources provided throughout this research. Special thanks are also extended to the management of the partner industry involved in this case study for their invaluable cooperation, access to production data, and willingness to participate in the simulation-based analysis. Their contributions were essential to the successful completion of this research.
Conflicts of Interest
The authors declare no conflicts of interest.
References
- Heizer, J.; Render, B.; Munson, C. Operations Management: Sustainability and Supply Chain Management, 13th ed.; Pearson: London, UK, 2020. [Google Scholar]
- Slack, N.; Brandon-Jones, A.; Johnston, R. Operations Management, 8th ed.; Pearson Education: London, UK, 2016. [Google Scholar]
- Kristiana, S.P.D.; Asih, A.M.S.; Sudiarso, A. Designing simulation to improve production efficiency of Batik Industry. Simul. Gaming 2023, 54, 730–759. [Google Scholar] [CrossRef]
- Dudakli, N.; Baykasoglu, A. A Simulation-optimization-based planning and control system for operations of fully automated parking systems. Comput. Ind. Eng. 2024, 189, 109977. [Google Scholar] [CrossRef]
- Banks, J.; Carson, J.S.; Nelson, B.L.; Nicol, D.M. Discrete-Event System Simulation, 5th ed.; Pearson Education: London, UK, 2010. [Google Scholar]
- Law, A.M. Simulation Modeling and Analysis, 5th ed.; Mc-Graw-Hill Education: New York, NY, USA, 2015. [Google Scholar]
- Skoogh, A.; Johansson, B. A methodology for Input Data Management in Discrete Event Simulation Projects. In Proceedings of the 2008 Winter Simulation Conference, Miami, FL, USA, 7–10 December 2008; pp. 1727–1735. [Google Scholar]
- Bechtsis, D.; Tsolakis, N.; Vlachos, D.; Srai, J.S. Intelligent Autonomous Vehicles in digital supply chains: A framework for integrating innovations towards sustainable value networks. J. Clean. Prod. 2018, 181, 60–71. [Google Scholar] [CrossRef]
- Karanjkar, N.; Joshi, S.M. A Phyton-based Mixed Discrete-Continuous Simulation Framework for Digital Twins. arXiv 2022. [Google Scholar] [CrossRef]
- Xie, J.; Jiang, H.; Qin, S.; Zhang, J.; Ding, G. A new description model for enabling more general manufacturing systems representation in digital twin. J. Manuf. Syst. 2024, 72, 475–491. [Google Scholar] [CrossRef]


Disclaimer/Publisher’s Note: The statements, opinions and data contained in all publications are solely those of the individual author(s) and contributor(s) and not of MDPI and/or the editor(s). MDPI and/or the editor(s) disclaim responsibility for any injury to people or property resulting from any ideas, methods, instructions or products referred to in the content. |
© 2026 by the authors. Licensee MDPI, Basel, Switzerland. This article is an open access article distributed under the terms and conditions of the Creative Commons Attribution (CC BY) license.