Abstract
Feeder buses play an important role in supporting the accessibility of high-speed railway stations which leads to the improved efficiency of the transportation system. This paper proposes a new optimization technique for the design of feeder bus routes to the stations. It uses dynamic programming with a pulse algorithm seeking to maximize the number of serviced people considering the distance between the urban areas and high-speed railway station. The proposed algorithm was tested in a hypothetical network to find the optimum solutions and the running time needed. Moreover, the algorithm was applied to a real network as a case study in Aswan city, Egypt. Our results demonstrated significant improvements in the route design accuracy and efficiency. By applying the proposed algorithm, the potential demand values increased from 19.8% to 37.9% with a reasonable decrease in the running time compared to the literature. This research contributes to the advancement of transportation planning strategies by providing valuable insights into the optimization of feeder bus systems. The proposed model contributes to the scientific re-search and practical implementation by promoting a coordinated development of high-speed railway stations and urban areas. This may enhance the Egyptian high-speed railway technology, yielding substantial economic and social benefits.
1. Introduction
The rapid expansion of high-speed railway (HSR) networks in recent years has fundamentally altered regional and intercity travel. However, integrating high-speed train stations into regional urban transportation networks remains a significant challenge, especially in areas with dispersed populations and limited access to efficient first- and last-mile choices. One of the most promising ways to overcome this gap is to establish feeder bus systems, which may provide seamless connectivity between metropolitan areas and HSR stations. Despite continuous promises for growth, Aswan, Egypt, does not yet have a functional HSR station. One is being planned, nevertheless, in the city’s northern region, where there is little access to public transit. This scenario offers a rare chance to plan forward and evaluate a feeder system that would optimize future access to the suggested station. Additionally, it provides a platform for evaluating the methodological methods for feeder bus route planning in a predicted but real-world setting.
This study suggests a novel method to enhance the connection of high-speed train stations with the urban transportation system using the feeder buses system. Existing feeder bus design methods have focused on mathematical models with little attention to real-world networks and have concentrated on evolutionary programming algorithms to optimize the feeder routes (e.g., [1,2,3,4,5,6,7,8,9,10,11,12,13,14,15,16,17]). Moreover, they could not identify the optimal path for medium- or large-size networks but they provided the nearest optimal solution. The objective of this paper is to develop a new methodology for feeder bus design that provides services to more of the population within a set time frame. The transportation network is represented as a directed acyclic graph considering the potential demand and average traveling time values based on the average passenger distance, the population size, and the distance between the corresponding links and the high-speed train station. A priority index that depends on anticipated demand values is employed to enhance the links that are possible feeder route candidates.
This paper suggests utilizing a priority index that incorporates anticipated demand and network characteristics, rather than a potential demand index, to assist the algorithm to perform better and provide the operators with a wider range of options based on the pulse technique. This criterion helps to find the optimum solution for a circular route that might optimize the feeder bus’s flexible benefit. The proposed model is regarded as an NP-hard problem with a constraint longest path problem which reduced to a constraint shortest path problem. The algorithm is tested on a hypothetical small size network and evaluated on a large-scale network. Then, the proposed model is applied to Aswan city, Egypt, with a targeted high-speed train station in the north of the city.
By providing an innovative approach to integrated transport network design, this study aims to create a feeder bus planning model that is scalable, realistic, and effective. This model will help close the gap between theoretical optimization and real-world urban transportation requirements.
The next section reviews the literature on feeder bus design. Section 3 presents the methodology of this paper including the formulation of the feeder bus design model and the solution algorithm. The results of applying the proposed model to hypothetical and real-world case study networks are discussed in Section 4. Finally, Section 5 summarizes the paper and provides the conclusions reached.
2. Literature Review
Many researchers have designed feeder bus routes that play an important role in supporting and enhancing accessibility and leading to the improved efficiency of the high-speed train systems, and they are divided into two groups according to the solution method. The first group uses the metaheuristics approach which has been used in the most previous studies (e.g., [7,8,9,10,11,12,13,14,15,16,17]) using different strategies (e.g., genetic algorithm, particle swarm algorithm, etc.). On the other side, a few studies have used the mathematical approach using exact methods.
By using a genetic algorithm, Ref. [6] proposed an agent-based model for optimizing stations and bus routes to reduce operational costs and passenger walking distance. To reduce the overall journey time for passengers, Ref. [7] proposed an optimization framework for demand-responsive feeder transit systems that optimizes the routing and scheduling of feeder buses. Taplin et al. [8,9] optimized bus stop sites for feeder networks in residential areas to enhance walking access for inhabitants; Ref. [9] presented a modified potential demand model for designing a circular feeder route in network, taking into account the prospective demand for feeder bus services, the distance between road and rail transportation, and the repetition factor of road bus lines. A two-stage answer to the transit network design conundrum has been proposed by [10]. The transit routes are constructed and frequency assignments are made using a genetic algorithm in combination with an initial route set generation procedure. Using openly accessible data of the Nottingham bus system, Ref. [11] presented an approach for maximizing public transportation routes, demonstrating how route optimization, along with mutation operations to increase network efficiency and connection, may lower passenger journey times and operator expenses at the same time. Reference [12] showed considerable gains over current route networks with his hybrid method for zone-to-zone trip time calculation. He also conducted a comparison between node-based and zone-based optimization techniques, demonstrating that the zone-based strategy performs better in terms of shortening the overall route length and creating effective route networks.
On another level, some studies used the particle swarm as a solution to solve the problem, such as [13], who optimized the bus network based on road network features, operating costs, and public transport demand. Moreover, Ref. [14] provided a thorough route planning approach for electric bus transit networks that optimizes the effective transit routes and places charging infrastructure. Muhammad et al. [15] enhanced feeder bus services through a model utilizing particle swarm optimization and genetic algorithm, taking the different costs and passenger satisfaction into consideration. There is another group of studies that use other techniques. In order to reduce costs and enhance passenger service quality, Ref. [16] optimized electric transit networks by concurrently optimizing bus routes, frequencies, and charging station locations using a multi-objective optimization model and a population-based artificial fish swarm algorithm (PAFSA) with a genetic algorithm (GA). In order to optimize the overall demand served over time, Ref. [17] created the multi-armed bandit (MAB) algorithm for route design in transit planning.
Other studies ([18,19,20,21]) used the mathematical approach; Ref. [18] presented a neural network-based embedding technology that optimizes feeder bus route planning based on taxi movement patterns. In order to solve the design problem, Ref. [19] offered mathematical programming formulations and models for bus network design, pedestrian infrastructure, bus line planning, and stop positions. Using mathematical models to reconsider bus routes while taking into account current metro lines, Ref. [20] examined how to optimize bus transit networks in metropolitan regions to maximize the passengers’ direct travel and minimize transfers. In order to reduce passenger travel time and the negative effects of lane reservations, Ref. [21] proposed a bi-objective decision model and approach for optimizing bus route design and lane reservation. According to [22], the objective function can be divided into two categories: those that are aimed at reducing the operator’s costs, and those that are aimed at enhancing user service ([8,14,17,18,20]). The objective for the operator is to maximize income, which is mostly dependent on optimizing the size of the demand, or to minimize network lengths and infrastructure expenses. Achieving the shortest network trip time is the targeted user’s perspective and some studies combined both aspects (e.g., [6,9,10,11,12,13,15,16,19]). Table 1 summarizes the main contributions of the previous studies compared to this paper.

Table 1.
Summary of previous studies.
In summary, many existing publications have attempted to improve bus route designs; however, they have mostly focused on theoretical models and have provided little thought to actual road networks and study regions. To optimize the feeder routes, they concentrated on evolutionary programming algorithm techniques such as genetic algorithms, particle swarm algorithms, intelligent heuristic algorithms, and depth first algorithms. The existing models can solve a network effectively and reliably, but they cannot identify the optimal path for medium or large networks. Instead, they provided the nearest optimal solution. A few studies have proposed a mathematical approach using exact methods which performed better than heuristics in optimality and deterministic solution but most of them followed the same route in both directions, leading them to serve few users, and most of them did not take the real case study into consideration. Regarding the objective function classification, only heuristics studies combined both operator and user aspects. On the other hand, exact methods take both costs in numerical examples only and do not apply them to real networks.
This paper offers a precise approach for combining the user and operator objective functions based on the pulse technique that has been presented in [23]. It finds the optimum solution and its alternate solutions for a circular route that might optimize the feeder bus’s flexible benefit. The proposed model is an expansion of a feeder bus service route design model that employed projected demand values to optimize the issue [24]. The circular route priority index should be maximized under the network restriction of time which reflects the costs. An integer priority index that represents the potential demand values in the currently proposed methodology enhances the model’s effectiveness and its ability to choose any network node and force the feeder bus to pass through it. Additionally, the model visits each node just once if it is not essential (“In this context, the term ‘essential’ pertains to an edge proximal to a critical node”). Disregarding such edges impedes path completion, leading to the cessation and partitioning of the interconnected network into two distinct entities, allowing the transportation system to serve more people and cover a larger region.
3. Materials and Methods
3.1. Model Construction
The priority index (PI) that depends on anticipated demand values is employed to enhance links that are possible feeder route candidates. This paper presents the transportation network as a graph network (G) with nodes (N) and links (A); each link (i, j) has two main values: potential demand and average traveling time. According to [9,25], the average passenger distance, the distance between the corresponding link and the high-speed train station, and the population size have an impact on the possible demand value. Moreover, they have an inverse relationship with average passenger distance and a direct relationship with population size and distance between link and train station. So, potential demand (PD) can be calculated as follows.
where
- is the potential demand of corresponding link (, ).
- is the population size of link (, ).
- , is the average distance of passenger to link (, ).is the distance between the midpoint of the link (, j) and the targeted station.
In order to calculate , the serviced inhabited zone is determined and the population density is calculated. Then, the determined zone is divided into grids and the population size for each grid is obtained using the population density.
where
- is the total population size of the grid.
- is the population density (person/m2).
- is the zone area (m2).
- is the grid area.
Then, the logit model is applied to assign each grid to a specific single link based on the following assumptions [24].
- Passengers in one grid are assigned to one link.
- Individuals in the same grid have similar travel characteristics.
- The distance between passengers inside a given grid and the relevant link is the shortest distance between the midpoint of each grid and that link.whereis the probability of grid ().is the average distance of passenger to link ().
After calculating the probability according to (4), each grid is assigned to a unique link and the corresponding population size can be calculated as follows:
where
- = 1 if grid () is assigned to link () and vice versa.
After this calculation, the graph with average travel time and potential demand for each link is constructed. To solve this model, the priority index (PI) for each link is solved with the following equations:
where
- is the potential demand index.
- is the potential demand arrangement array.
- is the proposed priority index for demand.
- is the potential demand index order.
The final model that has to be solved is as follows:
- is the proposed priority index for demand.
- = 1 if the link () belongs to the route, and = 0 if it does not.
- is the traveling time for the link ().
- is the maximum trip time.
The total served area by the resulting path (SAP) could be calculated as follows.
where
- is the area of the grid which is assigned to the link (A).
- is equal to 1 if the path (P) contains the link (A) and is equal to zero in other cases.
The developed network is mirrored to provide a circular path, and each node except the station node is linked to its conjugated node through a virtual connection that has a zero value for each priority index and associated time as shown in Figure 1 and the generated route from the station point to its conjugated point is considered as a circular route.
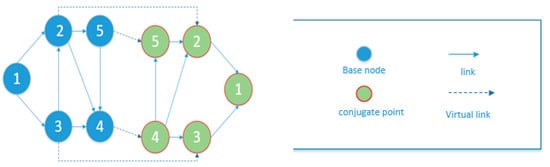
Figure 1.
Mirrored network to provide a circular path.
When turning a road network into a graph, one of the possible challenges that often arises is that the network is complex, which implies that there are multiple edges connecting any two nodes. The algorithm requires that there be at least one edge connecting each pair of nodes, and this problem can be solved by adding a node connecting any node of the two nodes with a virtual link, as shown in Figure 2, and this appears in nodes 30, 31, and 40 of the studied network.
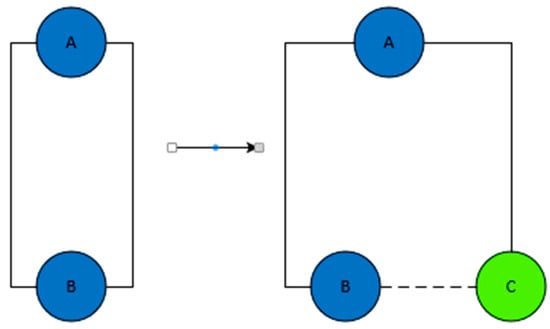
Figure 2.
Adding a node connecting the two nodes with virtual link.
3.2. Solution Algorithm
The suggested paradigm for developing feeder routes is regarded as an NP-hard problem. It is a constraint longest path problem (CLPP) that can be reduced to a constraint shortest path problem (CSPP) [26]. The developed graph in this paper was constructed as a directed acyclic graph (DAG) since there are no cycles in the graph. Therefore, the longest path we are aiming for in the DAG has the shortest path with negative weights. Based on the pulse technique [23], one model (Algorithm B) addresses the issue by considering visiting each link just once, while another model (Algorithm A), inspired by the existing literature, visits any node and connection without any restrictions. The method generates the closest optimum solution before further improving it to produce the ideal solution as shown in Figure 3.
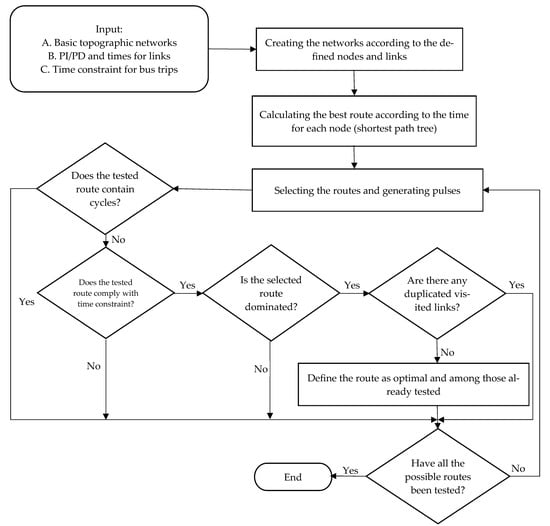
Figure 3.
Optimization flow chart.
- Steps:
- Step 1 inputs are as follows:
- Building the (O–D) matrix with size (2 × number of links) for the road matrix and determining the start and link nodes.
- Determine the time array of the network with the size (number of links × 1).
- Determine the demand array with the same size of time array.
- Define the maximum travel time (T) of one trip.
- Defining the inhabited area boundary.
- Step 2 calculations are as follows:
- Determining the shortest path between the last node and each node with respect to time.
- Selecting each route between the start node and the last one using pulses.
- Pulses traverse the network from the node to the neighboring nodes building sub-partial paths.
Each path has its cumulative PD and time firstly by adding the path time with the shortest time to the visited node: if it is larger than the constraint time, this path is ended early; if not, the path building continues until it reaches the end node and it stores this solution as the optimum solution. Then, this cycle continues until it reaches the end node and is compared with other solutions.
4. Results and Discussion
The method is solved using MATLAB software version R2024a on a computer with an Intel Core i3-3217–U processor running at 1.80 GHz and 8 GB of RAM. The proposed model is verified by applying it to a hypothetical network and to a case study network.
4.1. Experimental Results, and Case Study
4.1.1. Model Verification of a Hypothetical Network
The algorithm is applied to the network shown in Figure 4 (small size network) which has been used in [25]. Each edge in Figure 4 has two values, the left is the traveling time and the right is the demand indicator, and the time constraint is 25 min for traveling from node 1 and returning again for it to achieve the maximum possible demand, finally obtaining the resulting route which is formatted in the dotted line with the total time of 20 min; this result matches with the results reached in [25].
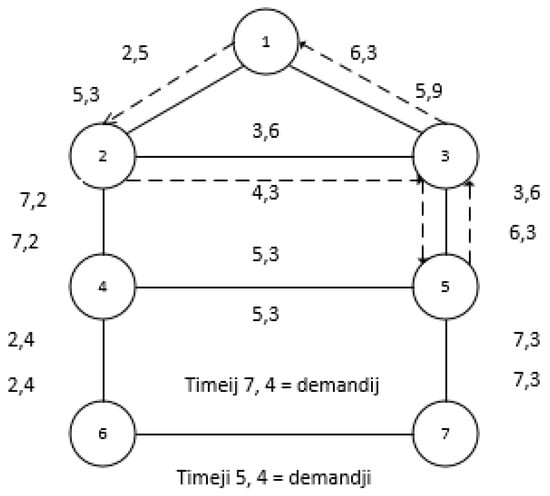
Figure 4.
Hypothetical network [25] with optimal solution (dotted line).
4.1.2. Case Study
The proposed model is applied to the Aswan city network with a targeted high-speed train station in the north of the city; the city has an inhabited area of 44.2 km2 with a population of 391,434 people and the road network consists of 52 links and 38 nodes. The converted graph consists of 41 nodes and 54 edges (with two virtual links to avoid complexity) and the model is performed with the time constraint of 75 min. The resulting routes are illustrated in Figure 5, Figure 6, Figure 7 and Figure 8. This paper compared the performance of two algorithms, the proposed model (Algorithm B), and the model used in the existing literature (Algorithm A), using the values of the PD and the PI to compare their effectiveness in terms of the percentages of served areas. So, the target is to find the algorithm that offers a larger serviced area. Table 2 presents the optimal paths reached.
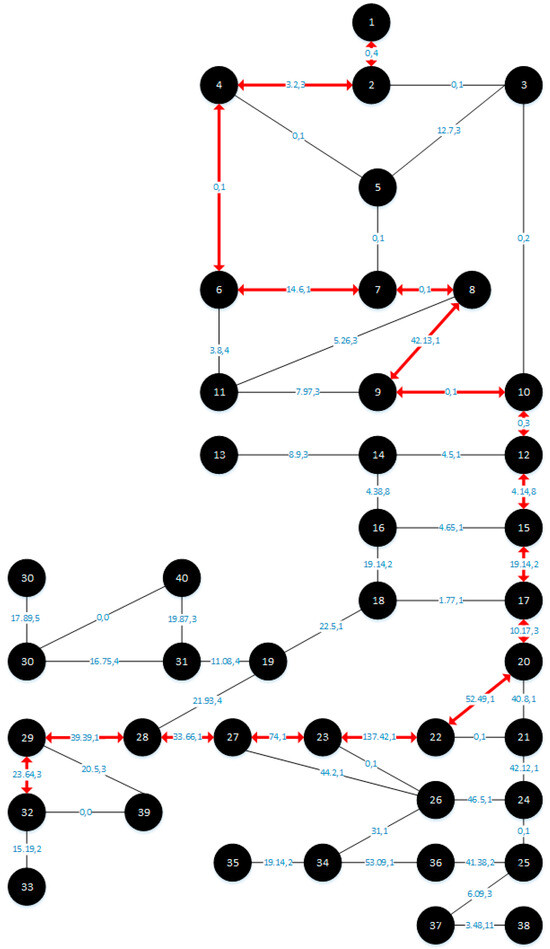
Figure 5.
Aswan network and bus routes using PD and Algorithm A.
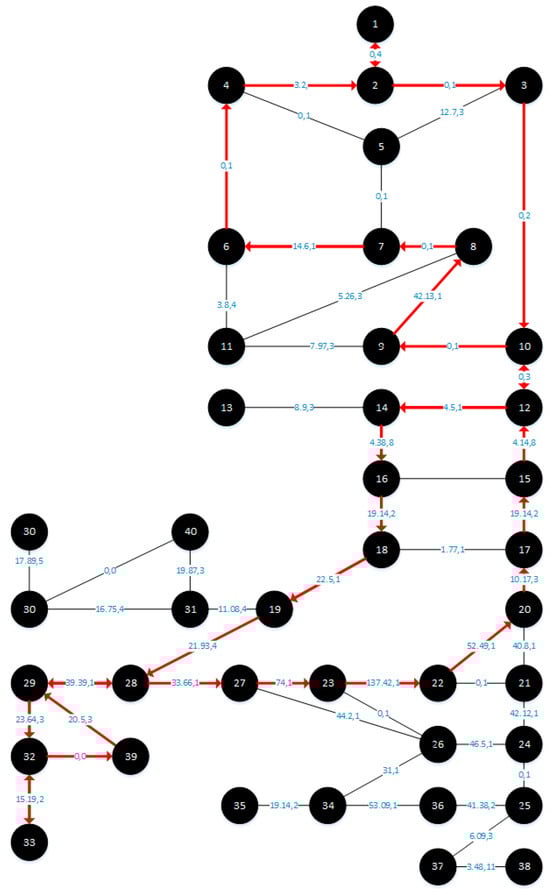
Figure 6.
Aswan network and bus routes using PD for Algorithm B.
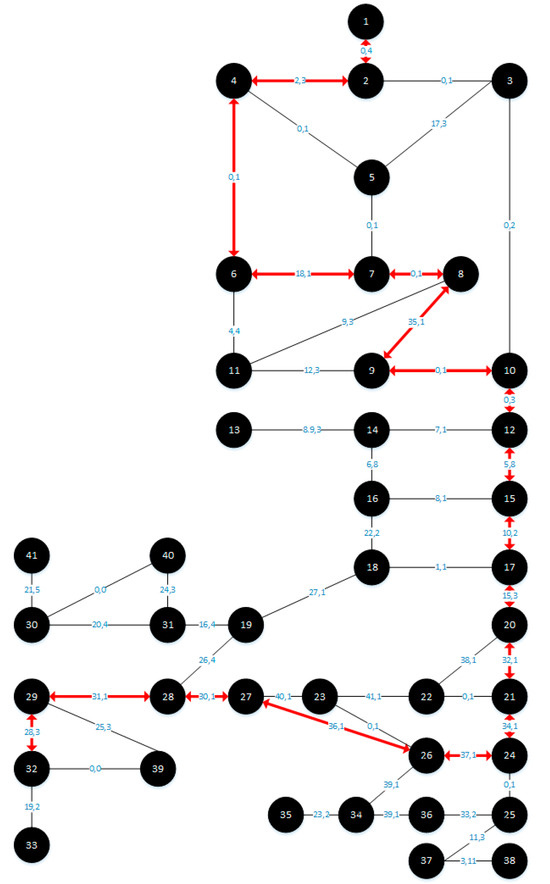
Figure 7.
Aswan network and bus routes using PI for Algorithm A.
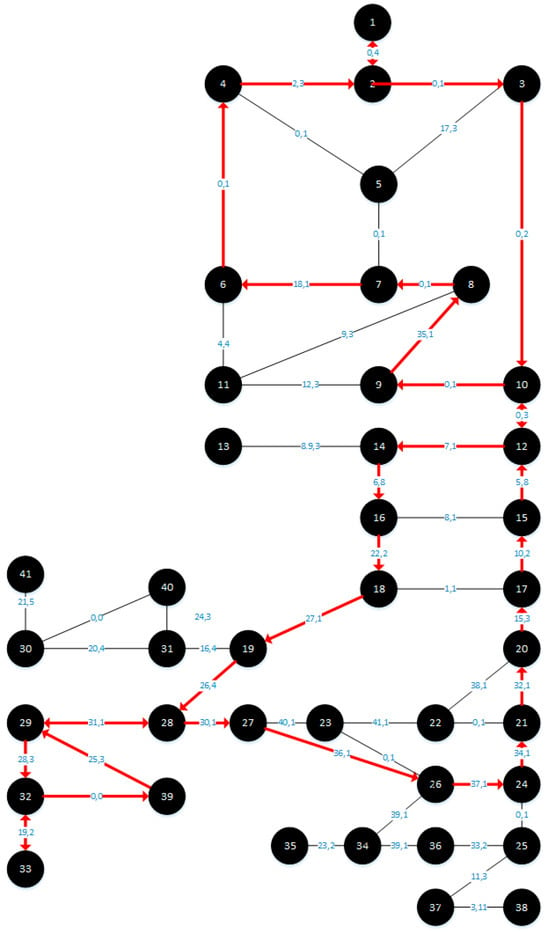
Figure 8.
Aswan network and bus routes using PI for Algorithm B.
Table 2.
Resulting paths.
4.2. Results Discussion
Table 3 shows that Algorithm B considerably outperformed Algorithm A with a served area of 37.7%, according to the algorithms’ performance with PD values. This shows that Algorithm B offers a 90% increase in served area over Algorithm A when using PD values, indicating a significant improvement in the performance. Furthermore, when employing PI values as indicated in the table, Algorithm B’s performance with PI results in a 75% increase in serviced area over Algorithm A. This is because, in contrast to the traditional technique, it maximizes the trip’s potential demand value even if the same edge is taken twice. To the greatest extent possible, our method aims to fulfill the trip constraints while serving every edge.
Table 3.
Summary of the results.
In addition to performing better than Algorithm A in terms of both PD and PI values, Algorithm B also demonstrated stable performance with little fluctuation in the two metrics (37.7% for PD and 37.9% for PI). Conversely, Algorithm A displayed a greater degree of fluctuation (19.8% with PD and 21.62% with PI), which suggests a lower level of consistency and dependability across all performance indicators.
Larger coverage is more effectively achieved by Algorithm B, which might be important for transit applications. Additionally, Algorithm B exhibits robust and consistent behavior across a wide range of parameters, making it a more dependable option for deployment in a variety of circumstances.
The proposed methodology concentrates on time as a number, to be clear. It makes sense that there would be variations in the time it takes to solve given the number of reasons (such as system load, caching, memory management, etc.) that contribute to this variation.
The consistency and resilience of the proposed methodology stem from its use of pulses to execute several solutions and pathways in a network. This avoids complicated or overlapping data, which in turn contributes to algorithm stability.
Based on these results, it is clear that the preference for using PI was better than PD because it consists of integers and is free of decimal fractions, which led primarily to reducing the time taken to solve because integers are simpler than decimal numbers in arithmetic operations, as they do not require additional operations for adjusting the exponent and correcting errors like decimal numbers. Decimal numbers need a large space in memory, and when comparing the result in terms of the served space, it is found that the difference is not large, because decimal numbers are rounded, which does not emphasize the difference between the edges. Meanwhile, the use of the priority and ranking method emphasized the difference between the edges. Some previous studies in optimization operations multiplied the numbers by a relatively large factor to remove the fractions to show the difference, but this makes the numbers larger. Using small numbers in our methodology increased the speed of the arithmetic operations involving fewer digits because the memory and processing operations required less handling. Additionally, the principle of not repeating edges was the main and basic reason for maximizing the served area in this paper. The calculated PD value for the resulting path in the existing model (Algorithm A) was greater than our model (Algorithm B). While Algorithm A calculated the PD value for the same edge in the two directions, Algorithm B scored the highest serviced area, due to the edge repetition elimination technique proposed in this paper. This issue was not considered in the existing literature as they focused on numerical values regardless of the distribution of services and the fairness of the distribution of opportunities. So, the calculation methodology proposed in this paper increases the possibility of equal distribution of opportunities.
The proposed strategy not only increases the coverage and consistency but also advances important objectives in environmental sustainability, economic efficiency, and social equality. Algorithm B supports goals to develop equitable and inclusive transportation networks by expanding the serviced area and offering reliable service, hence facilitating more equal access to necessary services for marginalized populations. In addition to improving resource allocation and reducing operating costs, the algorithm’s efficiency reduced unnecessary trips (individual trips by unserved people to high-speed rail stations) which in turn reduces emissions and energy use. This double advantage supports cost and environmental sustainability, which are critical for cities dealing with pollution and climate change. Furthermore, the algorithm’s scalable design facilitates future growth and flexibility to shift urban demands. It is a dependable and flexible design that improves user happiness and helps to cultivate a faithful passenger base.
Those effects show how Algorithm B provides a comprehensive solution that addresses a range of objectives in social, economic, and environmental domains, hence enhancing the resilience and sustainability of the transportation system. Additionally, Algorithm B’s integration with high-speed train stations may improve disaster preparedness, public health, and sustainable urban growth. Reliable high-speed rail links may enhance healthcare accessibility, decrease dependency on private automobiles, and encourage active transportation leading to better air quality and healthier lifestyles. Furthermore, Algorithm B’s adaptability to different circumstances makes it useful for emergency transportation planning, guaranteeing that the high-speed rail will continue to operate during emergencies. The algorithm supports local businesses by promoting improved links to high-speed train stations, which in turn helps to revitalize and boost the economy of the communities surrounding these transportation hubs. This strategy guarantees that high-speed rail lines are a component of a transportation network that is egalitarian, ecologically responsible, and flexible, in line with the sustainable development goals.
5. Conclusions
This research studied an urban road network, which is transformed from a topographic network to a graph (nodes and links) with the demand indicators and the time as the edge weights. It uses an optimization technique to connect the high-speed train station with the urban network with an optimized circular road starting and ending at the rail station.
In order to fill a gap in the public transportation system, this study offered a novel method for developing feeder routes based on the pulse methodology, providing services to as many citizens as feasible within a set time frame. This paper suggested using a priority index rather than a potential demand index to help the algorithm to perform better and provide the operators with a wider range of options.
Aswan city was used as a case study due to an observed gap in the public transportation services. After running the model in the different cases obviously using the priority index, the results indicate two main conclusions: firstly, applying the prior technique’s priority index to the visited nodes with Algorithm A increased the serviced area from 19.8% to 21.62% and decreased the time from 3.16 s to 2.7 s; secondly, applying the new Algorithm B with the potential demand values increased the serviced area from 19.8% to 37.7%; and finally, the optimal result for both the area and running time was obtained with Algorithm B with PI. This model will help at both the realistic level and the scientific research level. For future work, a wide data range should be collected and more factors should be considered for the proposed algorithm, such as the characteristics of individuals and the income levels of citizens.
Author Contributions
Conceptualization, S.H., M.R. and A.A.; methodology, M.R., S.H. and A.O.; software, S.H. and M.R.; validation, S.H. and A.O.; analysis, S.H., M.R. and A.A.; data curation, M.R. and S.H.; writing—original draft preparation, S.H., M.R. and A.A.; writing—review and editing, A.O. and S.H. All authors have read and agreed to the published version of the manuscript.
Funding
This research received no external funding.
Institutional Review Board Statement
Not applicable.
Informed Consent Statement
Not applicable.
Data Availability Statement
Data available upon request.
Acknowledgments
Seham Hemdan’s postdoctoral scholarship is fully funded by the Ministry of Higher Education of The Arab Republic of Egypt through the “Egypt-Japan Education Partnership” program.
Conflicts of Interest
The authors declare no conflicts of interest.
References
- Jiang, X.; Zhang, L.; Chen, M.X. Short-term forecasting of high-speed rail demand: A hybrid approach combining ensemble empirical mode decomposition and gray support vector machine with real-world applications in China. Transp. Res. Part C Emerg. Technol. 2014, 44, 110–127. [Google Scholar] [CrossRef]
- UIC. High-Speed Around the World Historical, Geographical, and Technological Development; UIC: Chicago, IL, USA, 2023. [Google Scholar]
- Belal, E.M.; Khalil, A.A.; El-Dash, K.M. Economic investigation for building a high-speed rail in developing countries: The case of Egypt. Ain Shams Eng. J. 2020, 11, 1001–1011. [Google Scholar] [CrossRef]
- Venezia, E. Cost–Benefit Analysis in High-Speed Railway Projects: Appraisal of Methodological Approaches and an Initial Social Equity Evaluation, A Case Study. Sustainability 2023, 15, 11344. [Google Scholar] [CrossRef]
- Moyano, A.; Moya-Gómez, B.; Gutiérrez, J. Access and egress times to high-speed rail stations: A spatiotemporal accessibility analysis. J. Transp. Geogr. 2018, 73, 84–93. [Google Scholar] [CrossRef]
- Li, X.; Wei, M.; Hu, J.; Yuan, Y.; Jiang, H. An Agent-Based Model for Dispatching Real-Time Demand-Responsive Feeder Bus. Math. Probl. Eng. 2018, 2018, 6925764. [Google Scholar] [CrossRef]
- Sun, B.; Wei, M.; Yang, C.; Xu, Z.; Wang, H. Personalised and coordinated demand-responsive feeder transit service design: A genetic algorithms approach. Future Internet 2018, 10, 61. [Google Scholar] [CrossRef]
- Taplin, J.H.E.; Sun, Y. Optimizing bus stop locations for walking access: Stops-first design of a feeder route to enhance a residential plan. Environ. Plan B Urban. Anal. City Sci. 2020, 47, 1237–1259. [Google Scholar] [CrossRef]
- Sani, S.; Ghatee, M. A potential demand model for a multi-circulation feeder network design. arXiv 2022, arXiv:2205.04537. [Google Scholar]
- Jha, S.B.; Jha, J.K.; Tiwari, M.K. A multi-objective meta-heuristic approach for transit network design and frequency setting problem in a bus transit system. Comput. Ind. Eng. 2019, 130, 166–186. [Google Scholar] [CrossRef]
- Soares, P.H.; Mumford, C.L.; Amponsah, K.; Mao, Y. An adaptive scaled network for public transport route optimisation. Public Transp. 2019, 11, 379–412. [Google Scholar] [CrossRef]
- Soares, P.H. Zone-based public transport route optimisation in an urban network. Public Transp. 2021, 13, 197–231. [Google Scholar] [CrossRef]
- Cipriani, E.; Fusco, G.; Patella, S.M.; Petrelli, M. A particle swarm optimization algorithm for the solution of the transit network design problem. Smart Cities 2020, 3, 541–555. [Google Scholar] [CrossRef]
- Yao, B.; Hu, P.; Lu, X.; Gao, J.; Zhang, M. Transit network design based on travel time reliability. Transp. Res. Part C Emerg. Technol. 2014, 43, 233–248. [Google Scholar] [CrossRef]
- Almasi, M.H.; Mounes, S.M.; Karim, M.R. Validating an Improved Model for Feeder Bus Network Design Using Genetic Algorithm (GA) and Particle Swarm Optimization (PSO). J. East. Asia Soc. Transp. Stud. 2015, 11, 507–522. [Google Scholar]
- Liu, Y.; Feng, X.; Yang, Y.; Ruan, Z.; Zhang, L.; Li, K. Solving urban electric transit network problem by integrating Pareto artificial fish swarm algorithm and genetic algorithm. J. Intell. Transp. Syst. Technol. Plan. Oper. 2022, 26, 253–268. [Google Scholar] [CrossRef]
- Yoon, G.; Chow, J.Y.J. Contextual Bandit-Based Sequential Transit Route Design under Demand Uncertainty. Transp. Res. Rec. 2020, 2674, 613–625. [Google Scholar] [CrossRef]
- Park, C.; Lee, J.; Sohn, S.Y. Recommendation of feeder bus routes using neural network embedding-based optimization. Transp. Res. Part A Policy Pract. 2019, 126, 329–341. [Google Scholar] [CrossRef]
- De-Los-Santos, A.; Canca, D.; Barrena, E. Mathematical formulations for the bimodal bus-pedestrian social welfare network design problem. Transp. Res. Part B Methodol. 2021, 145, 302–323. [Google Scholar] [CrossRef]
- Suman, H.K.; Bolia, N.B. Improvement in direct bus services through route planning. Transp. Policy 2019, 81, 263–274. [Google Scholar] [CrossRef]
- Wu, P.; Xu, L.; Che, A.; Chu, F. A bi-objective decision model and method for the integrated optimization of bus line planning and lane reservation. J. Comb. Optim. 2022, 43, 1298–1327. [Google Scholar] [CrossRef]
- Durán-Micco, J.; Vansteenwegen, P. A survey on the transit network design and frequency setting problem. Public Transp. 2022, 14, 155–190. [Google Scholar] [CrossRef]
- Lozano, L.; Medaglia, A.L. On an exact method for the constrained shortest path problem. Comput. Oper. Res. 2013, 40, 378–384. [Google Scholar] [CrossRef]
- Zhu, Z.; Guo, X.; Zeng, J.; Zhang, S. Route Design Model of Feeder Bus Service for Urban Rail Transit Stations. Math. Probl. Eng. 2017, 2017, 1090457. [Google Scholar] [CrossRef]
- Ceder, A. Public Transit Planning and Operation: Theory, Modeling and Practice; CRC Press, Taylor & Francis Group: Boca Raton, FL, USA, 2016; pp. 480–520. [Google Scholar]
- Pham, Q.D.; Deville, Y. Solving the Longest Simple Path Problem with Constraint-Based Techniques. In International Conference on Integration of Artificial Intelligence (AI) and Operations Research (OR) Techniques in Constraint Programming; Springer: Berlin/Heidelberg, Germany, 2012. [Google Scholar]
Disclaimer/Publisher’s Note: The statements, opinions and data contained in all publications are solely those of the individual author(s) and contributor(s) and not of MDPI and/or the editor(s). MDPI and/or the editor(s) disclaim responsibility for any injury to people or property resulting from any ideas, methods, instructions or products referred to in the content. |
© 2026 by the authors. Licensee MDPI, Basel, Switzerland. This article is an open access article distributed under the terms and conditions of the Creative Commons Attribution (CC BY) license.