Abstract
Technological advancements have improved energy efficiency and increased energy requirements requiring improved energy density solutions to optimally utilize the existing landscape. The renewable energy density of urban rooftops can be increased by introducing micro wind farms consisting of vertical axis wind turbines (VAWT). VAWTs do not require directed flow thus a feasible choice. In this paper, the preliminary study for parametric design of horizontal distance between two identical Savonius wind turbines is presented. Three different simulations were performed to reveal important insights about this problem with an inlet velocity of 2 m/s. The results suggest 3D analysis for accurate insights.
1. Introduction
Fossil fuels-based lifecycle has led to serious environmental issues [1]. The severe climate impact has pushed us to find renewable resources of energy. The transition towards renewable sources of energy should be made in a smooth fashion and now is the time to act upon it. Due to improper utilization of energy resources, Pakistan has been facing an average shortfall of 5 GW with 64% of the energy mix coming from fossil fuel-based thermal power plants [2,3]. However, there is an active transition for wind energy and wind power going on especially for the countries of Europe [4]. The global wind power capacity has reached 760 GW in 2020 [5]. The smooth transition may be made possible by installing wind turbines on urban rooftops.
Wind energy being an important renewable energy requires wind turbines to capture wind energy to produce power. The wind turbines can be categorized into horizontal axis and vertical axis turbines. These devices are used to convert kinetic energy into mechanical energy. In this work, the vertical axis turbine (VAWT) is used due to its omnidirectional capability at low wind speeds [6]. A drag-driven VAWT considered in this study is a two bucket Savonius wind turbine.
In this work, computational fluid dynamics (CFD) has been used to study the aerodynamic changes in the wind flow caused by a building. The turbine is analyzed in both single and double configurations separate from the building case. The dimensions of the wind turbine are shown in Figure 1. The physical properties of the turbine are shown in Figure 1. The building configuration is shown in Figure 2. The boundary layer formed on the top of the building is analyzed. The velocity profiles of the turbine were measured to account for the time required for the flow development.
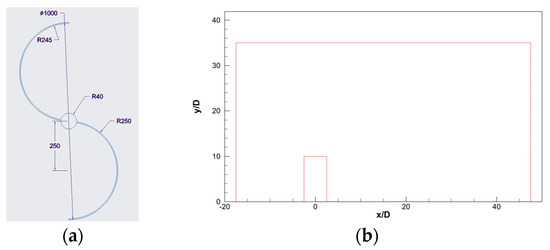
Figure 1.
(a) Geometry of two bucket Savonius Turbine; (b) Computational domain for building.
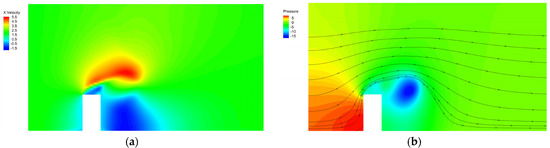
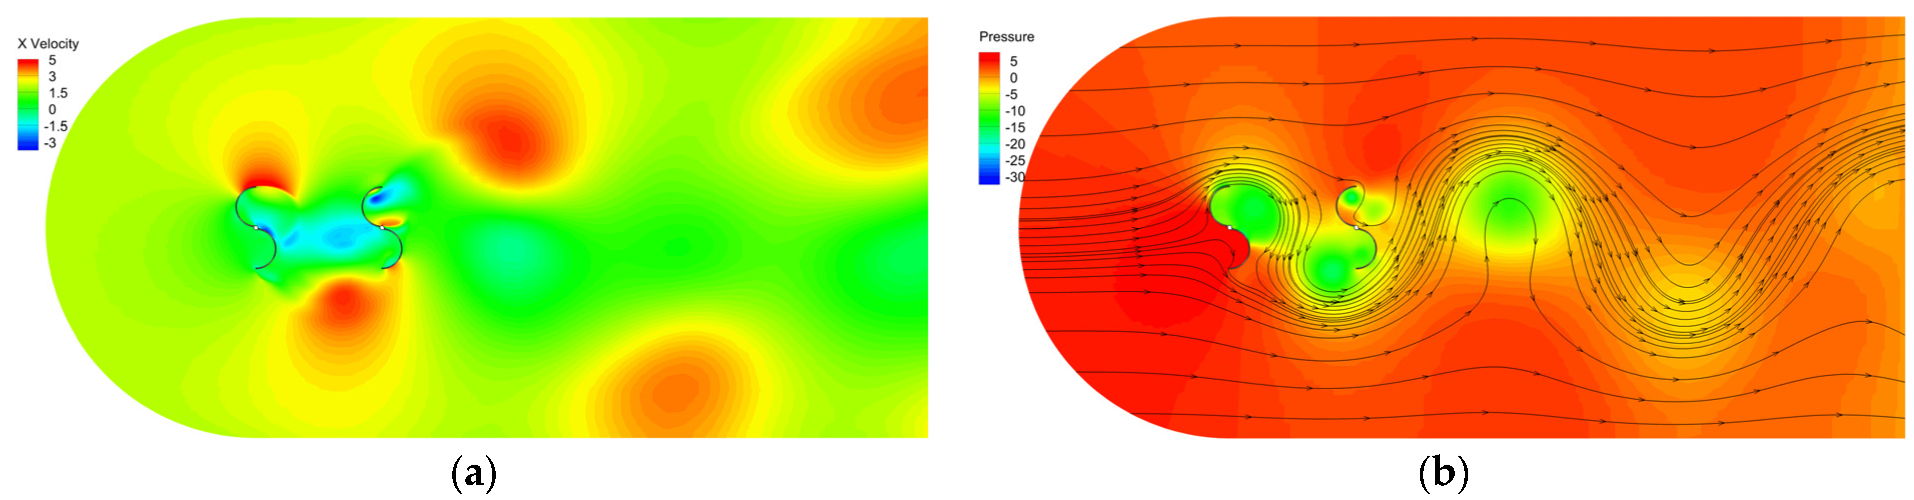
Figure 2.
Building analysis (a) Velocity contours; (b) Pressure contours.
2. Methods
The kinetic power that flows into wind turbine can be calculated as follows:
where ρ is air density (kg/m3), A is rotational area and v is wind speed (m/s)
P = ½ρ A v3
In the free-stream, the SST formulation moves to a k-ε behavior, avoiding the usual k-problem of the model being too responsive to the inlet free-stream turbulence properties. Therefore, the SST k-ω model is selected [7].
CFD Simulation Parameters
The simulation program used for the study is ANSYS® Fluent [8], the parameters for simulations are shown in Table 1.

Table 1.
Numerical values of simulation parameters.
3. Results and Discussion
In this section, results from three transient simulations are presented and discussed. One result is from the building analysis and two are from the wind turbine analysis.
3.1. Building Analysis
3.1.1. Results
The transient simulation of the building was performed to investigate the wind flow behavior on the rooftop. The results are presented in Figure 2.
3.1.2. Discussion
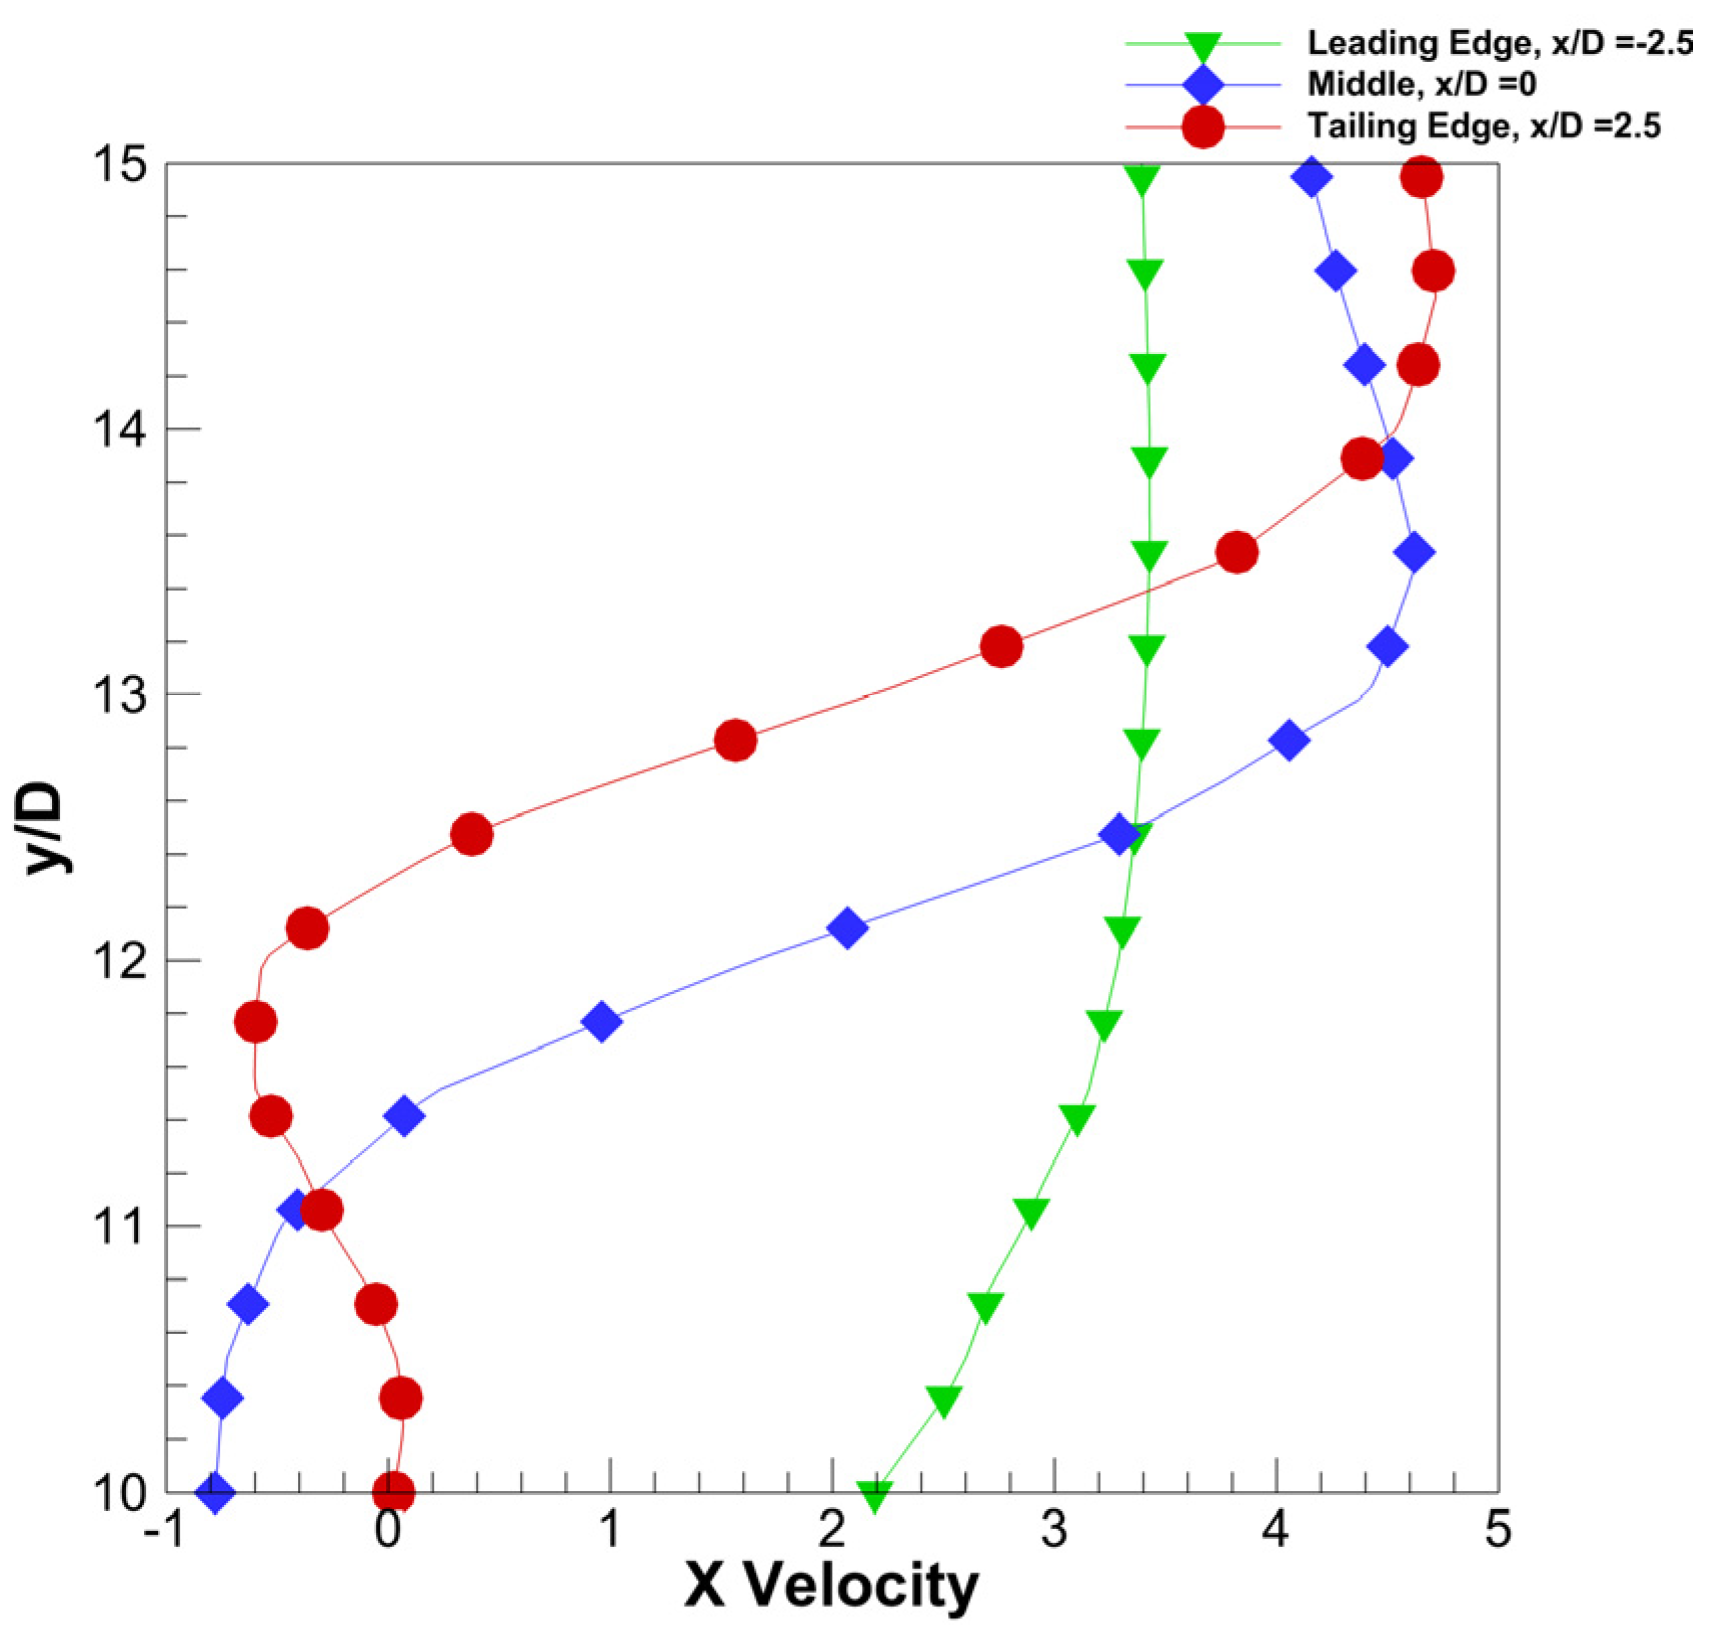
The boundary layers at different values of x/D are presented in Figure 3. The boundary layers support that the wind turbine should be placed near the leading edge.
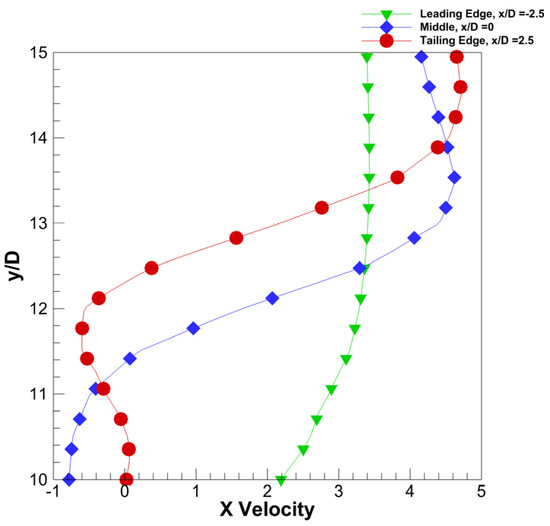
Figure 3.
Boundary layer on the rooftop.
3.2. Single Turbine Analysis
3.2.1. Results
In this section, the analysis of the single turbine is presented. The contours of velocity and pressure are present in Figure 4.
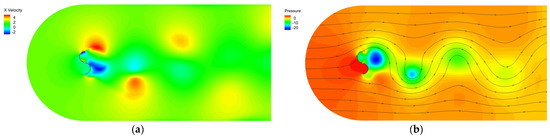
Figure 4.
Single turbine analysis (a) Velocity contours; (b) Pressure contours.
3.2.2. Discussion
The time series plot of the x component of the velocity is presented in Figure 5. The plot shows that time of four second was required for the flow development.
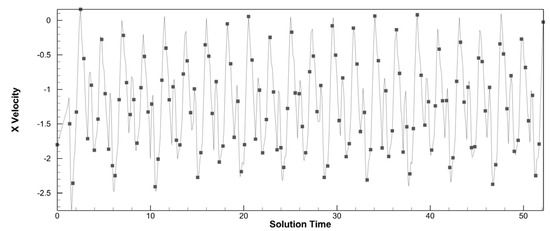
Figure 5.
Time series plot for single turbine.
3.3. Horizontally Distributed Turbines Analysis
3.3.1. Results
In this section, the analysis of the two horizontally distributed turbines is presented. The contours of velocity and pressure are present in Figure 6.

Figure 6.
Horizontally Distributed Turbine Analysis (a) Velocity contours; (b) Pressure contours.
3.3.2. Discussion
The time series plot of the x component of the velocity is presented in Figure 7. The plot shows that a time of 15 s was required for the flow to develop across the first turbine. For the second turbine flow was not developed even after 30 s.
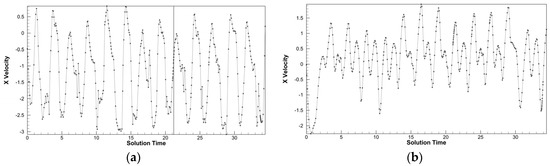
Figure 7.
Horizontally Distributed turbine analysis (a) Velocity behavior behind first turbine from left; (b) Velocity behavior behind second turbine from left.
4. Conclusions and Future Work
The problem of wind turbine placement for urban rooftops has been studied from different perspectives. The turbine should be placed near the edge of the rooftops instead of placing it at the center. The turbine analysis should be performed using dynamic meshing and the simulation time should be more than that required for the flow development. Moreover, the building simulations should be limited to case-specific 3D simulations to model the atmospheric boundary layer and its effects on the VAWT.
Data Availability Statement
The data can be acquired by requesting the correspond author.
Conflicts of Interest
The authors declare no conflict of interest.
References
- Abbasi, K.; Jiao, Z.; Shahbaz, M.; Khan, A. Asymmetric impact of renewable and non-renewable energy on economic growth in Pakistan: New evidence from a nonlinear analysis. Energy Explor. Exploit. 2020, 38, 1946–1967. [Google Scholar] [CrossRef]
- Ali, A.; Irshad, K.; Memon, A.H.; Arif, S.H. Integrating Pakistan’s electricity demand with demographic and energy indicators: Analysis and forecast. In Proceedings of the 2019 15th International Conference on Emerging Technologies (ICET), Peshawar, Pakistan, 2–3 December 2019; Available online: https://ieeexplore.ieee.org/abstract/document/8994416 (accessed on 25 September 2021).
- Javed, M.S.; Raza, R.; Hassan, I.; Saeed, R.; Shaheen, N.; Iqbal, J.; Shaukat, S.F. The energy crisis in Pakistan: A possible solution via biomass-based waste. J. Renew. Sustain. Energy 2016, 8, 043102. [Google Scholar] [CrossRef]
- Hatziargyriou, N.; Zervos, A. Wind Power Development in Europe. Proc. IEEE 2001, 89, 1765–1782. [Google Scholar] [CrossRef]
- Vairagi, B.D.; Tandon, A.; Dewra, R.S. Performance Analysis of DFIG Based Standalone 2.2 kW Laboratory Prototype Wind Turbine Emulator. J. Sci. Approach 2017, 1, 16–21. [Google Scholar] [CrossRef]
- Akkarachaiphant, T.; Chatthong, B.; Tirawanichakul, Y. Preliminary design and testing of VAWT blade for low wind speed using CFD. J. Phys. Conf. Ser. 2019, 1380, 12130. [Google Scholar] [CrossRef]
- SST K-Omega Model—CFD-Wiki, the Free CFD Reference. Available online: https://www.cfd-online.com/Wiki/SST_k-omega_model (accessed on 23 August 2021).
- Ansys Fluent—Fluid Simulation Software. Available online: https://www.ansys.com/products/fluids/ansys-fluent (accessed on 23 August 2021).


Publisher’s Note: MDPI stays neutral with regard to jurisdictional claims in published maps and institutional affiliations. |
© 2021 by the authors. Licensee MDPI, Basel, Switzerland. This article is an open access article distributed under the terms and conditions of the Creative Commons Attribution (CC BY) license (https://creativecommons.org/licenses/by/4.0/).