Abstract
Routine maintenance of commercial aircraft requires reliable detection and repair of corrosion to ensure structural integrity. Post-repair inspections are commonly performed using manual ultrasonic point measurements of residual thickness, a process that is time-intensive and constrained by limitations in accuracy, repeatability, and cost. This study reports initial results of a non-contact, ultrasonic Lamb-wave-based inspection method, implemented with a mobile prototype system. The prototype integrates scanning, data acquisition, and reporting into a mobile workstation to support automated corrosion-repair inspections. Field trials validated the underlying measurement principle, while highlighting challenges when subsurface structures interfere with skin-only thickness evaluation.
1. Introduction
Non-Destructive Testing (NDT) plays a vital role in maintenance, repair, and overhaul (MRO) within aviation, enabling structural assessment without compromising functionality. By detecting cracks, corrosion, and delamination (composites), NDT supports condition-based and preventive maintenance, reducing in-service failures, downtime, and costs, while ensuring compliance with stringent airworthiness standards set by authorities such as the Federal Aviation Administration (FAA) and the European Union Aviation Safety Agency (EASA) [1].
A broad range of NDT techniques addresses the diverse aircraft inspection demands. Conventional methods such as Ultrasonic Testing (UT), Eddy Current Testing (ECT), Radiographic Testing (RT), and Dye Penetrant Inspection (DPI) remain widely used [2], while advanced approaches like infrared thermography and shearography are increasingly applied for composites. For quality assurance, Laser-Doppler vibrometry and water-coupled high-frequency transducers (squirter systems) provide high sensitivity [3], though they are impractical for in-service inspection due to two-sided access, time requirements, and limited scalability [3]. Selection of an NDT method depends on defect type, material, environment, and required sensitivity and resolution, ensuring both reliability and applicability [2].
In manufacturing, NDT is often highly automated through fixed installations that deliver precise, repeatable measurements under controlled conditions. In contrast, MRO inspections are portable but less automated, requiring skilled operators to adapt procedures to complex geometries in variable environments [1]. Flexibility is prioritized over throughput, but anticipated labour shortages increase the urgency to automate and optimize MRO NDT [4]. Greater automation will be critical to maintain quality, reduce human error, and meet growing demand.
Among the most critical MRO tasks is the inspection and repair of corrosion, a pervasive issue that can significantly compromise structural integrity [5]. After corrosion removal and surface treatment, skin thickness must be verified against airworthiness limits, which generally prohibit reductions exceeding 10% of the nominal value [6]. Currently, certified inspectors perform manual pulse-echo ultrasound point measurements [3], producing hand-drawn iso-thickness maps. This process is slow, operator-dependent, and poorly suited to digital maintenance strategies.
This study builds on TNO’s Lamb-wave inspection concept [3,7] and presents results of a prototype system tested in an MRO environment for residual thickness evaluation of repaired corrosion spots. The goal is to assess the accuracy and robustness of the Direct Velocity Mapping (DVM) method against allowable detection limits, thereby reducing reliance on specialized expertise and streamlining corrosion-repair protocols through automated analysis and reporting.
2. Materials and Methods
The measurement principle of DVM is based on generating and detecting Lamb waves. An ultrasonic actuator excites acoustic waves in the sample. The Lamb waves travel through the sample, at a velocity depending on sample thickness, and radiate an ultrasonic field in the air above. This ultrasonic field is measured by scanning a plane above the sample with a microphone array. Using this ultrasonic data, algorithms calculate the velocity of the Lamb waves, which is then converted into a thickness map of the sample [3]. The inspection system comprises a structural frame holding the sensor head, which integrates a MEMS microphone array for detection, three laser-line sensors, and a digital camera that captures the inspected area to aid logging and result interpretation.
2.1. Experimental Setup
The ultrasonic setup employs a piezoelectric actuator attached to the test specimen via a vacuum-activated rubber sleeve operating at ~35 kPa. The actuator introduces low-frequency ultrasonic waves and must be positioned within 50 cm of the defect under inspection. For multiple panels, one actuator per panel ensures effective wave transmission. Signal generation is handled by a waveform generator (DC–120 MHz) (Keysight 33631A, Penang, Malaysia) and a power amplifier (DC–1 MHz) (Krohn-Hite 7500, Brockton, MA, USA). A 2-ms linear frequency sweep with a range of frequencies spanning 20-250 kHz at a 200 V peak-to-peak amplitude was used to excite the actuator [3]. The MEMS array consists of 128 omnidirectional ultrasonic elements with 3 mm spacing between them.
The sensor head is mounted on a four-legged rectangular metal frame and is placed on top of the surface that is to be inspected. The frame houses a 2D translational system that allows the sensor head to move over the region of interest, two thermocouples, three Micro-Epsilon (Ortenburg, Germany) LLT3000 laser profilers to determine the position of the measured surface with respect to the MEMS array and a Daheng Imaging (Beijing, China) Mercury 2 camera. To facilitate the co-registration of the thickness map and optical data, ArUco markers are placed on the surface prior to the start of the inspection process. At the locations of the ArUco markers, acoustic energy must pass through the markers to reach the MEMS array; however, very little energy is transmitted through, resulting in these regions being masked in the thickness maps. A similar effect occurs directly beneath the actuator, where acoustic energy transmission is also affected, and those areas are consequently masked.
The acoustic data collected during scanning is acquired on a measurement PC and stored. After acquisition, the data is processed offline to generate a thickness map of the component with a size of approximately 20 × 30 cm, utilizing the material’s phase velocity dispersion curve, known as Direct Velocity Mapping (DVM) [4], with the final spatial resolution of the thickness map being 1 mm. Figure 1 shows the final setup.
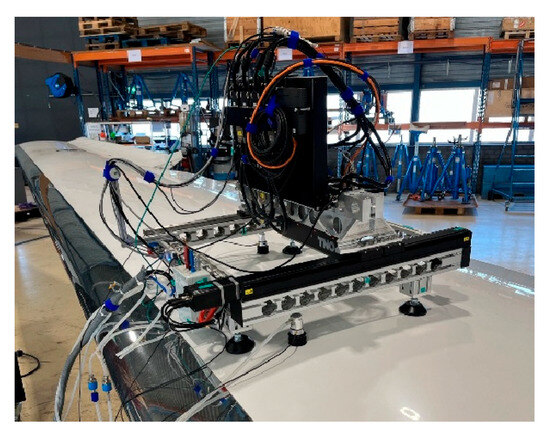
Figure 1.
The complete scanning system during operation on an aircraft wing.
2.2. Experiments
This study evaluates the suitability of the system for post-repair thickness measurements of corrosion spots in aircraft components by investigating accuracy, robustness, and reliability in an operational MRO environment. Field trials were conducted at JetSupport (Schiphol Airport, Schiphol, The Netherlands) on aluminum wing panels. High-curvature and complex geometries were excluded from this first prototype evaluation.
Two rounds of field trials were performed. The first focused on pristine wing areas to minimize variability. Its objectives were to assess thickness variation under operational conditions and system robustness to external factors. A calibration procedure was conducted on the test day to mitigate environmental influences such as temperature and humidity [3]. The first trial included three experiments:
- Repeatability test: The system was placed on a visually pristine area near the wing’s root, consisting of two adjacent panels, and a series of 14 consecutive measurements was performed without interrupting or repositioning the system. The resulting thickness maps were then used to calculate the standard deviation of the thickness variations between repetitive measurements.
- Actuator-repositioning test: In practice, the system and actuators must be repositioned to measure different corrosion spots. To assess the influence the actuator placement has on system performance and measurement results, the actuators were relocated between measurements. The system was again placed on top of the wing, at a panel joint, with one actuator on each panel located at diagonally opposing corners of the inspection area and three measurements were performed. The actuators were then repositioned to the opposite ends of the second diagonal, and another three scans were carried out. To compare the measurements between the two actuator-placement configurations, the mean value from each dataset was calculated and then subtracted from each thickness map.
- Vibration test: The system was placed on a pristine area of the wing, away from the root, and three measurements were performed during which vibrations were manually introduced by tapping near the scanner. External vibrations were generated by sustained manual tapping at the trailing edge of the wing, producing quasi-random temporal excitation due to the inherent variability of manual input, consistent with the random nature of vibrations that occur during maintenance routines. The mean value of each dataset was then subtracted from the respective thickness map to determine whether any significant variations appeared in the measured data.
The second round of field trials involved thickness measurements of blended corrosion spots on top of the wing and specifically near and at the edge of the air brake. The repaired spots can be observed in Figure 2. The actuators were placed at every panel located within the inspected area, and no parameters were varied during scanning.
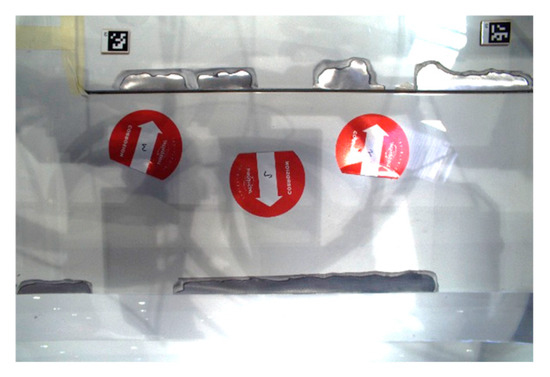
Figure 2.
Blended corrosion spots located at the trailing edge of the wing and on the air brake. The red stickers placed by the corrosion repair crew indicate corrosion spots that require removal. ArUco markers are placed only at the top corners of the panel, since the scanning region is at the edge of the wing, to enable co-registration of results.
3. Results and Discussion
This section presents the results obtained from the field trials described previously and discusses the performance of the system in terms of its reliability, accuracy and sensitivity to external parameters, as well as its ability to measure and determine the thickness of repaired corrosion spots.
3.1. Preliminary Results
3.1.1. Repeatability Tests
The histogram presented in Figure 3 depicts the variation in thickness between measurements. It is effectively a measure of the system’s ability to repeat multiple measurements without significant deviations from each other. The figure indicates a normal distribution with a standard deviation of 13.78 μm, while the majority of the values are within 50 μm—a requirement set during the conceptual and design phases of the system to ensure reliable thickness readings. This is a promising first result, suggesting that the current configuration is able to reproduce repeatable thickness measurements in thin aircraft panels (0.5–2 mm [8]) and that a 10% thickness reduction should be detectable.
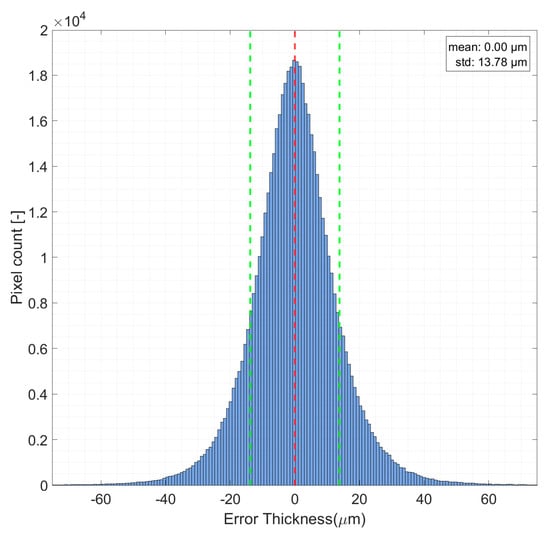
Figure 3.
Repeatability test results. Variation in thickness between measurements calculated using the recorded acoustical data from 14 sets of measurements. The red dashed line indicates the position of the mean, and the green dashed lines are the ± one standard deviation locations.
3.1.2. Vibration and Actuator-Positioning Effects
As outlined in Section 2.2, two robustness tests were performed: (i) actuator-repositioning, where actuators were placed at diagonally opposing corners of the inspection area and then moved to the opposite diagonal, and (ii) vibration tests, where actuators remained fixed while manual tapping near the inspection area introduced external disturbances. A selected region on the aircraft wing—consisting of two panels—that was scanned during these field trials is seen in Figure 4 along with the resulting thickness map from one of the tests and a schematic showing the nominal panel and rivet areas.
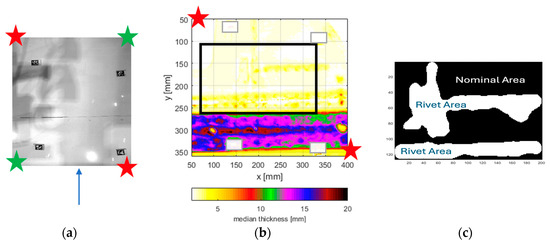
Figure 4.
The pristine area of the wing comprises two panels under inspection during vibrations and actuator placement tests. (a) Digital photo of the area with ArUco markers used in co-registration. The ceiling of the hangar is reflected by the wing. The blue arrow indicates the tapping position during vibration tests. The actuator placement in the vibration and actuator-position tests is indicated by the red and green stars, respectively. (b) Resulting thickness map from acoustical data obtained during a first (control) test. Encircled in black is the subset region that was further investigated during these tests. (c) Rivet and nominal areas within the encircled region of (b).
It is evident from Figure 4b that the MEMS sensor, apart from the skin, also detects the underlying structures that are connected to the skin. This is particularly apparent in the area in Figure 4b with thicknesses above 10 mm, which is far beyond regular skin thicknesses. To avoid the influence of these components, a subset of the area, where the acoustic response of the underlying structures is less significant, was chosen to further investigate actuator placement and vibration effects. In this subset, although not as severe, there are still discontinuities in areas of the panels due to rivets, seen in Figure 4c.
Thick underlying structures that are acoustically coupled to the wing skin, for example, through a combination of rivets and adhesives, reduce measurement accuracy, as absolute accuracy decreases with increasing thickness [7]. This reduction in accuracy is critical for corrosion inspections in these regions, as the 10% thickness reduction criterion applies only to the nominal thickness of the wing skin. Further research is required to enable reliable corrosion assessment in such structurally complex regions. For other applications, such as the detection of stringer debonds, these measurements may still be of interest; however, such applications are beyond the scope of this paper.
Figure 5 presents the variation in thickness difference between measurements for both the actuator-reposition and vibration tests, as well as a standard repeatability test to facilitate comparison. As each experiment was repeated three times, the mean from each thickness map was calculated and subtracted to produce the graphs in the figure.
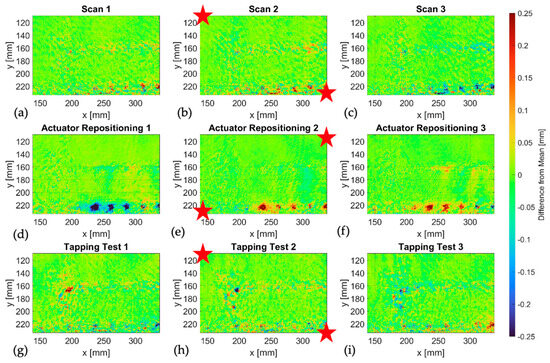
Figure 5.
Repeatability (a–c), actuator repositioning (d–f) and tapping (g–i) test results. The difference between the actual thickness and the mean calculated for each thickness map. The red stars indicate the position of the actuators during each test and are the same across tests of the same row.
All tests indicate a larger spread in the rivet areas compared to the nominal thickness regions, where the difference from the mean is within a ±2 μm range. In the rivet areas, that range is within ±5 μm, indicating that even small subsurface effects can influence measurements. In order to attempt a first indication of any potential vibration and actuator placement effects, the mean, standard deviation and the maximum error in nominal and rivet areas were calculated for each experiment. The mean is then the average of the three test cases within each experiment, which for all experiments is around 1 × 10⁻¹⁸ μm. This value is not significant within numerical precision and can therefore be considered effectively zero. The results are summarized in Table 1 below.

Table 1.
Mean, standard deviation and maximum error calculated for repeatability, actuator position and vibration experiments in rivet and nominal thickness zones.
The data presented in Table 1 show that both the actuator repositioning and vibration (tapping) tests yield results consistent with the repeatability baseline. The mean deviations are effectively zero across all experiments, confirming that no systematic bias was introduced by actuator movement or external disturbances. Standard deviations in the nominal regions remain within 50–65 µm, while slightly higher variability is observed in rivet areas due to localized structural discontinuities and acoustic coupling. Maximum errors are below 0.9 mm in all cases, indicating that the system maintains stable performance under moderate external excitation and actuator repositioning, with measurement variation comparable to normal repeatability.
3.2. Post-Corrosion Repair Thickness Measurements
Figure 6 presents the results from the inspection of several blended corrosion spots located on the top surface of the air brake on the aircraft’s wing. The camera image acquired prior to the scan is used in order to associate the blended corrosion spots with their actual locations in the thickness map.
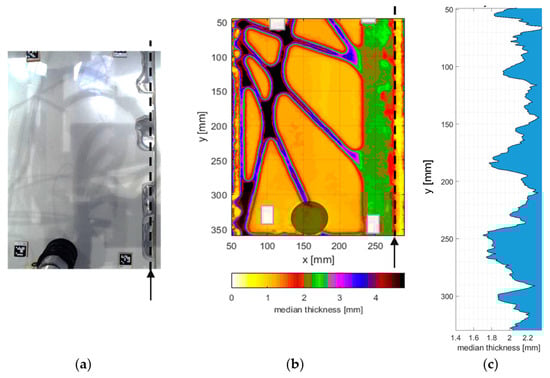
Figure 6.
Post-repair (blended) corrosion spots located at the edges of the air brake and the resulting thickness map. (a) Camera image of the inspected area. (b) Thickness map of the area, the white squares indicate the location of the ARUCO markers and the circle map indicates the location of the actuator. (c) Cross-section of the thickness map. The arrows in (a,b) indicate the cross-section of the thickness map shown in (c).
Thickness readings from acoustical data on blended corrosion spots range between 1.8 and 2.2 mm (Figure 6c). Thicker areas (>2.2 mm) in Figure 6 likely correspond to underlying structures acoustically coupled to the wing skin. In these regions, assessing skin thickness—as required during corrosion repairs—is challenging. Several strategies to address these complexities are under development. Moreover, visibility of underlying structures may have broader applications, such as investigating stringer debonding. These results are promising, indicating thinner skin at corrosion spots. However, pulse-echo measurements with manually drawn contours did not enable a reliable quantitative comparison. Future work will establish such a comparison.
4. Conclusions and Recommendations
This study evaluates a prototype Lamb-wave-based ultrasonic inspection system designed for automated post-repair thickness measurement of blended corrosion spots in aircraft structures. Under the requirement that a 10% reduction in thickness must be detectable, the results showed good sensitivity to thickness variations, with consistent accuracy in terms of repeatability, robustness to vibrations, and tolerance to variations in actuator positioning relative to the inspected area. The results on blended corrosion spots show that these areas have a reduced thickness. However, a comprehensive quantitative analysis and comparison to pulse-echo data to fully assess system accuracy remain tasks for future work.
A key challenge identified in this study is the acoustic coupling of subsurface structures, which makes it harder to measure the thickness of the airplane skin. Several solution strategies to mitigate the influence of these underlying structures are currently being investigated. These next steps will be critical in determining the system’s readiness for operational deployment in corrosion thickness measurements.
Author Contributions
Conceptualization, Q.M., R.P. and K.S.; methodology, J.-W.V. and M.M.; software, J.-W.V.; validation, J.-W.V., M.Z., R.v.d.V. and L.B.; formal analysis, J.-W.V., E.H. and L.B.; investigation, M.Z. and R.v.d.V.; writing—original draft preparation, M.Z.; writing—review and editing, M.Z., D.F., M.M., J.-W.V., E.H. and K.S.; project administration, Q.M. All authors have read and agreed to the published version of the manuscript.
Funding
The authors wish to acknowledge funding from the Netherlands Enterprise Agency (RVO; Dutch: Rijksdienst voor Ondernemend Nederland) Subsidy Scheme R&D Mobility Sectors (RDM) within the Bright Sky project, grant number MOB21010.
Institutional Review Board Statement
Not applicable.
Informed Consent Statement
Not applicable.
Data Availability Statement
The original contributions presented in this study are included in the article. Further inquiries can be directed to the corresponding author.
Acknowledgments
The authors gratefully acknowledge the participation of Claes Smallenbroek in the field trials, which were essential for the completion of this work. During the preparation of this manuscript, the author(s) used ChatGPT 5.1 for syntax and grammar checks. The authors have reviewed and edited the output and take full responsibility for the content of this publication.
Conflicts of Interest
Authors Robert Poppe, Roel van der Velde were employed by the company JetSupport and author Luca Brugaletta was employed by the company Science & Technology Corporation. The remaining authors declare that the research was conducted in the absence of any commercial or financial relationships that could be construed as a potential conflict of interest. The funders had no role in the design of the study; in the collection, analyses, or interpretation of data; in the writing of the manuscript; or in the decision to publish the results.
References
- Martinez, M.; Yanishevsky, M.; Rocha, B.; Groves, R.M.; Bellinger, N. Maintenance and Monitoring of Composite Helicopter Structures and Materials. In Structural Integrity and Durability of Advanced Composites; Beaumont, P.W.R., Soutis, C., Hodzic, A., Eds.; Woodhead Publishing Series in Composites Science and Engineering; Woodhead Publishing: Cambridge, UK, 2015; pp. 539–578. [Google Scholar] [CrossRef]
- Wang, B.; Zhong, S.; Lee, T.L.; Fancey, K.S.; Mi, J. Non-destructive testing and evaluation of composite materials/structures: A state-of-the-art review. Adv. Mech. Eng. 2020, 12, 1687814020913761. [Google Scholar] [CrossRef]
- Volker, A.; Vrolijk, J.W.; Merks-Swolfs, E.J.W.; van der Burg, D.; Heiden, M.S.; Martina, Q. Non-contact MEMS-sensor array inspection of composites and metallic parts using Lamb waves. J. Nondestruct. Eval. Diagn. Progn. Eng. Syst. 2023, 6, 041002. [Google Scholar] [CrossRef]
- Ichou, S.; Veress, A. Satisfying the needs for highly qualified engineering staff in a disruptively changing aircraft industry with special care for MRO sector. Aircr. Eng. Aerosp. Technol. 2024; in press. [Google Scholar] [CrossRef]
- Elizabeth, I.; Barshilia, H.C. A comprehensive review on corrosion detection methods for aircraft: Moving from offline methodologies to real-time monitoring combined with digital twin technology. Eng. Sci. Technol. 2025, 6, 69–98. [Google Scholar] [CrossRef]
- Federal Aviation Administration (FAA). Cessna Aircraft Company Model 300 and 400 Series Airplanes, Airworthiness Directive No. AD 2000-01-16; Amendment 39-11514; FAA: Washington, DC, USA, 2000. Available online: https://www.federalregister.gov/documents/2000/01/19/00-951/airworthiness-directives-cessna-aircraft-company-300-and-400-series-airplanes (accessed on 5 December 2025).
- Volker, A.; Stamoulis, K.; Schoemaker, C.; Apostolidis, A.; van Tongeren, D.; Poppe, R.; Bekkema, B.; Martina, Q. A Novel, Non-Contact NDT Scanner Case Study: Thickness Measurement, Debonding and Defects Detection in Metallic and Composite Parts. J. Phys. Conf. Ser. 2024, 2692, 012024. [Google Scholar] [CrossRef]
- Monette, D.L. Coating removal techniques in the aerospace industry. In Corrosion Control in the Aerospace Industry; Woodhead Publishing: Cambridge, UK, 2009; pp. 225–247. [Google Scholar]


Disclaimer/Publisher’s Note: The statements, opinions and data contained in all publications are solely those of the individual author(s) and contributor(s) and not of MDPI and/or the editor(s). MDPI and/or the editor(s) disclaim responsibility for any injury to people or property resulting from any ideas, methods, instructions or products referred to in the content. |
© 2025 by the authors. Licensee MDPI, Basel, Switzerland. This article is an open access article distributed under the terms and conditions of the Creative Commons Attribution (CC BY) license (https://creativecommons.org/licenses/by/4.0/).