Abstract
The demand for low-cost, portable, and sensitive analytical devices has fueled the development of 3D-printed biosensors. This study evaluates the effect of silk fibroin incorporation on the electrical properties of graphite-PLA electrodes manufactured via 3D printing. Electrochemical Impedance Spectroscopy (EIS) method was utilized to assess capacitive–resistive behavior under dry conditions, and with PBS buffer, at fibroin concentrations of 0%, 0.04%, 0.4%, and 4%. Fibroin modulated impedance magnitude values without a clear trend, indicating the presence of additional influencing factors. The results promote better understanding of biofunctionalization effects in 3D-printed electrodes and support their potential for biomedical, environmental, and industrial sensing applications.
1. Introduction
The increasing demand for low-cost, portable, and sensitive analytical devices has accelerated the development of biosensors for several applications, such as biomedical, environmental, and industrial. These devices integrate biorecognition elements with transducers to convert biochemical signals into measurable and quantifiable outputs [1].
Three-dimensional printing (3DP) technologies, such as Fused Deposition Modeling (FDM), have emerged as a low-cost, flexible alternative for the fabrication of electrochemical sensors with complex geometries. PLA-based filaments combined with conductive materials such as graphite (G/PLA) are commonly used, due to their low cost, ease of processing, and compatibility with conventional FDM printers [2,3,4]. However, these printed electrodes often require surface treatments to improve their electrochemical properties [5].
To enhance sensor performance, biomaterials such as silk fibroin have been investigated for the functionalization of the electrodes. These materials offer high stability and ability to modulate interfacial properties, as they function as a dielectric barrier and may support nanostructured surfaces [6,7,8]. Despite promising results, the effects of fibroin concentration on electrochemical behavior remain underexplored.
In this context, Electrochemical Impedance Spectroscopy (EIS) plays a central role as a non-destructive, label-free measuring technique for investigating interfacial phenomena at the electrode–electrolyte interface. EIS allows for the quantification of important electrical parameters, such as charge transfer resistance, double layer capacitance, and diffusive processes, making it applicable for evaluating surface modifications [9,10]. Due to its sensitivity to subtle changes in the electrochemical properties of the surface, this method is ideal to investigate how variations in fibroin concentration affect sensor behavior.
In this study, we investigate the effect of silk fibroin incorporation at different concentrations on the impedance response of 3DP G/PLA, using EIS as a characterization method. The results aim to clarify the role of fibroin change in the modulation of sensor performance and contribute to the development of more robust and reproducible biosensing platforms.
2. Material and Methods
The experimental procedure was structured to investigate the effects of the incorporation of silk fibroin on the electrical response of 3DP G/PLA biosensors. This section details the fabrication process, functionalization method, and electrochemical impedance measurement to assess the impact of fibroin concentration under controlled conditions.
2.1. Platform Fabrication
The platforms were fabricated using additive manufacturing by the FDM process, enabling the production of geometries through the extrusion of thermoplastic material. The devices consisted of a PLA base and conductive regions printed with graphite-filled PLA filament (G/PLA), selected for its electroactive properties.
The platform structure consists of a circular base with a diameter of 17 mm, surrounded by peripheral edges measuring 9 mm in height and 2 mm in thickness. Inside the base, two towers of conductive G/PLA structures, measuring 7 mm in length, 5 mm in height, and 3 mm in width, serve as electrodes. This configuration was useful for immersion of electrolytic solutions for EIS measurements and can be seen in Figure 1.
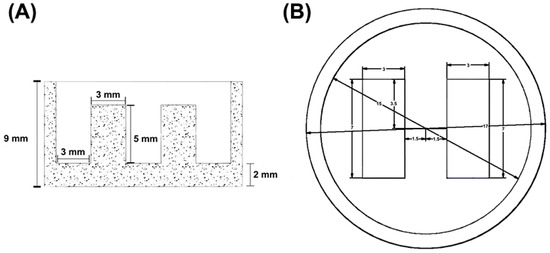
Figure 1.
Views of platform by software: (A) side view (B) top view.
After modeling, the files were exported and processed using Bambu Studio software (version 01.09) for printing. The parameters are listed in Table 1.

Table 1.
Three-dimensional printing parameters.
Platforms were printed using a Bambu Lab P1S printer (Bambu Lab, Shenzhen, China), equipped with a heated bed and a direct-drive extruder. Filaments were provided by Voolt3D and included standard PLA (1.75 mm ± 0.02 mm) and graphite-loaded PLA (1.75 mm ± 0.05 mm). After fabrication, devices were visually inspected for structural integrity and stored in dry conditions for testing.
2.2. Platform Functionalization with Silk Fibroin
Silk fibroin was extracted from Bombyx mori insect cocoons, following a modified protocol [11]. Casings of approximately 10 g were boiled for 15 min in 0.2% Na2CO3 for the removal of sericin, followed by being rinsed in distilled water. The fibers were then dried at 50 °C for 24 h and dissolved in 9.3 M LiBr, in 1 g per 4 mL proportion, at 80 °C. The solution was then dialyzed with hydrated cellulose membranes, in distilled water to remove residual salts and impurities, and centrifuged at 13,000 rpm for 30 min. The resultant solution was stored at 5 °C and homogenized at 37 °C before use.
The fibroin was prepared in three concentrations: 0.04%, 0.4%, and 4%. Each solution was applied onto the electrodes by drop-casting, forming a uniform and transparent conductive region. The devices were dried at 50 °C for 24 h and stored in a dry environment until use. The final functionalized platforms can be viewed in Figure 2.
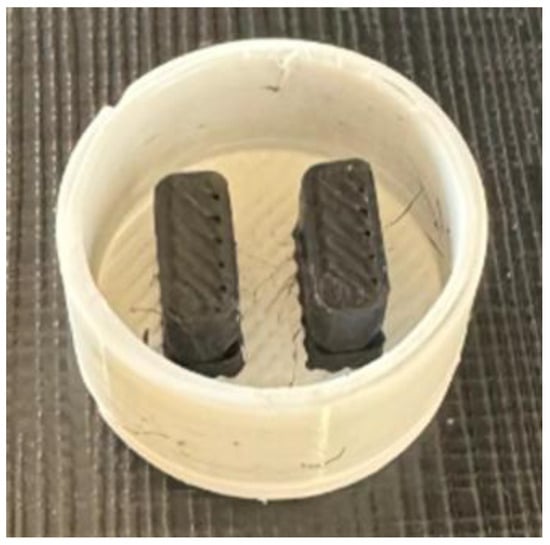
Figure 2.
Finalized 3DP fibroin-functionalized platform.
2.3. Measurement System
This section outlines instrumentation for the impedance measurement and procedures used to evaluate the electrical responses of the biofunctionalized platofrm under different conditions.
Electrochemical Impedance Spectroscopy was performed using the Diligent Analog Discovery 2 with Impedance Analyzer module. This setup allows the application of sinusoidal AC signals across a frequency range while measuring the complex impedance response. The measurements followed the voltage divider principle, using a known reference resistor () in series with the load (platform). From the voltage drop across the component, the system can measure the impedance magnitude (|Z|) and phase angle (θ). With these parameters, we can calculate the real and imaginary components of the impedance across measured frequencies, with Equations (1) and (2). The schematic of the measurement setup can be seen in Figure 3.
Re(Z) = Zcos(θ)
Im(Z) = Zsen(θ)
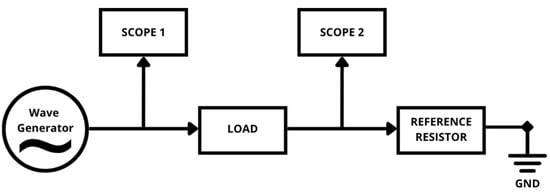
Figure 3.
Schematic of load impedance measurement [12].
Measurements were conducted using clips attached directly to the G/PLA electrodes from the impedance module. In low-volume tests, with liquid drops, the clips were positioned to avoid direct contact with the electrolyte. In immersion tests, the clips were completely submerged. Data was recorded with WaveForms software (version 3.22) and analyzed based on Nyquist and Bode plots. Table 2 presents specifications of the measuring system.
Table 2.
Measuring system parameters.
2.4. Experimental Conditions
This section describes the testing environments and procedures used to evaluate the electrical response of the biofunctionalized platorms, both under dry conditions and in contact with phosphate-buffered saline (PBS), simulating biological environments.
Dry-state tests were first conducted to establish a baseline impedance profile of the platforms. These included the following:
- Unmodified G/PLA platform (0% fibroin);
- Functionalized platform (0.04%, 0.4%, and 4%).
The aim of these tests was to assess whether the presence of fibroin was enough to influence the electrical response of the devices, even in dry conditions, without the presence of any conductive liquid or material.
PBS tests were then performed to simulate biological liquid phase conditions. Each G/PLA 3DP device, containing 0%, 0.04%, 0.4%, and 4% fibroin, was subjected to three exposure methods:
- 0.1 mL PBS drop placed on active region;
- 0.2 mL PBS drop placed on active region;
- Full immersion in PBS solution.
For the 0.1 mL and 0.2 mL PBS drop tests, the cathode and anode clips were positioned out of contact with the liquid to prevent interference. In the immersion test, both clips and electrodes were submerged. After each measurement, the platforms were rinsed with distilled water and dried before each test.
3. Results
This section presents the measurements of electrical impedance obtained under the different experimental conditions. All impedance spectra were acquired using EIS over a frequency range of 1 kHz to 1 MHz.
3.1. Dry-State Testing
The impedance spectra for the dry-state testing can be seen in Figure 4. The samples exhibit a similar behavior of high impedance at low frequencies and decline with increasing frequency, stabilizing at approximately 100 kHz. This behavior is seen in capacitive systems.
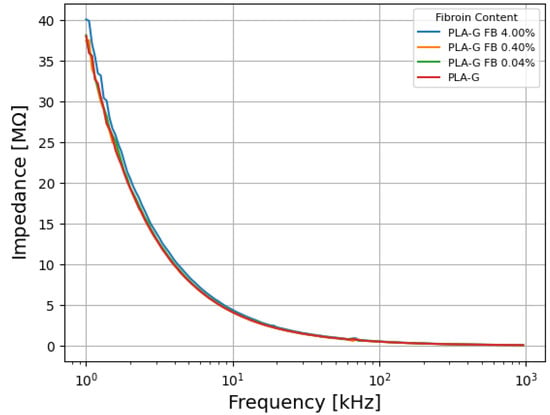
Figure 4.
Dry-state impedance by frequency curve of the platforms.
No significant differences were observed between the curves, regardless of the different fibroin concentrations. This suggests that the presence of fibroin does not significantly affect the electrical properties of G/PLA electrodes, in dry conditions.
3.2. PBS Testing
Electrical response in the presence of PBS liquid was evaluated in three different approaches: with a 0.1 mL drop, a 0.2 mL drop, and full immersion. Impedance curves were analyzed across all concentrations.
3.2.1. 0.1 mL of PBS
The impedance spectra for the application of a 0.1 mL drop of PBS are shown in Figure 5a. From the results, all samples maintained the same general trend observed in the dry state, but absolute values of |Z| varied. The 0% fibroin functionalized platform had the lowest impedance values, with incremental increases for higher fibroin concentrations. Nyquist plots, such as those shown in Figure 5b, revealed linear, diffusion-dominated behavior, without semicircles, suggesting that fibroin primarily increases the overall magnitude of the impedance without altering the electrochemical mechanism of the response.
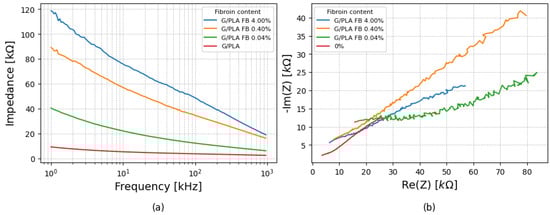
Figure 5.
(a) Impedance variation with frequency for platforms with different fibroin concentrations for 0.1 mL of PBS and (b) corresponding Nyquist plots under the same conditions.
3.2.2. 0.2 mL of PBS
Results for a 0.2 mL drop of PBS are shown in Figure 6a. While the general trend persisted, the magnitude pattern differed from the 0.1 mL case, as the 0.04% fibroin group displayed the highest values for |Z|, disrupting the linear relationship between fibroin concentration and impedance values. The Nyquist plots, seen in Figure 6b, remained predominantly linear, indicating diffusion process dominance, but showed greater variability among the samples.
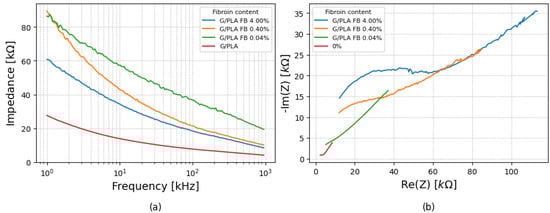
Figure 6.
(a) Impedance variation with frequency for platforms with different fibroin concentrations for 0.2 mL of PBS, and (b) corresponding Nyquist plots under the same conditions.
3.2.3. Immersion in PBS
Complete immersion results are seen in Figure 7a. The results showed consistent qualitative behavior across the samples, with high |Z| at low frequencies, decreasing with frequency increase. However, the lowest impedance was observed for the 0.4% fibroin functionalized platform, and the highest, for the 0.04%, again deviating from the linear trend seen in the 0.1 mL condition. Nyquist plots, in Figure 7b, maintained the diffusion linear form.
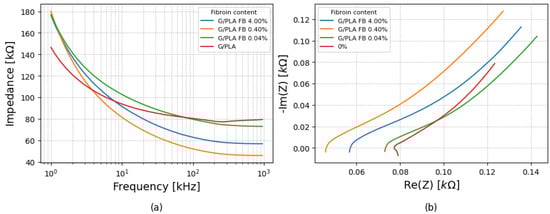
Figure 7.
(a) Impedance variation with frequency for platforms with different fibroin concentrations for immersion in PBS and (b) corresponding Nyquist plots under the same conditions.
The variations between the results suggest that factors such as fibroin film uniformity, interaction with PBS, or any other external factors, such as human measuring mistakes, may have affected the recorded values, leading to inconsistent trends across the tests.
3.3. Statistical Analysis
To evaluate the overall differences in impedance magnitude variation, the percentage change between the maximum and minimum |Z| values in each test was calculated. Results are presented in Table 3.
Table 3.
Percent variation in impedance values by fibroin concentration and PBS volume.
The data with standard deviations can be seen in Figure 8. A one-way statistical ANOVA test yielded p = 0.6159, indicating that there are no statistically significant differences between the groups at a 95% confidence level.
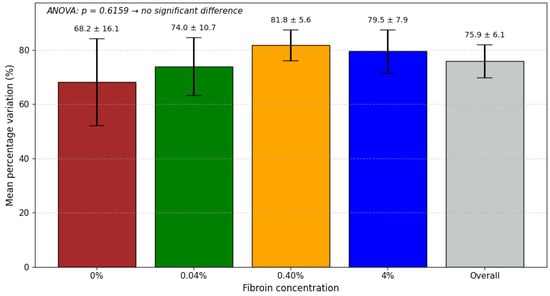
Figure 8.
Mean percentage variation in the electrical response for each fibroin concentration, with standard deviation. Values represent the reduction between the maximum and minimum across the three experimental conditions. The “Overall” bar shows the combined mean. ANOVA indicated no significant difference between concentrations (p = 0.6159).
All platforms presented a similar percentage variation between maximum and minimum impedance values, suggesting that, in general, electrochemical behavior remained similar for different values of fibroin concentration.
4. Discussions
In dry-state tests, all platforms with different fibroin concentrations showed overlapping impedance curves, with high |Z| at low frequencies with an accentuated value drop as frequency increased, typical of resistive–capacitive systems without mobile ions [13]. The results suggest that the protein does not significantly influence the conductivity of the materials, with G/PLA composition and electrode geometry remaining dominant [3].
The presence of PBS simulated a biological environment with double-layer formation between the electrode and electrolyte [13]. The tests all produced similar curves, with high values of |Z| at low frequencies, a steep decline, and continuous decrease at higher frequencies, as expected for conductive electrolytes [13]. No clear monotonic relationship between fibroin concentrations and impedance magnitude values was established, possibly due to factors such as ion adsorption, structural changes in the platforms, film heterogeneity or human error, and equipment limitations [14]. Fibroin and surface modifiers can alter double-layer formation or ion diffusion, and may influence impedance nonlinearly [13,15].
Despite magnitude differences, the impedance by frequency curves remained consistent across all conditions, in PBS testing, indicating that fibroin scales impedance without changing interfacial processes or time constants. The similar percentage variation in |Z| also suggests stable platform behavior, supporting the device’s reproducibility and robustness [13].
5. Conclusions
This study conducted impedance values test on 3DP G/PLA biofunctionalized platforms incorporating different silk fibroin concentrations, at 0.04%, 0.40% and 4.00%, using EIS to assess the influence of the protein on the electrical characteristics of the devices. Measurements were tested at dry conditions and with phosphate-buffered saline (PBS) in varying volumes.
The results showed that fibroin did not significantly affect the electrical response in dry state, which was dominated by intrinsic properties of G/PLA and electrode geometry. In PBS testing, the protein altered the magnitude of the impedance values without modifying the diffusion-controlled behavior. No monotonic relationship between fibroin concentration and impedance magnitude was established, likely due to surface heterogeneity, electrolyte interactions, and experimental variability.
Regardless of variations, the preservation of curve profiles and similar percentual variations across tests suggests stable electrochemical performance of the devices, highlighting the potential of this platform for robust and reproducible biosensing applications.
Author Contributions
Conceptualization, G.M.R., A.C.A., P.O.C.J., F.R.L.D. and A.R.R.; methodology, A.C.A., F.R.L.D., E.P.d.C.N. and G.M.R.; software, E.P.d.C.N. and F.R.L.D.; validation, P.O.C.J. and A.C.A.; formal analysis, P.O.C.J. and A.C.A.; investigation, E.P.d.C.N.; resources, P.O.C.J., F.R.L.D. and E.P.d.C.N.; data curation, P.O.C.J. and F.R.L.D.; writing—original draft preparation, E.P.d.C.N.; writing—review and editing, E.P.d.C.N. and P.O.C.J.; supervision, P.O.C.J. and A.C.A.; project administration, P.O.C.J.; funding acquisition, P.O.C.J. All authors have read and agreed to the published version of the manuscript.
Funding
Pro-Rectory of Research and Innovation of the University of São Paulo under grant #22.1.09345.01.2, and the National Council for Scientific and Technological Development (CNPq) under grant #445054/2024-7.
Institutional Review Board Statement
Not applicable.
Informed Consent Statement
Not applicable.
Data Availability Statement
The raw data supporting the conclusions of this article will be made available by the authors on request.
Acknowledgments
The authors would like to thank the University of São Paulo (USP), the University of Araraquara (UNIARA), and the National Council for Scientific and Technological Development (CNPq), for the opportunity to carry out and publish the research.
Conflicts of Interest
The authors declare no conflicts of interest.
References
- Ribeiro, J.A.; Jorge, P.A. Applications of electrochemical impedance spectroscopy in disease diagnosis—A review. Sens. Actuators Rep. 2024, 8, 100205. [Google Scholar] [CrossRef]
- Magar, H.S.; Hassan, R.Y.A.; Mulchandani, A. Electrochemical impedance spectroscopy (eis): Principles, construction, and biosensing applications. Sensors 2021, 21, 6578. [Google Scholar] [CrossRef] [PubMed]
- Sharma, A.; Faber, H.; Khosla, A.; Anthopoulos, T.D. 3D printed electrochemical devices for bio-chemical sensing: A review. Mater. Sci. Eng. R Rep. 2023, 156, 100754. [Google Scholar] [CrossRef]
- Stefano, J.S.; Kalinke, C.; da Rocha, R.G.; Rocha, D.P.; da Silva, V.A.O.P.; Bonacin, J.A.; Angnes, L.; Richter, E.M.; Janegitz, B.C.; Muñoz, R.A.A. Electrochemical (bio)sensors enabled by fused deposition modeling-based 3d printing: A guide to selecting designs, printing parameters, and post-treatment protocols. Anal. Chem. 2022, 94, 6417–6429. [Google Scholar] [CrossRef] [PubMed]
- Foo, C.Y.; Lim, H.N.; Mahdi, M.A.; Wahid, M.H.; Huang, N.M. Three-dimensional printed electrode and its novel applications in electronic devices. Sci. Rep. 2018, 8, 5. [Google Scholar] [CrossRef] [PubMed]
- Meng, G.; Long, F.; Zeng, Z.; Kong, L.; Zhao, B.; Yan, J.; Yang, L.; Yang, Y.; Liu, X.-Y.; Yan, Z.; et al. Silk fibroin based wearable electrochemical sensors with biomimetic enzyme-like activity constructed for durable and on-site health monitoring. Biosens. Bioelectron. 2023, 228, 115198. [Google Scholar] [CrossRef] [PubMed]
- Choi, J.; Lee, S.H.; Kim, T.; Min, K.; Lee, S.-N. Capacitance and dielectric properties of spin-coated silk fibroin thin films for bioelectronic capacitors. Materials 2025, 18, 1408. [Google Scholar] [CrossRef] [PubMed]
- Molinnus, D.; Drinic, A.; Iken, H.; Kröger, N.; Zinser, M.; Smeets, R.; Köpf, M.; Kopp, A.; Schöning, M.J. Towards a flexible electrochemical biosensor fabricated from biocompatible bombyx mori silk. Biosens. Bioelectron. 2021, 183, 113204. [Google Scholar] [CrossRef] [PubMed]
- Bigdeli, I.K.; Yeganeh, M.; Shoushtari, M.T.; Zadeh, M.K. Chapter 23—Electrochemical impedance spectroscopy (eis) for biosensing. In Nanosensors for Smart Manufacturing; Thomas, S., Nguyen, T.A., Ahmadi, M., Farmani, A., Yasin, G., Eds.; Micro and Nano Technologies; Elsevier: Amsterdam, The Netherlands, 2021; pp. 533–554. [Google Scholar]
- Kemp, N.T. A tutorial on electrochemical impedance spectroscopy and nanogap electrodes for biosensing applications. IEEE Sens. J. 2021, 21, 22232–22245. [Google Scholar] [CrossRef]
- Rockwood, D.N.; Preda, R.C.; Yücel, T.; Wang, X.; Lovett, M.L.; Kaplan, D.L. Materials fabrication from Bombyx mori silk fibroin. Nat. Protoc. 2011, 6, 1612–1631. [Google Scholar] [CrossRef] [PubMed] [PubMed Central]
- Digilent Inc. Impedance Analyzer Reference Manual. Available online: https://mm.digikey.com/Volume0/opasdata/d220001/medias/docus/814/Analog_Discovery_Impedance_Analyzer_RM_Web.pdf (accessed on 11 August 2025).
- Lazanas, A.C.; Prodromidis, M.I. Electrochemical impedance spectroscopya tutorial. ACS Meas. Sci. Au 2023, 3, 162–193. [Google Scholar] [CrossRef] [PubMed]
- Remaggi, G.; Zaccarelli, A.; Elviri, L. 3D printing technologies in biosensors production: Recent developments. Chemosensors 2022, 10, 65. [Google Scholar] [CrossRef]
- Mackay, S. Design of an Impedance-Based, Gold Nanoparticle Enhanced Biosensor System. Master’s Thesis, University of Alberta, Edmonton, AB, Canada, 2017. [Google Scholar]
Disclaimer/Publisher’s Note: The statements, opinions and data contained in all publications are solely those of the individual author(s) and contributor(s) and not of MDPI and/or the editor(s). MDPI and/or the editor(s) disclaim responsibility for any injury to people or property resulting from any ideas, methods, instructions or products referred to in the content. |
© 2025 by the authors. Licensee MDPI, Basel, Switzerland. This article is an open access article distributed under the terms and conditions of the Creative Commons Attribution (CC BY) license (https://creativecommons.org/licenses/by/4.0/).