Abstract
Traditional fire alarm systems use smoke sensors to monitor the concentration of smoke particles in the air. If the concentration exceeds a certain threshold, an alarm signal is triggered. However, this detection process could lead to false fire alarms, causing unnecessary evacuations and panic among residents. False alarms may result from activities such as smoking in non-smoking areas, burning Oud, or cooking smoke. In this study, a deep neural network (DNN) model was trained to classify three types of smokes that were Oud, cigarette, and burning tissue smokes. The offline prediction accuracy of this model was 97.5%. The size of the model after converting it to TensorFlow lite was 4.7 Kbytes. It can also be converted to a tiny model to deploy it on microcontroller.
1. Introduction
The traditional fire alarm systems are essential components of an indoor safety environment. These systems typically rely on smoke sensors that set an alarm if the concentration of smoke particles exceeds a specific threshold [1]. The downside of a similar system is unable to classify gasses and smokes, which could lead to generating false alarms from non-threatening activities, such as Oud, cigarette smokes, or cooking. These false alarms can cause panic, unnecessary evacuations, and a decline in trust in the reliability of fire alarm systems. By adding gasses and smokes classification, the system will be able to distinguish between hazardous and harmless smoke, which will result in an increase in the level of reliability of the system. Several studies have explored different mechanisms to detect and classify leakage in different applications. For instance, Barkani et al. [2] have deployed a lightweight convolutional neural network on a microcontroller integrated with a thermal camera to detect gas leaks. Khan [3] has detected gas leakage based on the gas concentration using semiconductor sensors. Pan et al. [4] have utilized a neural network, IoT technology, and surveillance camera to early detect fires. Sharma et al. [5] have investigated multiple gas sensors with thermal cameras and federated learning techniques to detect gas leakages. However, there is no study classifying different types of smokes in indoor environments that assists in enhancing the performance of the fire alarm system. Therefore, in this study, a deep neural network (DNN) was utilized to classify three different types of smokes, which were cigarettes, Oud, and burning tissue smokes, including fresh air (background) in an indoor environment. The smoke classification DNN model can be converted to a smaller model that can be deployed on a microcontroller to enhance the performance of the fire alarm detector. This classification process will provide users with a predicted smoke type before a fire alarm.
2. Materials and Methods
2.1. System Description
In this study, Tiny-ML will be used to classify the source of smoke in an indoor environment. The datasets that were used to train the machine learning model were acquired by using three different sensor modules, as shown in Table 1 [6,7,8,9,10,11,12]. The first module (BME 680) was used to detect and measure volatile organic compounds (VOC), temperature, and humidity. The second sensor module (Grove–Multichannel Gas sensor V2), which consists of four gas sensors, was utilized to detect carbon monoxide (CO), nitrogen dioxide (NO2), ethanol (C2H5CH), and volatile organic compounds (VOCs). The third sensor module (MQ 136) acquired hydrogen sulfide. These sensor modules were integrated with Wio terminal microcontroller as shown in Figure 1. This Wio terminal was used because it has an ARM Cortex-M4F core running at 120 MHz. This microcontroller also supports Arduino library for TensorFlow lite for microcontroller. Moreover, it has 4 MB of external flash and 192 KB RAM. It also supports all communication protocols used by sensor modules. These features allow us to deploy the Tiny-ML model [13,14].

Table 1.
Gas sensors specifications.
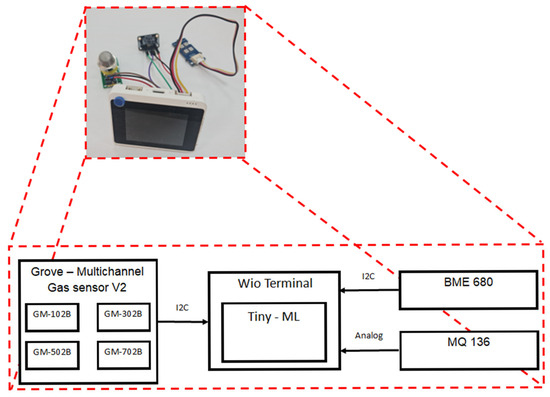
Figure 1.
The block diagram of the fire alarm detector.
2.2. Data Collection and Calibration
Three types of smoke were used to collect datasets that were cigarettes, Oud, and burning tissue smokes, including fresh air (background) in an indoor environment. The size of the room that was used to collect datasets is around 76 m3. Moreover, the distance between the source of smoke and gas sensors was 30 cm. Before collecting smoke data, the used gas sensors were run for 48 h as to preheat them, which is recommended in their datasheet [6,7,8,9,10,11,12]. After that, when these sensors were run again, they needed almost 30 min to preheat until the sensor data became stable. The smokes datasets were collected using Arduino and Python codes that were written by Shawn Hymel [15]. However, the Arduino code was modified by using Arduino IDE 1.8.19 to be suitable for collecting data from the used gas sensors. The sampling rate for these sensors was set to be 10 samples per second. 20 samples were also acquired for each single data file. These data files were saved in .CSV format. In total, 2400 data files were collected for all smoke types, including fresh air.
In this study, the output data from the gas sensors were affected by the temperature and humidity of the surrounding environment. Therefore, the collected dataset should be calibrated before using it in training a deep neural network (DNN) model. However, there is no clear equation or graph that describe the relation between the output of these gas sensors and the temperature and humidity of the surrounding environment. To deal with this issue, the effect of changing the surrounding temperature on the output of the gas sensor was analyzed when the surrounding humidity was assumed fixed. This was performed by acquiring data from gas sensors for fresh air inside the room for different temperature values as shown in Figure 2. During the collection of data, the humidity inside the room changed between 21% and 25%.
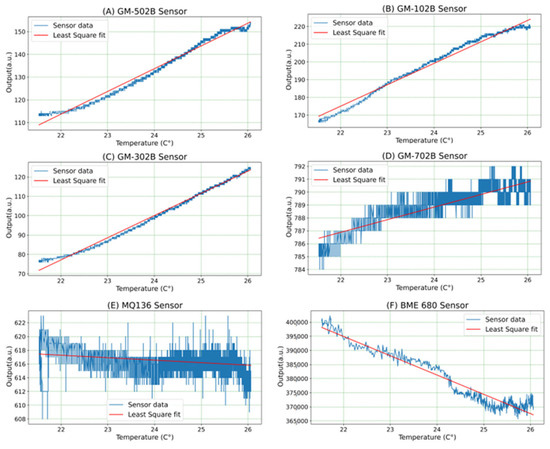
Figure 2.
The relation between the gas sensors’ output and the temperature of the surrounding environment.
From Figure 2, it can be noticed that the output of GM-502B, GM-102B, and GM-302B sensors linearly increased when the room temperature increased (Figure 2A–C). When the room temperature increases from 22 °C to 26 °C, the output of GM-502B, GM-102B, and GM-302B sensors rises by 37, 47, and 45 a.u., respectively. The output of GM-702B was slightly raised by changing the room temperature, as shown in Figure 2D. The output of GM-702B increased by 5 a.u. when the room temperature changed from 22 °C to 26 °C. The output of the MQ-136 sensor is almost not affected by the temperature of the room, as shown in Figure 2E. This led to neglecting the effect of temperature on the output of the MQ-136 sensor. In addition, the output of the BME-860 VOC gas sensor reduced when the temperature of the surrounding environment increased, as shown in Figure 2F. When the room temperature rose from 22 °C to 26 °C, the output of the BME-860 VOC gas sensor reduced by 35,7337 a.u.
The least square method was used to determine the linear relation between the gas sensors’ outputs and the temperature of the surrounding environment. Based on this method, the slope and y intercept for the straight line Equation (1) were calculated [16].
where is the output of gas sensor, is the slope, is the temperature, and is the y intercept. The slope () can be calculated by using Equation (2) [16]:
where is the number of samples. The y intercept () can be calculated using Equation (3) [16]:
The correlation between the output of gas sensors and the room temperature can be measure using Pearson Correlation Coefficient () as shown in Equation (4) [16]:
Based on these equations, the least square fitting functions and correlation coefficients between gas sensors outputs and temperature were calculated by using Python 3.11.5 as shown in Table 2. There are high positive correlations (r = 0.99) between the output of GM-502B, GM-102B, and GM-302B gas sensors and room temperature. The output of GM-702B gas sensor also has a high positive coefficient with room temperature, which is 0.85. Whereas the output of the MQ-136 sensor is not correlated with room temperature. The correlation coefficient between them is −0.29. In addition, the output of the BME-860 VOC gas sensor has a high negative correlation with the room temperature. It had a −0.95 correlation coefficient. This means when the room temperature increases, the output of the gas sensor reduces. The least square fitting functions in Table 2 were used to plot the least square fitting straight line for each gas sensor in Figure 2.
Table 2.
The least square fitting function and correlation coefficient between gas sensors outputs and the surrounding environment temperature.
2.3. Data Preprocessing
In this study, four classes of smoke that are fresh air (background), cigarettes, Oud, and burning tissue smokes were used. 600 data files were acquired for each class. In addition, each data file had 20 data samples for each gas sensor. In the beginning, the collected data samples were calculated at 25 °C, as shown in Figure 3. After that, these collected data samples were normalized for each gas sensor using Equation (5) [17]:
where is the normalization value, is a sample value, is the minimum value of the data samples, and is the maximum value of the data samples. This normalization process improved the performance of the training machine learning (ML) model by using a single scale for all data samples. After performing the normalization process, each data file had 20 normalized data samples for each gas sensor. Average, standard deviation, minimum, maximum, and root mean square (RMS) values were calculated for each gas sensor in the data file, as shown in Figure 3. Then these values will be used to train the DNN model [15,18].
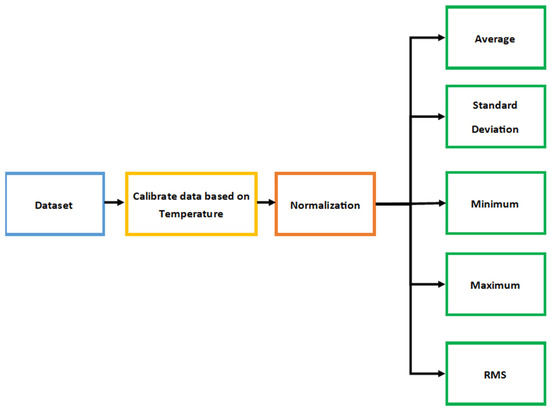
Figure 3.
The steps of preprocessing data.
2.4. Deep Neural Network (DNN) Model
TensorFlow (Version 2.12.0) is an open-source deep learning software [19] and was used to design and train the smoke classification model, as shown in Figure 4. The input of this model is an array of preprocessing data consisting of 30 elements. As a result, the input layer of DNN contains 30 nodes. In addition, this DNN has two hidden layers and one dropout layer, as shown in Figure 4. The first hidden layer consists of 30 nodes, while the second hidden layer has 10 nodes. The activation function of these hidden layers was the rectified linear unit (ReLU) [20]. The dropout layer was also set between these two hidden layers to avoid overfitting [21]. The percentage of dropouts was 20%. The output layer had 4 nodes that represented the classification classes. The activation function of this layer was softmax. In this training, the dataset was divided into three parts that were 60% for training, 20% for validation, and 20% for testing. The sparse_categorical_crossentropy loss function and adam optimizer with a learning rate = 0.001 were used. In addition, the number of epochs and batch size were 150 and 32, respectively.
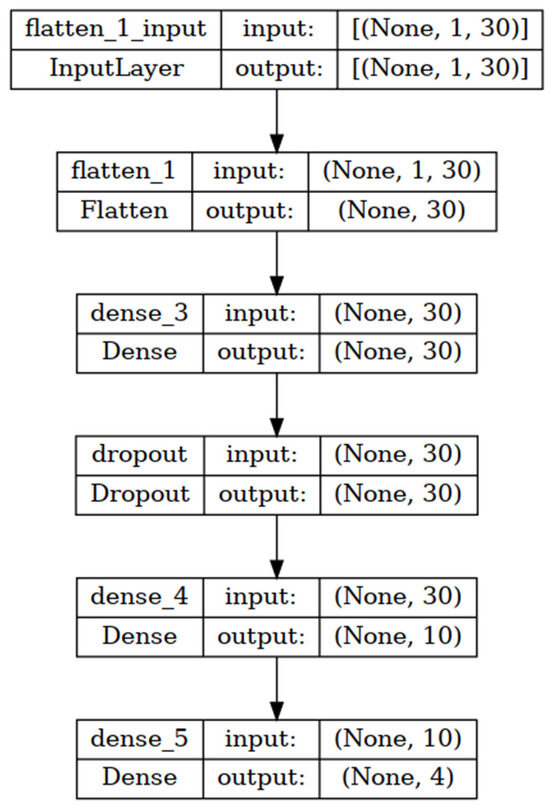
Figure 4.
The structure of smoke classification model.
3. Results and Discussion
The accuracy and loss of the DNN module during training epochs are shown in Figure 5. The training and validation accuracy at epoch number 150 were 97% and 97.7%, respectively. In addition, the training loss and validation loss at epoch number 150 were 0.094 and 0.052, respectively. The test accuracy of this model is 97.5%. Figure 6 shows the confusion matrix for the smoke classification model. This classification model was 100% accurate for background and cigarette smoke testing data. However, 2.7% of Oud testing data and 7.59% of tissue testing data were misclassified. The macro average precision, recall, and F1 score of the classification model were 97.48%, 97.45%, and 97.43%, respectively [22].
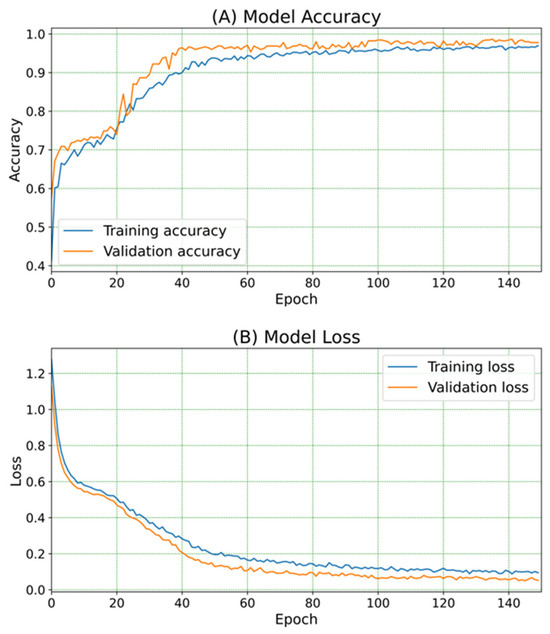
Figure 5.
(A) The accuracy of DNN model, and (B) the loss of the DNN model during training epochs.
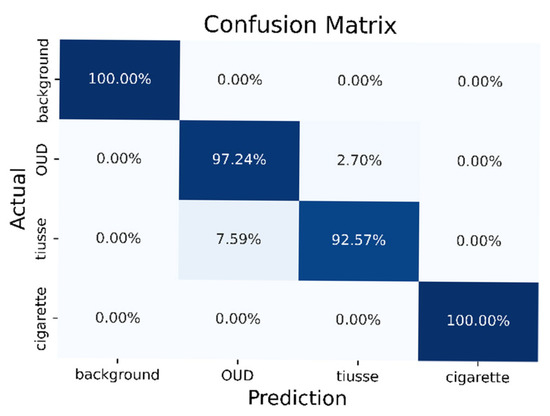
Figure 6.
The confusion matrix for the smoke classification model.
This smoke classification model was optimized by using post training quantization technique. In this technique, the model weight was quantified from 32-bit float to 8-bit integer. This led to reducing the size, latency, and power consumption of the model. However, the accuracy of the model will be slightly reduced due to this quantization process [23]. The size of the model after applying post-training quantization and converting the model to TensorFlow lite (flatbuffer) was 7.4 Kbytes. Before deploying this classification model on Wio terminal, the TensorFlow lite model was converted to C data file. In addition, the Arduino TensorFlow lite for microcontroller library (Version 2.0) was used to run and interpret C data file of the model.
Before providing the deployed model on Wio terminal with sensor data, these data were calibrated to be collected at 25 °C temperature. Then, these data were normalized using the maximum and minimum values of the training data. After that, average, strander deviation, minimum, maximum, and RMS values for each 20 samples of each sensor were calculated to use them as an input for the model [15,18]. The allocated tensor arena and inference time of the deploying model were 1.3 KB, and 226 usec, respectively. This deployment model was tested in an indoor environment. The temperature and humidity in the testing area were around 30 °C and 22%, respectively. During the testing, the system was able to predict all smoke types. However, the prediction of the system fluctuated for Oud and tissue smokes before providing the right prediction. Based on this result, the classification smoke model can enhance the fire alarm system by providing the user with a prediction of the source of smoke before generating alarm signals.
4. Conclusions
In this paper, three different smoke types were classified using Tiny-ML technology. The accuracy of the model was 97.5%. This type of smoke classification will assist in predicting the source of smoke before triggering the fire alarm system and taking action to evacuate buildings. In future work, the number of classification smoke classes will be increased. In addition, this detection system will be connected with mobile applications to receive alarms and smoke source predictions remotely.
Author Contributions
Conceptualization, A.A. (Abdulrhman Alshaya); methodology, A.A. (Abdulrhman Alshaya); software, A.A. (Abdulrhman Alshaya); validation, A.A. (Abdulrhman Alshaya); formal analysis, A.A. (Abdulrhman Alshaya); investigation, A.A. (Abdulrhman Alshaya); literature review, A.A. (Abdulrhman Alshaya) and A.A. (Abdullah Almutairi); data curation, A.A. (Abdulrhman Alshaya); writing—original draft preparation, A.A. (Abdulrhman Alshaya) and A.A. (Abdullah Almutairi); writing—review and editing, A.A. (Abdulrhman Alshaya) and A.A. (Abdullah Almutairi); visualization, A.A. (Abdulrhman Alshaya); supervision, A.A. (Abdulrhman Alshaya). All authors have read and agreed to the published version of the manuscript.
Funding
This research received no external funding.
Institutional Review Board Statement
Not applicable.
Informed Consent Statement
Not applicable.
Data Availability Statement
Data are contained within the paper.
Conflicts of Interest
The authors declare no conflicts of interest.
References
- Li, X.; Vázquez-López, A.; del Río Sáez, J.S.; Wang, D.-Y. Recent Advances on Early-Stage Fire-Warning Systems: Mechanism, Performance, and Perspective. Nano-Micro Lett. 2022, 14, 197. [Google Scholar] [CrossRef] [PubMed]
- El Barkani, M.; Benamar, N.; Talei, H.; Bagaa, M. Gas Leakage Detection Using Tiny Machine Learning. Electronics 2024, 13, 4768. [Google Scholar] [CrossRef]
- Khan, M.M. Sensor-Based Gas Leakage Detector System. Eng. Proc. 2020, 2, 28. [Google Scholar] [CrossRef]
- Pan, G.; Xie, Y.; Yang, Q. IoT-based cloud monitoring system for building fires. Int. J. Metrol. Qual. Eng. 2025, 16, 1. [Google Scholar] [CrossRef]
- Sharma, A.; Khullar, V.; Kansal, I.; Chhabra, G.; Arora, P.; Popli, R.; Kumar, R. Gas Detection and Classification Using Multimodal Data Based on Federated Learning. Sensors 2024, 24, 5904. [Google Scholar] [CrossRef] [PubMed]
- BME680 Low Power Gas, Pressure, Temperature & Humidity Sensor. Available online: https://www.bosch-sensortec.com/media/boschsensortec/downloads/datasheets/bst-bme680-ds001.pdf (accessed on 4 August 2025).
- Grove- Multichannel Gas Sensor v2. Available online: https://docs.rs-online.com/12eb/A700000011325879.pdf (accessed on 4 August 2025).
- Hydrogen Sulfide Gas Sensor (Model: MQ136). Available online: https://www.winsen-sensor.com/d/files/manual/mq136.pdf (accessed on 4 August 2025).
- MEMS Carbon Monoxide Gas Sensor (Model No.: GM-702B). Available online: https://www.winsen-sensor.com/d/files/PDF/MEMS%20Gas%20Sensor/gm-702b%EF%BC%88ver1_1%EF%BC%89manual.pdf (accessed on 4 August 2025).
- MEMS Alcohol Gas Sensor (Model N0.: GM-302B). Available online: https://www.cnwinsen.com/wp-content/uploads/2021/08/MEMS-GM-302B-Manual-V1.1.pdf (accessed on 4 August 2025).
- MEMS NO2 Gas Sensor (Model No.:GM-102B). Available online: https://www.cnwinsen.com/wp-content/uploads/2021/08/MEMS-GM-102B-Manual-V2.1.pdf (accessed on 4 August 2025).
- MEMS VOC Gas Sensor (Model No.:GM-502B). Available online: https://www.winsen-sensor.com/d/files/manual/gm-502b.pdf (accessed on 4 August 2025).
- Wio Terminal: ATSAMD51 Core with Realtek RTL8720DN BLE 5.0 & Wi-Fi 2.4/5G Dev Board. Available online: https://mm.digikey.com/Volume0/opasdata/d220001/medias/docus/423/102991299_Web.pdf (accessed on 4 August 2025).
- Wio Terminal Tensorflow Lite Micro Getting Started. Available online: https://wiki.seeedstudio.com/Wio-Terminal-TinyML-TFLM-1/ (accessed on 4 August 2025).
- How to Make an AI-Powered Artifical Nose. Available online: https://www.digikey.com/en/maker/projects/how-to-make-an-ai-powered-artificial-nose/3fcf88a89efa47a1b231c5ad2097716a (accessed on 4 August 2025).
- Cantrell, C.A. Technical Note: Review of methods for linear least-squares fitting of data and application to atmospheric chemistry problems. Atmos. Chem. Phys. 2008, 8, 5477–5487. [Google Scholar] [CrossRef]
- Sujon, K.M.; Hassan, R.B.; Towshi, Z.T.; Othman, M.A.; Samad, M.A.; Choi, K. When to Use Standardization and Normalization: Empirical Evidence From Machine Learning Models and XAI. IEEE Access 2024, 12, 135300–135314. [Google Scholar] [CrossRef]
- [LEE3] Lessons learned from building a connected artificial nose with TinyML Benjamin Cabé,Microsoft. Available online: https://youtu.be/gtrE-uBMko0?si=YRHk6xFUbc21qqnI (accessed on 4 August 2025).
- Syed, M.A. Overview on Open Source Machine Learning Platforms-TensorFlow. SSRN Electron. J. 2020, 3, 11–14. [Google Scholar] [CrossRef]
- Glorot, X.; Bordes, A.; Bengio, Y. Deep Sparse Rectifier Neural Networks. In Proceedings of the Fourteenth International Conference on Artificial Intelligence and Statistics, Fort Lauderdale, FL, USA, 11–13 April 2011; pp. 315–323. Available online: https://proceedings.mlr.press/v15/glorot11a.html (accessed on 4 August 2025).
- Srivastava, N.; Hinton, G.; Krizhevsky, A.; Sutskever, I.; Salakhutdinov, R. Dropout: A simple way to prevent neural networks from overfitting. J. Mach. Learn. Res. 2014, 15, 1929–1958. [Google Scholar]
- Takahashi, K.; Yamamoto, K.; Kuchiba, A.; Koyama, T. Confidence interval for micro-averaged F1 and macro-averaged F1 scores. Appl. Intell. 2022, 52, 4961–4972. [Google Scholar] [CrossRef] [PubMed]
- Warden, P.; Situnayake, D. TinyML: Machine Learning with TensorFlow Lite on Arduino and Ultra-Low-Power Microcontrollers; O’Reilly Media, Inc.: Sebastopol, CA, USA, 2019. [Google Scholar]


Disclaimer/Publisher’s Note: The statements, opinions and data contained in all publications are solely those of the individual author(s) and contributor(s) and not of MDPI and/or the editor(s). MDPI and/or the editor(s) disclaim responsibility for any injury to people or property resulting from any ideas, methods, instructions or products referred to in the content. |
© 2025 by the authors. Licensee MDPI, Basel, Switzerland. This article is an open access article distributed under the terms and conditions of the Creative Commons Attribution (CC BY) license (https://creativecommons.org/licenses/by/4.0/).