Abstract
Traditional medical techniques are constrained by macro-scale detection methods, making it difficult to capture dynamic changes at the cellular level. The miniaturization and high-throughput capabilities of integrated circuit technology enable precise manipulation and real-time monitoring of biological processes. In this study, COMSOL Multiphysics 6.3 software was used to model electrode units, simulating the interaction between cells and their biological environment. From the perspective of electrode arrays, the influence of varying electrode-cell contact areas on electrical signals was investigated, and the structure and layout of the microelectrode array (MEA) were optimized. The research explored the relationship between cellular activity and electrical properties, as well as the effect of cellular activity on membrane permeability. Simulation results demonstrated that larger electrode coverage areas improve potential distribution. The intact phospholipid bilayer and functional membrane proteins of living cells create a significant current-blocking effect, with impedance values reaching 105–106 Ω·cm2. In contrast, apoptotic or necrotic cells exhibit structural damage and ion channel inactivation, leading to significantly enhanced membrane permeability, with impedance decreasing by 1–2 orders of magnitude. Further simulations involved modeling microfluidic channels to study cellular behavior within them. Frequency response analysis and Bode plots revealed that impedance differences between low and high frequencies could distinguish living cells (higher impedance) from apoptotic cells (lower impedance). Therefore, Bode plot analysis can assess membrane permeability and infer cellular health or apoptotic state. Additionally, this study examined micro-nanofabrication techniques, particularly the lift-off process for microelectrode fabrication, and optimized photoresist selection in photolithography.
1. Introduction
Over the past few decades, the rapid development of integrated circuit (IC) technology has fundamentally reshaped modern life through its widespread application in the electronics industry. Biomedical engineering, an emerging interdisciplinary field, aims to apply engineering principles and techniques to solve problems in the life sciences and improve human health. Introducing IC technology into biomedical engineering opens new avenues for interdisciplinary innovation, enabling precise manipulation and analysis of biological samples. This integration offers more effective approaches for disease diagnosis, treatment, and prevention.
Microfluidic chip technology [1], by precisely controlling the flow of minute fluid volumes, can efficiently simulate the microenvironment within living organisms, providing an ideal platform for biomedical research. This technology accurately regulates fluid flow velocity, pressure, and shear stress within microfluidic systems, replicating the physiological functions of organs and tissues. Consequently, it offers a realistic and reliable experimental environment for drug screening and toxicity assessment [2].
Compared to traditional two-dimensional cell culture methods, microfluidic chips can mimic the complex interactions between cells and extracellular matrices under conditions that more closely resemble in vivo environments. This not only enhances the biological relevance of research outcomes but also provides a more precise testing platform for drug development [3].
Furthermore, the high-throughput capability of microfluidic chips enables the simultaneous multi-dimensional analysis of large sample volumes in a short time, greatly facilitating drug screening and personalized therapy. By integrating electrical analysis, real-time imaging, and high-throughput detection systems, microfluidic platforms allow for precise monitoring and quantitative analysis of cellular processes such as growth, differentiation, and migration, thereby improving experimental accuracy and reliability.
Compared to conventional methods, microfluidic chips not only significantly shorten research cycles but also reduce experimental costs by minimizing the need for animal testing and expensive reagents, greatly enhancing research efficiency and sustainability. Therefore, the application of microfluidic chips in biomedical research—particularly in drug screening, disease mechanism studies, and personalized medicine—holds significant promise and potential for future development.
Meanwhile, as an important indicator for revealing cellular functional states, disease mechanisms, and therapeutic responses, cell morphology analysis techniques are gradually expanding from traditional microscopic imaging to electrical characteristic identification. Electrical impedance spectroscopy (EIS), with its advantages of being non-invasive, label-free, and capable of real-time response, has been widely adopted in microfluidic platforms for identifying cell viability, membrane permeability, and apoptotic states.
In recent years, researchers have increasingly recognized that the design and arrangement of microelectrode arrays (MEAs) play a decisive role in the sensitivity and spatial resolution of cellular electrical property detection [4]. Particularly with the assistance of integrated circuit simulation tools like COMSOL Multiphysics, researchers can construct sophisticated cell–electrode coupling models to simulate potential distribution and impedance variations under different cellular states, thereby achieving more precise cell status identification [5,6].
Numerous studies have focused on electrode structure optimization [7,8], material selection, and frequency response characteristics of impedance signals. However, systematic exploration remains lacking regarding how to integrate microstructural electrode optimization, electrical modeling analysis, and microchannel environments to improve the accuracy of cell state discrimination and system integration. Therefore, comprehensive research encompassing microfluidic electrode array design, extraction of cellular electrical response characteristics, and COMSOL simulation optimization holds significant theoretical value and engineering practical significance.
2. Study of Cellular Morphology
In the simulation phase, COMSOL Multiphysics software with a 3D study setup was used, adding the transient electric currents (ec) physics interface to better capture the potential distribution in the cell–electrode coupling model. First, we created a working plane and drew a rectangle on it, which served as the contact part between the electrode and the cell. Then, another larger rectangle was drawn to the left of the smaller one to form the main part of the electrode. These two shapes were combined into a unified electrode structure. Next, we duplicated the electrode and placed it at a symmetric position, forming an electrode pair. After switching views, we began modeling the cell. Since the cell is a strain-tolerant sphere, but the contact area between the sphere and the electrode is too small, we now consider the situation where the cell grows on the electrode (the cell is set as a hemisphere, with the flat base of the hemisphere placed on the electrode). The cell was modeled as a sphere with a radius of 20 μm, and a larger rectangle was drawn below to perform a Boolean subtraction with the sphere.
Since cells require a liquid culture medium to survive, and the simulation domain must provide sufficient space to properly resolve potential distributions, an additional rectangular volume was created to immerse the cell–electrode model (representing the culture medium). This rectangular domain was designed to fully encompass both the upper surface of the cell and the electrode structure.
After completing the preliminary modeling, the materials for each domain need to be defined. First, all regions inside the rectangle, except for the cell, were set as water. The material data for the ec calculation should define conductivity and permittivity. The conductivity of water was set to 1.26 S/m, and the permittivity was set to 80.2. The permittivity of the cell membrane (Eps_memb) was set to 50, and its conductivity (Sig_memb) was set to 5 × 10⁻⁴ S/m. The permittivity of the cytoplasm (Eps_cyto) was set to 11, and its conductivity was set to 1.5 S/m, slightly higher than that of the surrounding solution. Now, it is necessary to set the domains covered by each electrical parameter in the ec model: the current conservation region was selected as the entire cell–electrode structure immersed in the culture medium; the electrical insulation region was selected for the portion excluding the electrode and cell; the initial value was set to 0 V for the entire structure; the first endpoint set the potential of one side of the electrode to 1 V; the contact impedance region was set at the cell surface; the distributed impedance region was set for the other side of the electrode.
Following model construction, the computational mesh was generated, and simulations were performed at a frequency of 10,000 Hz. The initial results are shown in Figure 1.
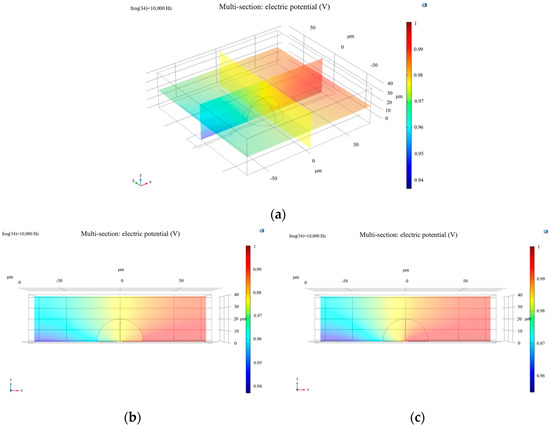
Figure 1.
(a) Oblique side view of the potential distribution of a living cell; (b) side view (XZ plane) of electric potential distribution in a living cell; (c) electric potential distribution of a dead cell from the side view along the XZ plane.
To simulate increased membrane permeability associated with cell death, the membrane conductivity parameter (Sig_memb) was adjusted to 1.2 S/m. The modified simulation produced the results presented in Figure 1.
From the images, it is evident that the electric potential around the cell exhibits a distinct gradient, particularly in the region of the cell membrane where the potential is relatively high. This is closely related to the electrical properties of the membrane. The cell membrane, composed of a phospholipid bilayer and functional membrane proteins, effectively impedes ion flow. As a result, healthy cells show pronounced variations in electric potential near the membrane region. In contrast, apoptotic or necrotic cells experience significant changes in potential distribution due to membrane structural degradation and inactivation of ion channels.
The double-layer capacitance effect between the cell surface and the electrolyte solution also plays a critical role in shaping the potential distribution [9]. Specifically, the cell membrane forms a charged interface—known as the electric double layer—in the electrolyte. Charge distribution varies between the compact layer and the diffuse layer. In the compact layer, negatively charged ions interact with the electrode surface to generate a strong electric field, while in the diffuse layer, the ion concentration gradient leads to a gradual weakening of the electric field. This double-layer effect not only influences local potential variations but also contributes to different electric field responses under varying cellular physiological states, such as proliferation, migration, or apoptosis, thereby affecting cell behavior. Changes in potential distribution are directly correlated with cellular physiological activity [10].
By adjusting the width of the rectangle to 40 μm and modifying the distance between the two electrodes, the results presented in Figure 2 were obtained. These figures show that, at the same frequency (10,000 Hz), increasing the distance between electrodes results in a less uniform potential distribution. Only when the frequency is increased does the cell membrane become disrupted again, and the potential distribution becomes more uniform. This indicates that larger electrode spacing or smaller contact areas between the electrodes and the cells reduce the sensitivity of experimental results. In other words, in microfluidic chips, the larger the electrode coverage area over the cell, the more uniform the potential distribution becomes. This finding is particularly valuable for studies of cell morphology and activity. To improve the accuracy of cell activity assessment, appropriately adjusting the electrode spacing in microelectrode design is recommended—ensuring the electric field is neither too weak to detect meaningful signals, nor too strong to disrupt cell behavior. By optimizing electrode layout and material selection, the effect of the electric field on the cell membrane can be enhanced, allowing for more precise monitoring of the cell’s electrical characteristics, particularly in distinguishing between healthy and non-living cells.
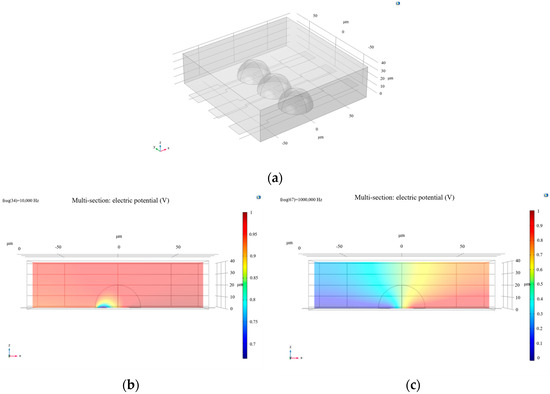
Figure 2.
(a) Modeling of cell-microelectrode arrays; (b) side view (XZ plane) of the electric potential distribution with increased electrode spacing; (c) the electric potential distribution upon membrane breakdown at a frequency of 1 × 10⁶ Hz.
Building upon the earlier simulation, one cell–electrode coupling unit was replicated and aligned side by side to model a basic microelectrode array.
At the same frequency of 10,000 Hz, the calculated results are shown in Figure 2. It can be observed that the electric potential distribution across the electrode array with living cells does not exhibit a significant gradient, indicating that the cell membranes were not disrupted at this frequency. In contrast, for a single living cell at the same frequency, the potential distribution displays a clear gradient, suggesting that 10,000 Hz is sufficient to disrupt the membrane of an individual cell.
Next, the frequency parameter was set to 61,359 Hz, and the resulting electric potential distribution—also shown in Figure 3—indicates that the cell membranes are at the threshold of breakdown. This further demonstrates that cells on an electrode array require a higher frequency to be disrupted. Therefore, it becomes necessary to introduce a systematic Bode plot analysis to investigate the frequency response of the system.
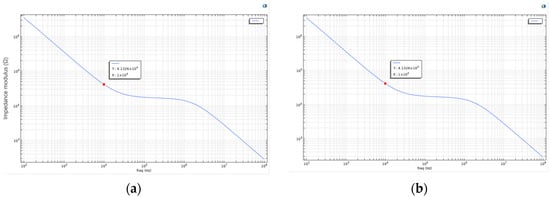
Figure 3.
(a) Bode plot of the living cell array described above; (b) the parameters were further adjusted by setting Sig_memb (the membrane conductivity) to 1.2 to simulate cell death. The recalculated Bode plot is shown in this figure.
As shown in Figure 3, this is the Bode plot of the aforementioned living cell array system. The plot reveals that at lower frequencies, the impedance of the cell membrane is significantly higher, likely due to the blocking effect of membrane proteins and the phospholipid bilayer structure. As the frequency increases, the system’s impedance gradually decreases. This suggests that the cell membrane exhibits capacitive behavior at low frequencies, while at higher frequencies, current more readily bypasses the capacitive characteristics of the membrane and penetrates it. In the case of apoptotic or dead cells, the structural integrity of the membrane is compromised, resulting in reduced impedance and increased current conductivity. Therefore, the frequency-dependent response reflected in the Bode plot can indicate changes in membrane permeability. In other words, by analyzing impedance variation across frequencies, Bode plots can be used to distinguish between healthy and apoptotic or necrotic cells.
To simulate cell death, the membrane conductivity parameter Sig_memb was further modified to 1.2. The recalculated result is shown in Figure 3. The two Bode plots show no significant difference in general frequency response. However, at specific frequency points (e.g., 61,359 Hz), the plot reveals a critical interaction point between the electrode and the cell membrane. At this point, a balance is reached between the electrode’s influence and the bioelectrical properties of the cell. This frequency may also serve as an indicator of changes in membrane permeability, suggesting the onset of irreversible membrane damage or alteration.
Overall, the introduction of the Bode plot as an electrical analysis tool in this study holds significant theoretical and engineering value. By displaying the magnitude and phase of impedance across varying frequencies, the Bode plot visually reveals the frequency response characteristics of the cell–electrode coupling system, providing strong support for a deeper understanding of the electrical model. In microfluidic chip platforms, the physiological states of cells (e.g., healthy, apoptotic, or necrotic) typically result in changes to membrane conductivity and dielectric properties, which in turn affect the system’s impedance characteristics across the frequency spectrum. The Bode plot, as a highly sensitive and high-resolution tool, can effectively identify these frequency-dependent electrical changes.
In summary, the use of Bode plots in this study is crucial for characterizing the frequency response of cellular electrical behavior. By presenting impedance magnitude and phase across frequencies, Bode plots not only depict the capacitive features of cell membranes with accuracy, but also dynamically reflect how physiological changes influence electrical parameters. Simulation results indicate that healthy cells exhibit high impedance at low frequencies due to intact membrane structures, where the phospholipid bilayer impedes current flow, forming a typical capacitive profile. At high frequencies, current is able to bypass or penetrate the membrane, leading to a significant decrease in system impedance. When cells undergo apoptosis or necrosis, membrane structure is disrupted, conductivity increases, and overall impedance decreases.
3. Construction of Microfluidic Channels
We continued using COMSOL Multiphysics software, with the research object set to transient EC (electrochemistry). The plan involves compressing cells and placing them within the channel to calculate the current density modulus in the microfluidic channel [11].
First, a rectangular union was drawn on a plane as the basic shape of the channel. Then, the extrusion function was used to stretch this union upward by 2 μm, constructing it into a three-dimensional channel, as shown in Figure 4.
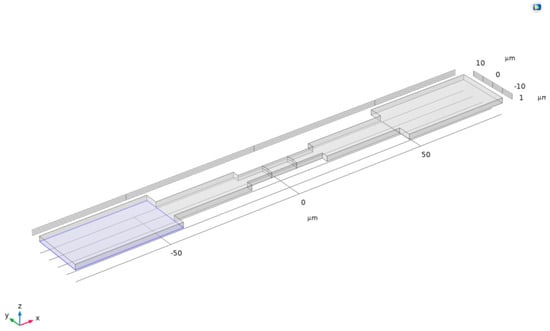
Figure 4.
Three-dimensional channel.
Using the same cell parameters for simulation, the frequency was set to 10,000 Hz, and the calculated current surface density modulus distribution is shown in Figure 5a. From the image, it can be observed that the current density distribution is significantly non-uniform across three distinct regions of the microchannel. The highest current density occurs in the central electrode region of the channel, likely due to the strong current generated by the interaction between the channel and cells. In contrast, the blue regions near both ends of the channel indicate that the current in the fluid is obstructed or dispersed in these wider areas.
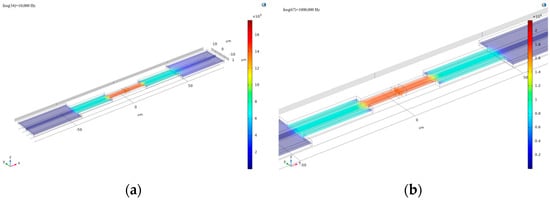
Figure 5.
(a) The current surface density modulus distribution obtained by setting the frequency to 10,000 Hz for computation; (b) the resulting plot obtained by increasing the frequency to 1 × 10⁶ Hz in the simulation.
At the interface, the current surface density exhibits a transitional gradient, which may be related to the selected frequency. To investigate further, the frequency was increased to 1 × 10⁶ Hz, yielding the results shown in Figure 5b. Analysis of this image reveals that at higher frequencies, the gradient of current surface density at the interface significantly decreases, and the transitional region nearly disappears. The influence of frequency on current density distribution may stem from the capacitive effect of the cell membrane within the microchannel. Therefore, studying the frequency characteristics (Bode plot) of the microchannel is particularly important [12].
As shown in Figure 6, in the low-frequency region (<104 Hz), the system exhibits high impedance magnitude, indicating significant barrier effects of cell membranes against current flow. Within the frequency range of 100 Hz to 10,000 Hz, healthy cells demonstrate distinct capacitive and resistive characteristics due to their intact membrane structure and dense phospholipid bilayer, resulting in strong current suppression effects. The high impedance in this frequency band primarily stems from the capacitive energy storage of cell membranes, which hinders current passage and demonstrates the membrane’s remarkable regulatory capability over electrical signals.
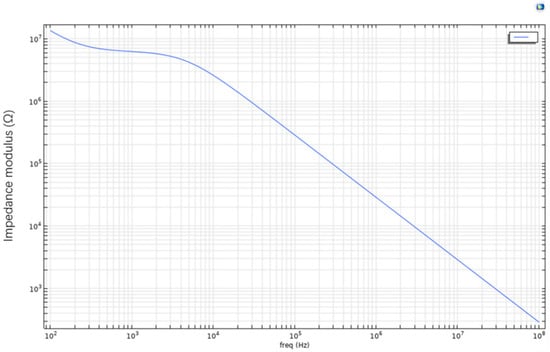
Figure 6.
Microchannel Bode plot.
However, as frequency progressively increases, particularly in the high-frequency range exceeding 106 Hz, the Bode plot shows a clear decreasing trend in impedance magnitude with a stabilized slope. This variation indicates that high-frequency electrical signals enable stronger current penetration, overcoming the dielectric barrier of cell membranes. Consequently, the capacitive effect of cell membranes gradually diminishes, and the system’s overall impedance approaches purely resistive characteristics. This frequency-dependent impedance variation reveals the response mechanism of cell membrane structure in electric fields: primarily capacitive behavior at low frequencies transitioning to breakdown or bypass at high frequencies, reflecting the system’s shift from energy-storage to energy-dissipation mode.
Further analysis of the Bode plot’s slope variation demonstrates its high sensitivity to the electrical state of cell membranes across different frequency bands. Healthy cells, with lower membrane permeability, exhibit steeper slope variations in the frequency domain. In contrast, apoptotic or necrotic cells, due to membrane structural damage, allow current penetration at lower frequencies, resulting in overall lower impedance magnitudes and less pronounced slope variations. Therefore, quantitative analysis of impedance slope variations across frequency bands in the Bode plot serves as a crucial criterion for assessing cell viability.
4. Conclusions
This study focuses on the relationship between the microelectrode array structure and the electrophysiological characteristics of cells on a microfluidic chip platform. Using the COMSOL Multiphysics simulation software, a cell–electrode coupling model encompassing the cell membrane, electrode structure, and the cultured microenvironment was constructed. This model not only simulates the electric potential distribution of cells under the influence of an electric field, but also reflects the impact of electrode design parameters on signal detection sensitivity. Through systematic simulations and parameter comparisons, this study reveals the quantitative relationship between cell membrane permeability and impedance values: healthy cells, with their intact phospholipid bilayer structure and significant membrane capacitance, maintain high impedance values, whereas apoptotic or necrotic cells, due to membrane structure degradation and ion leakage, exhibit a significant decrease in impedance. This change not only has clear biophysical significance but also provides a reliable basis for non-invasive identification of cell status.
Regarding the microelectrode structure, the research shows that the contact area between the electrode and the cell directly affects the local electric field distribution, thereby influencing the overall signal stability and detection resolution of the system. The larger the contact area, the more uniform the electric field, the clearer the signal, and the smaller the noise interference, which helps to improve the accuracy and robustness of the microelectrode array in multi-cell synchronous detection. Based on the frequency-domain response signals obtained from the electrode array, the study further plotted and analyzed the impedance spectrum’s Bode Plot, revealing significant differences in the capacitive behavior of the cell membrane and the current conduction path at different frequencies. At low frequencies, healthy cells exhibit obvious capacitive impedance characteristics, while at high frequencies, due to current bypassing or breaking through the cell membrane, the system’s impedance approaches a resistive nature. This frequency-dependent response characteristic provides a clear theoretical framework and judgment criterion for cell physiological state recognition based on impedance spectra [13].
In conclusion, this project has developed a system for cell morphology and electrophysiological characterization and analysis, which is applicable to microfluidic platforms. This system enables real-time evaluation of cell membrane impedance characteristics, non-invasive identification of cell states (such as health, apoptosis, and necrosis), and has good scalability and platform integration potential. In future applications, the research outcomes are expected to serve critical areas such as high-throughput cell screening, personalized drug response evaluation, and tissue engineering state monitoring. Furthermore, by integrating artificial intelligence algorithms and signal pattern recognition technologies, this platform could be further developed into a cellular electrophysiological “fingerprint recognition” system, providing technical support for remote medical care, instant diagnostics, and bioinformatics analysis.
Author Contributions
Conceptualization, J.W. and T.X.; methodology, J.W.; software, J.W. and T.X.; validation, T.X.; formal analysis, J.W.; investigation, J.W.; data curation, J.W.; writing—original draft preparation, J.W.; writing—review and editing, T.X.; supervision, T.X. All authors have read and agreed to the published version of the manuscript.
Funding
This research received no external funding.
Institutional Review Board Statement
Not applicable.
Informed Consent Statement
Not applicable.
Data Availability Statement
No new data were created or analyzed in this study. Data sharing is not applicable to this article.
Acknowledgments
This research is supported by the National Center for Translational Medicine (Shanghai), Shanghai University Branch, under the general program (Ref. SUITM-202414).
Conflicts of Interest
The authors declare no conflicts of interest.
References
- Ocvirk, G.; Verpoorte, E.; Manz, A.; Widmer, H.M. Integration of a micro liquid chromatograph onto a silicon chip. In Proceedings of the International Solid-State Sensors and Actuators Conference—TRANSDUCERS ’95, Stockholm, Sweden, 25–29 June 1995; Volume 1, pp. 756–759. [Google Scholar] [CrossRef]
- Xu, X.; Chen, C.Y.; Wen, Z.; Young, O.M.; Felix, B.M.; Bandyopadhyay, B.C.; Bentley, W.E.; Sochol, R.D. 3D-Microprinted PDMS-Based Microfluidic Vessels for Organ-on-a-Chip Applications. In Proceedings of the 2024 IEEE 37th International Conference on Micro Electro Mechanical Systems (MEMS), Austin, TX, USA, 21–25 January 2024; pp. 221–224. [Google Scholar] [CrossRef]
- Hsieh, C.C.; Huang, S.B.; Wu, P.C.; Shieh, D.B.; Lee, G.B. A microfluidic cell culture platform for real-time cellular imaging. Biomed. Microdevices 2009, 11, 903–913. [Google Scholar] [CrossRef] [PubMed]
- Lin, S.; Feng, D.; Han, X.; Li, L.; Lin, Y.; Gao, H. Microfluidic platform for omics analysis on single cells with diverse morphology and size: A review. Anal. Chim. Acta 2024, 1294, 342217. [Google Scholar] [CrossRef]
- Bhatia, S.; Ingber, D. Microfluidic organs-on-chips. Nat. Biotechnol. 2014, 32, 760–772. [Google Scholar] [CrossRef]
- Zhao, Q.; Cole, T.; Zhang, Y.; Tang, S.-Y. Mechanical Strain-Enabled Reconstitution of Dynamic Environment in Organ-on-a-Chip Platforms: A Review. Micromachines 2021, 12, 765. [Google Scholar] [CrossRef] [PubMed]
- Huang, D.; Liu, T.; Liao, J.; Maharjan, S.; Xie, X.; Pérez, M.; Anaya, I.; Wang, S.; Tirado Mayer, A.; Kang, Z.; et al. Reversed-engineered human alveolar lung-on-a-chip model. Proc. Natl. Acad. Sci. USA 2021, 118, e2016146118. [Google Scholar] [CrossRef]
- Caplin, J.D.; Granados, N.G.; James, M.R.; Montazami, R.; Hashemi, N. Microfluidic Organ-on-a-Chip Technology for Advancement of Drug Development and Toxicology. Adv. Healthc. Mater. 2015, 4, 1426–1450. [Google Scholar] [CrossRef] [PubMed]
- Wang, T.; Lin, C.; Ye, F.; Fang, Y.; Li, J.; Wang, X. MEA with double-layered catalyst cathode to mitigate methanol crossover in DMFC. Electrochem. Commun. 2008, 10, 1261–1263. [Google Scholar] [CrossRef]
- Giaever, I.; Keese, C.R. Micromotion of mammalian cells measured electrically. Proc. Natl. Acad. Sci. USA 1991, 88, 7896–7900. [Google Scholar] [CrossRef]
- Xu, T.; Lizarralde-Iragorri, M.A.; Roman, J.; Ghasemi, R.; Lefevre, J.P.; Martincic, E.; Brousse, V.; Français, O.; El Nemer, W.; Le Pioufle, B. Characterization of red blood cell microcirculatory parameters using a bioimpedance microfluidic device. Sci. Rep. 2020, 10, 9869. [Google Scholar] [CrossRef]
- Yeon, C.-O.; Kim, J.-W.; Park, M.-H.; Jang, Y.-J.; Lim, C.-Y.; Moon, G.-W. Bode plot and impedance asymptotes for light-load regulation of LLC series resonant converter. In Proceedings of the 2016 IEEE 8th International Power Electronics and Motion Control Conference (IPEMC-ECCE Asia), Hefei, China, 22–26 May 2016; pp. 3191–3197. [Google Scholar] [CrossRef]
- Xu, T.; Ihida, S.; Toshiyoshi, H.; Tixier-Mita, A. Instrumentation development for 2D bioimpedance map with a Thin-Film-Transistor active matrix device. In Proceedings of the 2022 Symposium on Design, Test, Integration and Packaging of MEMS/MOEMS (DTIP), Pont-a-Mousson, France, 11–13 July 2022. [Google Scholar] [CrossRef]


Disclaimer/Publisher’s Note: The statements, opinions and data contained in all publications are solely those of the individual author(s) and contributor(s) and not of MDPI and/or the editor(s). MDPI and/or the editor(s) disclaim responsibility for any injury to people or property resulting from any ideas, methods, instructions or products referred to in the content. |
© 2025 by the authors. Licensee MDPI, Basel, Switzerland. This article is an open access article distributed under the terms and conditions of the Creative Commons Attribution (CC BY) license (https://creativecommons.org/licenses/by/4.0/).