Abstract
Introduction: Open-circuit cooling systems (OCCSs), integral to many industrial processes, often release blowdown water containing elevated concentrations of treatment chemicals. These discharges, if uncontrolled, pose substantial risks to aquatic ecosystems and human health. This study addresses the environmental implications of chemical emissions from OCCS blowdown through the development of a predictive model designed to estimate contaminant concentrations in receiving water bodies. Methods: The research employs a computational model based on mass-balance equations to simulate the dynamics of chemical emissions from blowdown water. It incorporates key operational variables, including flow rates, degradation rates, and evaporation characteristics. The model evaluates two chemical dosing strategies, continuous and fractional, and their resultant pollutant dispersal patterns in river systems. Validation was performed using empirical data from sulfuric acid (H2SO4) applications at a nuclear power plant between 2015 and 2022. Results: The model demonstrated strong agreement with observed sulfate ion concentrations in the receiving water body, confirming its predictive reliability. Continuous dosing resulted in stable levels of pollutants, while fractional dosing caused temporary peaks that did not exceed regulatory limits. Conclusion: The modeling of blowdown water reveals important implications for river water quality and suggests that current wastewater management practices may be insufficient, benefiting from the integration of predictive modeling for blowdown discharges in industrial settings.
1. Introduction
In industrial open-circuit cooling systems (OCCS), blowdown refers to the discharge of water used for heat exchange, specifically to prevent the buildup of minerals, salts, and other impurities that accumulate during the recirculating process [1]. Blowdown is an essential operation for maintaining system efficiency; however, it also represents a significant environmental concern due to the potential release of chemicals used in cooling water treatments [2]. The emission of chemicals from blowdown water into aquatic environments poses risks to local ecosystems, necessitating precise modeling to predict and mitigate their environmental impact [3,4]. The purpose of this study was to design a model that would allow predicting chemical concentrations in water bodies after discharging blowdown water from OCCS. The main focus was on determining the key parameters that influence the formation of chemical concentrations in the natural environment [5,6]. This study is aimed at improving approaches to environmental risk management and optimizing industrial processes with regard to environmental requirements. The novelty of this work lies in applying and validating a mass balance model for blowdown discharges using a long-term dataset (2015–2022) from a Ukrainian nuclear power plant, with a focus on continuous vs. fractional dosing regimes. The study is relevant because in recent decades there has been a significant increase in production capacity, accompanied by an increase in the use of OCCS and, accordingly, an increase in the volume of wastewater that requires treatment and control. The proposed model may be useful for enterprises, scientific institutions, and regulatory authorities in the decision-making process to optimize discharges and reduce the impact on the aquatic environment. Although mass-balance frameworks for estimating chemical emissions from cooling-tower blowdown are well established, existing models typically rely on idealized or steady-state operating assumptions and seldom incorporate real, long-term operational variability. The novelty of the present model lies in three aspects. First, it integrates multi-year, high-resolution operational data from an industrial open-circuit cooling system, allowing the model to capture the seasonal and hydrological variability that strongly governs chemical dispersion in receiving waters. Second, the model explicitly compares continuous and fractional dosing regimes using the same computational framework, providing a quantitative assessment of how different treatment strategies affect downstream concentrations—an aspect rarely addressed in previous studies. Third, the model is validated against measured river water chemistry over an eight-year period, producing statistically robust performance indicators rather than relying solely on qualitative curve matching. Together, these elements extend conventional blowdown emission modeling beyond steady-state assumptions and demonstrate its applicability for real-world compliance assessment and operational decision-making.
Current studies on the environmental impact of OCCS focus on the problem of the chemical composition of blowdown water and its distribution in river ecosystems [7,8,9]. Particular importance has been given to chemicals that are often present in OCCS and have a long-term impact on aquatic life due to their toxicity and resistance to degradation. The EU legal framework sets strict requirements for the control of wastewater discharged into the environment, in particular under the Water Framework Directive (WFD) [10] and Directive 76/464/EEC [11], which relate to hazardous substances whose pollution must be reduced or eliminated. Therefore, there is a need to limit the impact of chemical discharges on aquatic ecosystems and ensure safe conditions for human activities related to the use of surface water. Moreover, given the diversity of chemicals used in OCCS, it is difficult to predict their behavior in the aquatic environment after discharge, especially given the variable parameters such as degradation rates, volatility and concentrations of substances, which depend on the dosing methods [12,13]. Therefore, modeling the distribution of chemicals in water is a key step towards accurately assessing the environmental impact of OCCS.
Thus, modeling the distribution of chemicals from blowdown water is an important step towards reducing the anthropogenic impact on water resources. The proposed methodology has the prospect of widespread application, as it takes into account both the physical and chemical parameters of substances and the design features of OCCS, which will allow obtaining more accurate results for risk management and preservation of aquatic ecosystems. In particular, the effects of continuous versus fractional dosing on the magnitude and temporal dynamics of chemical loads are rarely evaluated using long-term field observations. This study addresses these gaps by developing and validating a predictive model using multi-year operational and monitoring data, providing an evidence-based assessment of blowdown emissions and their environmental relevance.
2. Materials and Methods
This study employs a computational modeling approach and comparison method to evaluate the environmental impact of chemical discharges from OCCS on a water body. The computational model predicts chemical concentrations in blowdown water using mass balance equations, factoring in dosing methods, degradation rates, volatilization, and system design specifics to ensure accurate concentration estimates under varied operational conditions. The mass balance approach calculates chemical changes by balancing inflows, outflows, and any chemical reactions within the system, including degradation and evaporation effects. Two dosing methods are analyzed: continuous dosing, which maintains stable chemical concentrations, and fractional dosing, which results in peak concentrations that gradually decline. Continuous dosing uses a formula that includes the makeup water flow rate, blowdown flow rate, recirculation rate, and degradation rate constant to achieve steady-state concentration. Fractional dosing involves larger, infrequent doses that lead to temporary peaks in chemical concentration. To assess chemical dilution and distribution in the receiving river, the model incorporates river flow rate, enabling predictions of pollutant spread post-discharge. In OCCS, heated water from industrial processes transfers its excess thermal energy to cooling water in a heat exchanger, which is then directed to a cooling tower (Figure 1). Inside the cooling tower, the water is cooled primarily through evaporation, releasing both heat and water vapor into the atmosphere. Due to constant losses from evaporation, makeup water is added to the system to replenish it. Over time, dissolved minerals and chemical concentrations build up in the recirculating water, necessitating the controlled discharge of a portion of this water as blowdown.
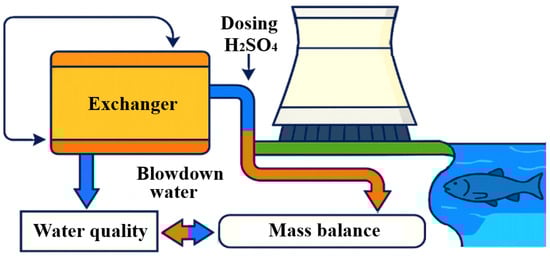
Figure 1.
Schematic diagram of an OCCS and general scheme of this study.
The blowdown water, containing elevated levels of dissolved minerals and treatment chemicals, is subsequently released into natural water bodies, such as rivers. This discharge process serves as a primary pathway for cooling water chemical emissions into the environment, where the introduction of residual chemicals and pollutants can adversely affect aquatic ecosystems. Proper management of blowdown and strict control over chemical use are thus essential to minimizing environmental impact and ensuring compliance with regulatory water quality standards for receiving rivers. For an OCCS, the discharge to surface waters from the blowdown water discharge is calculated on the basis of the mass balance of matter in the cooling water system [14]. The total mass balance of a substance is defined as the change in mass per unit time (dm/dt) in a system equal to the difference between the input (min) and output mass fluxes (mout) plus the amount formed or removed by a chemical reaction (mreact) [15]. When a chemical reacts, for example through degradation, mreact should be subtracted in the mass balance, which is usually achieved by adding a minus sign to the reduction rate Constant (1).
The concentration of the substance in the blowdown water (Cbasin) can be simply obtained from the mass balance by dividing the mass by the total volume of water in the OCCS. The inlet and outlet mass of the media determine flow rate and the concentration of the substance in the specific flow. For an open recirculating cooling tower, two different types of situations can be recognized. The first is the situation where chemicals are continuously dosed into the system through the makeup water. The second is fractional dosing, the addition of a relatively large amount of a substance to the system in a short time, resulting in a peak concentration. Constant dosing assumes that the inlet concentration and all other conditions for a constant OCCS are maintained [16]. Once the concentration to be maintained in the system is known, it can be used directly to calculate the blowdown water emissions using Formula (2). For a fractional dose, a relatively large amount of a chemical is dosed into a system over a short period to cause a peak concentration. The concentration in the system will gradually decrease from this initial peak concentration as no more chemical enters the system. The average concentration during a time is calculated according to the following Equation (3). The concentration of the chemical (Criv) in the river after the discharge is calculated using Formula (4) [17].
where: Qm—is the makeup water flow rate, m3·s−1; Qb—is the blowdown flow rate, m3·s−1; Qc—is the water recirculation flow rate, m3·s−1; Cm—is the concentration in the make-up water, kg·m−3; Vbasin—is the water volume in the cooling water basin, m3; Fv—is the fraction of the active ingredient volatilised from the cooling water; kdeg—is the first-order degradation rate constant, s−1; Cp—is the concentration of the active ingredient in the system at dosing, kg·m−3; ∆t—is the system average temperature of the water in the OCCS, K; Ksyst—is the dimensionless Henry’s law constant (often used as such in environmental fate modelling), m3water·m−3air; and Griv—is the river flow rate, m3·s−1.
dm/dt = min − mout + mreact
Cbasin = Cm∙Qm/(Qb + Qc∙Fv + kdeg∙Vbasin)
Cbasin = Cp∙1 − e−Ksyst∙∆t/Ksyst∙∆t
Criv = Cbasin∙Qb/Griv
To evaluate the predictive accuracy of the model, a set of standard statistical performance metrics was calculated using paired measured and simulated SO42− concentrations for both dosing regimes. The metrics included the root mean square error (RMSE), mean absolute error (MAE), mean absolute percentage error (MAPE), and the coefficient of determination (R2) [18,19,20]. These indicators quantify different aspects of model performance and collectively provide a comprehensive assessment of the agreement between measured and predicted concentrations. The RMSE measures the square root of the average squared deviation between predicted and observed values, emphasizing larger errors. The MAE quantifies the average absolute deviation between predicted and measured concentrations. The MAPE measures the average absolute error relative to observed values and is expressed as a percentage. MAPE provides a normalized measure of prediction accuracy, facilitating comparison across datasets with different concentration ranges. R2 evaluates the proportion of variance in the measured data explained by the model. Together, these metrics allow a rigorous assessment of the model’s predictive performance by quantifying average deviations (MAE and MAPE), sensitivity to large discrepancies (RMSE), and overall goodness of fit (R2). Their combined interpretation ensures a robust evaluation of the model under both constant and fractional dosing conditions.
The comparison method evaluates the model’s compliance with regulatory standards by comparing calculated concentrations against legal limits, identifying risks of exceedance and informing adjustments to reduce environmental impact. Validation was performed using sulfuric acid (H2SO4) concentrations in OCCS at the Rivne Nuclear Power Plant (NPP). Measurements from continuous dosing (2015–2016) and fractional dosing (2017–2022) aligned closely with the model’s predictions, with no exceedances of regulatory water quality limits observed.
3. Results and Discussion
In OCCS, various chemicals are used to maintain water quality, prevent scaling, control biological growth, and inhibit corrosion within the infrastructure (Table 1). These additives are essential for efficient OCCS operation but may be discharged into nearby rivers through blowdown water, posing environmental risks [21,22]. Blowdown water, released periodically, contains residual treatment chemicals that must be properly managed to reduce ecological impacts.

Table 1.
Primary chemicals used in an OCCS, focusing on their specific applications and potential environmental impacts when released through blowdown.
Chlorine- and bromine-based biocides are commonly applied in OCCS to control microbial activity; however, their by-products, including bromides and other disinfection residues, may persist in blowdown water. In addition to biocides, dispersants such as polyacrylic acid are used to limit particulate accumulation and enhance hydraulic performance within cooling towers, though they also contribute to increased organic and chemical loading in blowdown water [23]. Corrosion by-products, including metals such as copper (Cu), zinc (Zn), and iron (Fe), accumulate in OCCS due to material degradation and are frequently detected in blowdown water. Upon discharge, these metals pose toxic risks to aquatic organisms, may disrupt biological functions, and can bioaccumulate in the food chain. Parameters such as pH, total suspended solids (TSS), and chemical oxygen demand (COD) are routinely monitored to assess blowdown water quality and ensure compliance with environmental standards, as deviations may indicate elevated chemical concentrations requiring corrective action [24]. The discharge of blowdown water from OCCS presents significant concerns regarding chemical emissions and their impacts on river water quality, as elevated levels of residual treatment chemicals may cause environmental degradation and harm aquatic ecosystems.
In order to address the deterioration of river water quality resulting from industrial activities, including OCCS blowdown, advanced treatment methods must be implemented to mitigate the effects of the contaminants present [25,26]. Regulatory frameworks vary across countries but generally establish two categories of limits: wastewater discharge limits, which specify maximum contaminant concentrations prior to discharge, and water quality objectives, which define acceptable concentrations downstream of the discharge point after mixing with river water. In the EU, water pollution control relies on directives such as the Water Framework Directive (WFD) [10], which establishes national standards for water quality objectives by defining limit values that must not be exceeded downstream of wastewater discharges [27,28]. These regulatory limits aim to reduce environmental impacts, safeguard aquatic organisms, and preserve overall water quality [29,30]. Table 2 presents examples of these standards in several European countries, including Ukraine.
The main indicators of water quality comprise pH, ammonia (N-NH3), NO3−, PO43−, SO42−, and chloride (Cl−) ions, along with biochemical oxygen demand (BOD5), COD, and total organic carbon (TOC). The pH requirements vary considerably: while France, Portugal, and Spain permit a range of pH values from 5.0 to 9.0, Switzerland emphasizes maintaining stability with no pH changes in river water, and Ukraine limits pH levels to between 6.5 and 8.5 (Table 2). Concentrations of N-NH3 are strictly controlled, particularly in Switzerland (0.2 mg/L) and France (1.0 mg/L). Similarly, concentrations of NO3− are limited within 5.0 to 50.0 mg/L in different countries, preventing eutrophication in water bodies [31,32,33].
Table 2.
Quality limits for river water after discharge of chemicals.
Table 2.
Quality limits for river water after discharge of chemicals.
| Control Parameter | France [34] (Green Quality Class) | Switzerland [35] | Portugal [36] | Spain [37] | Ukraine [38] |
|---|---|---|---|---|---|
| pH, units | 6.0–9.0 | no change | 5.0–9.0 | 5.5–9.0 | 6.5–8.5 |
| N-NH3, mg/L | 1.0 | 0.2 | 1.0 | - | - |
| NO3−, mg/L | 10.0 | 5.6 | 5.0 | 50.0 | - |
| BOD5, mg/L | 3.0 | 2.0–4.0 | 5.0 | 7.0 | - |
| COD, mg/L | 30 | - | - | 30 | - |
| TOC, mg/L | 7.0 | 1.0–4.0 | - | - | - |
| SO42−, mg/L | - | - | 250 | 250 | - |
| Cl−, mg/L | 100 | 100 | 250 | 200 | - |
| PO43−, mg/L | - | - | 1.0 | 0.4 | - |
| TSS, mg/L | 25 | 20 | - | 25 | no increase > 0.75 |
| Dissolved oxygen, mg/L | ≥9 for 50% of monthly; ≥7 for 100% results | no change | - | - | not less than 4.0 |
This model of cooling water chemical emissions to river water via blowdown was tested for the dosing of the chemical H2SO4 for the corrective treatment of OCCS of the Rivne nuclear power plant, where the measured values in the Styr River for a constant dose of H2SO4 (for 2015–2016) and fractional dose of H2SO4 (for 2017–2022) were compared with the calculated values for a constant dose using formula (2) and fractional dose using Formula (3). The results show that the data obtained are comparable and do not exceed the quality limits for river water after chemical discharge (Figure 2). The study covers two dosing regimes: constant dosing in 2015–2016 and fractional (non-constant) dosing in 2017–2022. Both measured and calculated SO42− concentrations for each regime are presented, which indicates the high accuracy of the model (calculation Formulas (2) and (3)). The correspondence was strongest during spring and autumn, while larger deviations appeared in summer months, most likely due to higher evaporation rates and changes in river hydrology. Importantly, none of the measured or predicted values exceeded the regulatory limit of 250 mg/L, confirming the model’s reliability for compliance assessment. Continuous dosing maintained relatively stable sulfate concentrations close to the long-term mean, whereas fractional dosing resulted in transient peaks. Although these peaks were several times higher than background values, they declined rapidly and remained below the regulatory threshold.
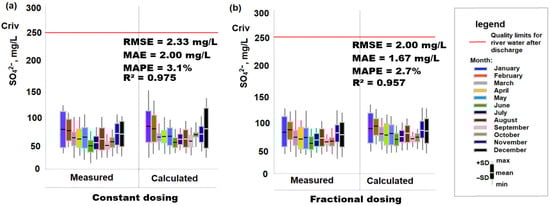
Figure 2.
Measured and calculated SO42− concentrations in river water following cooling water discharge under constant (a) and fractional (b) H2SO4 dosing regimes.
To quantitatively assess the performance of the predictive model, several statistical indicators were calculated using the measured and simulated SO42− concentrations for both dosing regimes (Figure 2). For the constant dosing period (2015–2016), the model demonstrated excellent agreement with observations, yielding an RMSE of 2.33 mg/L, MAE of 2.00 mg/L, and MAPE of 3.1%. cR2 = 0.975 indicates that 97.5% of the variability in the measured sulfate concentrations is explained by the model. Similarly, for the fractional dosing period (2017–2022), the model maintained high predictive accuracy, with an RMSE of 2.00 mg/L, MAE of 1.67 mg/L, and MAPE of 2.7%. The corresponding R2 value of 0.957 confirms a strong linear relationship between the measured and predicted values. These performance metrics collectively demonstrate that the mass-balance-based modelling approach reliably reproduces both stable (continuous dosing) and dynamic (fractional dosing) concentration patterns in the receiving river, supporting its applicability for compliance assessment and operational decision-making.
Understanding the ecological and human health risks associated with chemical discharges from OCCS is critical for developing effective environmental management strategies [39]. The compounded effects of these discharges, such as increased toxicity or altered nutrient profiles, pose potential threats to both wildlife and human populations, especially those relying on affected water bodies for drinking or recreational purposes. In particular, bioaccumulation of hazardous substances in aquatic organisms can lead to adverse health effects [40], including ecosystem functional degradation and risks to humans [16]. Furthermore, existing assessment systems often fail to fully reflect the complexity of interactions between chemicals and biological systems, showing the need to account for combined chemical interactions and variable dosing conditions in future models that account for varying chemical mixtures and their long-term ecological implications (Figure 3). Through the comprehensive analysis of chemical emissions resulting from the blowdown processes in OCCS, the model clarifies how dosing strategies influence SO42− concentrations in receiving river water. Future research should prioritize longitudinal studies to assess the cumulative effects of these emissions over time, as well as the development of advanced modeling techniques to better predict the dispersion of pollutants.
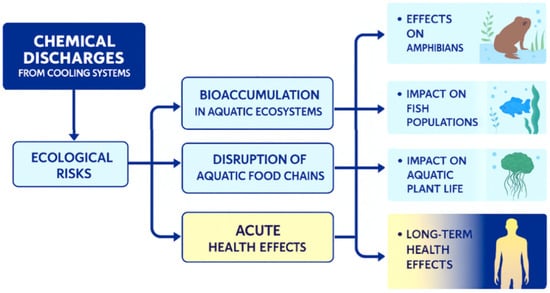
Figure 3.
Characterization of the effects of cooling water chemical emissions on river water.
The validated model, incorporating parameters such as dosing regimes, degradation rates, and system design, accurately predicts the concentration and spread of contaminants, demonstrating that discharge concentrations remain within regulatory limits. Constant and fractional dosing methods present distinct impacts on aquatic environments, with continuous dosing contributing to stable pollutant levels, while fractional dosing introduces peaks that may temporarily exceed recommended limits [41]. Integration of advanced membrane-based water treatment concepts and sustainable circular economy approaches enhances the model’s capacity to simulate pollutant removal and transformation processes in cooling system blowdown water. Supported by empirical datasets on heavy metal pollution in freshwater ecosystems [42], the model provides a robust framework for assessing discharge dynamics, ensuring predictive reliability, and informing strategies to minimize ecological risks.
Beyond the direct implications of industrial discharges, the findings of this study align with broader research trends emphasizing the integration of advanced analytical tools in environmental and agroecological assessments. Recent studies highlight the importance of alternative methodological approaches in modern agroecological research, particularly those that enable multi-parameter evaluation of ecosystem responses to anthropogenic pressures. Likewise, geographic information systembased monitoring frameworks have proven essential for managing river basin conditions, allowing for spatial analysis of pollutant dispersion, identification of vulnerable zones, and long-term assessment of hydrological changes [43]. These tools complement predictive emission modeling by offering basin-scale context for interpreting chemical loads and their downstream impacts. Furthermore, investigations of the hydrophilic flora in river systems, such as those conducted in the Sluch River basin of Lowland Polissya, demonstrate that aquatic plant diversity and community dynamics are highly sensitive to fluctuations in water chemistry [44]. In addition to H2SO4, cooling water treatment involves a wide range of chemicals such as biocides, corrosion inhibitors, dispersants, and phosphonate-based additives, many of which exhibit substantially different environmental behavior compared to SO42−. These substances are characterized by diverse degradation kinetics, volatilization tendencies, and transformation pathways that can significantly influence their fate in receiving water bodies. Therefore, while the present study validates the model for SO42− formation following H2SO4 dosing, future work should adapt and extend the modelling framework to account for chemicals with non-conservative behavior and more complex degradation mechanisms. Incorporating substance-specific kinetic parameters and reaction pathways will improve the robustness and predictive capability of the model when applied to broader chemical groups used in OCCS operations.
4. Conclusions
The analysis presented in this study underscores the critical interplay between cooling water chemical emissions and effluent quality in OCCS. The modeling of blowdown water reveals significant implications for river water quality and highlights the urgent need for more effective wastewater management strategies within industrial contexts. Validation with measured SO42− concentrations confirmed the model’s accuracy, making it a valuable tool for guiding regulatory compliance and optimizing cooling water treatment practices. The results show that continuous dosing maintains relatively stable concentrations in river water, while fractional dosing produces short-term peaks that remain below the regulatory limit of 250 mg/L. These findings demonstrate that the model can be used to compare different dosing regimes and to optimize chemical treatment strategies in cooling systems. The practical application of the model lies in its potential use for operational planning and compliance monitoring, particularly for predicting discharge concentrations under varying hydrological conditions. However, the present validation was limited to H2SO4 dosing at a single site. Future studies should extend the model to other treatment chemicals and to different industrial facilities in order to assess its broader applicability.
Author Contributions
Conceptualization, P.K. and O.B.; methodology, P.K.; software, P.K. and O.B.; validation, P.K., O.B. and A.P.; formal analysis, P.K.; investigation, P.K.; resources, P.K. and O.B.; data curation, P.K., O.B. and O.M.; writing—original draft preparation, P.K., O.B., A.P. and O.M.; writing—review and editing, P.K., O.B., A.P. and O.M.; visualization, P.K.; supervision, P.K.; project administration, P.K.; funding acquisition, P.K. and O.B. All authors have read and agreed to the published version of the manuscript.
Funding
This research received no external funding.
Institutional Review Board Statement
Not applicable.
Informed Consent Statement
Not applicable.
Data Availability Statement
The raw data supporting the conclusions of this article will be made available by the authors on request.
Conflicts of Interest
The authors declare no conflicts of interest.
References
- Kuznietsov, P.; Biedunkova, O.; Trach, Y. Monitoring of Phosphorus Compounds in the Influence Zone Affected by Nuclear Power Plant Water Discharge in the Styr River (Western Ukraine): Case Study. Sustainability 2023, 15, 16316. [Google Scholar] [CrossRef]
- Soliman, M.; Eljack, F.; Kazi, M.K.; Almomani, F.; Ahmed, E.; El Jack, Z. Treatment Technologies for Cooling Water Blowdown: A Critical Review. Sustainability 2021, 14, 376. [Google Scholar] [CrossRef]
- Kuznietsov, P.M.; Biedunkova, O.O. Technological and Environmental Problems in the Stabilization Treatment of the Main Condenser Cooling Circuit by Sulfuric Acid. J. Eng. Sci. 2023, 10, H1–H8. [Google Scholar] [CrossRef]
- Burmana, A.D.; Yazdi, M.; Hasibuan, R. Loss prevention of cooling tower with an open loop system at cooling tower pipeline on a biodiesel plant: Analysis and safety implications. Int. J. Thermofluids 2025, 30, 101416. [Google Scholar] [CrossRef]
- Wiesner-Sękala, M.; Kończak, B. Assessment of the Impact of Industrial and Municipal Discharges on the Surface Water Body Status (Poland). Sustainability 2023, 15, 997. [Google Scholar] [CrossRef]
- Kałuża, T.; Laks, I.; Kanclerz, J.; Janicka-Kubiak, E.; Hämmerling, M.; Zaborowski, S. Hydrological Effects of the Planned Power Project and Protection of the Natura 2000 Areas: A Case Study of the Adamów Power Plant. Energies 2025, 18, 3079. [Google Scholar] [CrossRef]
- Wang, J.; Liang, C.; Zhang, Y.; Liu, Z.; Huo, Y.; Zhang, Z.; Huo, M. Impacts of reclaimed water recharge on waterborne viruses decay: Characteristics and influencing factors. J. Water Process Eng. 2025, 74, 107844. [Google Scholar] [CrossRef]
- Biedunkova, O.; Kuznietsov, P.; Pinchuk, O. Comprehensive Assessment of Scale Formation, Corrosion, and Biological Pollution in a Cooling Water Supply System. MethodsX 2025, 14, 103154. [Google Scholar] [CrossRef]
- Hamdhani, H.; Eppehimer, D.E.; Bogan, M.T. Release of Treated Effluent into Streams: A Global Review of Ecological Impacts with a Consideration of Its Potential Use for Environmental Flows. Freshw. Biol. 2020, 65, 1657–1670. [Google Scholar] [CrossRef]
- European Parliament and Council. Directive 2000/60/EC Establishing a Framework for Community Action in the Field of Water Policy. Off. J. Eur. Communities (OJ) 2000, 327, 1–73. Available online: https://eur-lex.europa.eu/eli/dir/2000/60/oj/eng (accessed on 1 October 2025).
- Council of the European Communities. Directive 76/464/EEC on Pollution Caused by Certain Dangerous Substances Discharged into the Aquatic Environment of the Community. Off. J. Eur. Communities (OJ) 1976, 129, 23–29. Available online: https://eur-lex.europa.eu/eli/dir/1976/464/oj/eng (accessed on 1 October 2025).
- Gomes, J.S.L.C. Water Treatments in Semi-Closed Cooling Circuits and Their Impact on the Quality of Effluents Discharged by CERN. CERN Technical Report. 2008. Available online: https://cds.cern.ch/record/1150124 (accessed on 1 October 2025).
- Kuznietsov, P.; Biedunkova, O. Experimental Tests of Biocidal Treatment for Cooling Water of Safety Systems at Rivne NPP Units. Nucl. Radiat. Saf. 2023, 1, 30–40. [Google Scholar] [CrossRef] [PubMed]
- Koptyuk, R.; Rokochinskiy, A.; Volk, P.; Turcheniuk, V.; Frolenkova, N.; Pinchuk, O.; Openko, I. Ecological efficiency evaluation of water regulation of drained land in changing climatic conditions. Ecol. Eng. Environ. Technol. 2023, 24, 210–216. [Google Scholar] [CrossRef] [PubMed]
- Bakker, J.; van Vlaardingen, P.L.A.; Smit, C.E. Environmental Emission Estimation of Cooling Water Biocides: Update of the Emission Scenario Document for Open Recirculating Cooling Towers. RIVM Report. 2024. Available online: http://hdl.handle.net/10029/627633 (accessed on 1 October 2025).
- Radchenko, A.; Trushliakov, E.; Kosowski, K.; Mikielewicz, D.; Radchenko, M. Innovative Turbine Intake Air Cooling Systems and Their Rational Designing. Energies 2020, 13, 6201. [Google Scholar] [CrossRef]
- Kuznietsov, P.; Tykhomyrov, A.; Biedunkova, O.; Zaitsev, S. Improvement of methods for controlling power oil of cooling tower recycling water supply units at Rivne nuclear power plant. Sci. Horiz. 2022, 12, 69–79. [Google Scholar] [CrossRef]
- Biedunkova, O.; Kuznietsov, P. Integration of water management in the assessment of the impact of heavy metals discharge from the power plant with mitigation strategies. Ecol. Indic. 2025, 175, 113618. [Google Scholar] [CrossRef]
- Hasan, I.A.; Yuce, M.I. Prediction of Potential Evapotranspiration via Machine Learning and Deep Learning for Sustainable Water Management in the Murat River Basin. Sustainability 2024, 16, 11077. [Google Scholar] [CrossRef]
- Alencar, G.M.R.d.; Fernandes, F.M.L.; Moura Duarte, R.; Melo, P.F.d.; Cardoso, A.A.; Gomes, H.P.; Villanueva, J.M.M. A Soft Sensor for Flow Estimation and Uncertainty Analysis Based on Artificial Intelligence: A Case Study of Water Supply Systems. Automation 2024, 5, 106–127. [Google Scholar] [CrossRef]
- Band, S.S.; Janizadeh, S.; Pal, S.C.; Chowdhuri, I.; Siabi, Z.; Norouzi, A.; Melesse, A.M.; Shokri, M.; Mosavi, A. Comparative Analysis of Artificial Intelligence Models for Accurate Estimation of Groundwater Nitrate Concentration. Sensors 2020, 20, 5763. [Google Scholar] [CrossRef]
- Abdelfattah, I.; El-Shamy, A.M. Review on the Escalating Imperative of Zero Liquid Discharge (ZLD) Technology for Sustainable Water Management and Environmental Resilience. J. Environ. Manag. 2024, 351, 119614. [Google Scholar] [CrossRef]
- Pacey, N.; Beadle, I.; Heaton, A.; Newsome, L. Chemical Discharges from Nuclear Power Stations: Historical Releases and Implications for Best Available Techniques; Environment Agency Report SC090012; Environment Agency: Bristol, UK, 2011; ISBN 978-1-84911-239-0. Available online: https://assets.publishing.service.gov.uk/media/5a7c35fced915d76e2ebbd32/scho0911bubx-e-e.pdf (accessed on 1 October 2025).
- Longval, R.; Meirbekova, R.; Fisher, J.; Maignot, A. An Overview of Silica Scaling Reduction Technologies in the Geothermal Market. Energies 2024, 17, 4825. [Google Scholar] [CrossRef]
- Korbutiak, V.M.; Stefanyshyn, D.V.; Khodnevych, Y.V.; Lahodniuk, O.A.; Martyniuk, V.O. Analysis of current trends in water runoff of the Sluch River in terms of extraterritorial impacts of hydrotechnical construction. IOP Conf. Ser. Earth Environ. Sci. 2024, 1415, 012102. [Google Scholar] [CrossRef]
- Wan, Y.; Tian, X.; He, H.; Tong, P.; Gao, R.; Ji, X.; Li, S.; Luo, S.; Li, W.; Chen, Z. Prediction of Typical Power Plant Circulating Cooling Tower Blowdown Water Quality Based on Explicable Integrated Machine Learning. Processes 2025, 13, 1917. [Google Scholar] [CrossRef]
- Liu, J.; Wang, J. Experimental Study on the Mechanism and Efficiency of a Closed-Cycle Low-Temperature Evaporation System for Treating High Salt and High Organic Matter Wastewater. J. Water Process Eng. 2024, 58, 104926. [Google Scholar] [CrossRef]
- Kuznietsov, P.N.; Biedunkova, O.O.; Yaroshchuk, O.V. Experimental study of transformation of carbonate system components cooling water of Rivne Nuclear Power Plant during water treatment by liming. Probl. At. Sci. Technol. 2023, 2, 69–73. [Google Scholar] [CrossRef]
- Xia, Q.Q.; Zhao, X.; Guo, P.H.; Li, Y.K.; Zhao, Z.K.; Li, S.Q. S-HGMS Coupling with Alkali Precipitation for the Scale Inhibition in Recirculating Cooling Water with High Hardness: Performance, Mechanism and Field Application. Sep. Purif. Technol. 2024, 342, 127048. [Google Scholar] [CrossRef]
- Tan, Z.; Yin, D.; Min, J.; Liu, Y.; Zhang, D.; He, J.; Bi, Y.; Qin, K. Radiation-Resistant Bacteria: Potential Player in Sustainable Wastewater Treatment. Sustainability 2025, 17, 7864. [Google Scholar] [CrossRef]
- Petruța, N.-L.; Sur, I.M.; Rusu, T.A.; Gabor, T.; Rusu, T. Integrated Assessment of Groundwater Vulnerability and Drinking Water Quality in Rural Wells: Case Study from Ceanu Mare Commune, Northern Transylvanian Basin, Romania. Sustainability 2025, 17, 6530. [Google Scholar] [CrossRef]
- Borgert, C.J.; Fuentes, C.; Burgoon, L.D. Principles of dose-setting in toxicology studies: The importance of kinetics for ensuring human safety. Arch. Toxicol. 2021, 95, 3651–3664. [Google Scholar] [CrossRef]
- Decree No. 91-1283 of 19 December 1991 on Quality Objectives for Watercourses, Sections of Watercourses, Canals, Lakes or Ponds and Sea Waters Within Territorial Limits ENVP9161976D. Available online: https://www.legifrance.gouv.fr/loda/id/JORFTEXT000000538898 (accessed on 1 October 2025). (In French)
- Guideline Value from the Swiss Ordinance on Wastewater Discharge, as per OEaux 814.201, October 1998 (Status as of 1 August 2025). Available online: https://www.fedlex.admin.ch/eli/cc/1998/2863_2863_2863/en (accessed on 1 October 2025).
- Portuguese Decree-Law No. 236/98 (1998), Replacing Decree-Law No. 74/90. 1990. Available online: https://diariodarepublica.pt/dr/detalhe/decreto-lei/236-1998-430457 (accessed on 1 October 2025). (In Portuguese).
- Order MAM/85/2008, of 16 January, Establishing the Technical Criteria for Assessing Damage to Public Water Resources and the Rules on Sampling and Analysis of Wastewater Discharges. Available online: https://www.boe.es/eli/es/o/2008/01/16/mam85 (accessed on 1 October 2025). (In Spanish).
- Ukrainian Standards for Water Quality in Water Bodies Ministry of Health of Ukraine 2022, No. 721. 34. Available online: https://zakon.rada.gov.ua/laws/show/z0524-22#Text (accessed on 1 October 2025). (In Ukrainian)
- Roberts, D.M.; Buckley, N.A. Pharmacokinetic Considerations in Clinical Toxicology. Clin. Pharmacokinet. 2007, 46, 897–939. [Google Scholar] [CrossRef]
- Nekos, A.; Boiaryn, M.; Tsos, O.; Netrobchuk, I.; Voloshyn, V. Determination of the macrophyte index MIR as an indicator of water quality in the Pripet river. Visnyk V. N. Karazin Kharkiv Natl. University. Ser. Geology. Geography. Ecol. 2023, 58, 360–370. [Google Scholar] [CrossRef]
- Shehata, N.; Egirani, D.; Olabi, A.G.; Inayat, A.; Abdelkareem, M.A. Membrane-Based Water and Wastewater Treatment Technologies: Issues, Current Trends, Challenges, and Role in Achieving Sustainable Development Goals and Circular Economy. Chemosphere 2023, 320, 137993. [Google Scholar] [CrossRef]
- Pan, D.; Deng, Y.; Yang, S.X.; Gharabaghi, B. Recent Advances in Remote Sensing and Artificial Intelligence for River Water Quality Forecasting: A Review. Environments 2025, 12, 158. [Google Scholar] [CrossRef]
- Skyba, V.; Vozniuk, N.; Likho, O.; Vozniuk, S.; Buhaiev, O. Alternative Tools for Modern Agroecological Research. In International Conference of Young Professionals «GeoTerrace-2024»; European Association of Geoscientists & Engineers: Utrecht, The Netherlands, 2024; Volume 2024, pp. 1–5. [Google Scholar] [CrossRef]
- Skyba, V.; Vozniuk, N.; Vozniuk, S. GIS Resources as a Tool for Monitoring and Managing River Basin Conditions. In International Conference of Young Professionals «GeoTerrace-2024»; European Association of Geoscientists & Engineers: Utrecht, The Netherlands, 2024; Volume 2024, pp. 1–5. [Google Scholar] [CrossRef]
- Grokhovska, Y.; Volodymyrets, V.; Konontsev, S. Diversity and dynamics of hydrophilic flora of Lowland Polissya (on the example of the Sluch River basin). Biosyst. Divers. 2021, 29, 303–310. [Google Scholar] [CrossRef]
Disclaimer/Publisher’s Note: The statements, opinions and data contained in all publications are solely those of the individual author(s) and contributor(s) and not of MDPI and/or the editor(s). MDPI and/or the editor(s) disclaim responsibility for any injury to people or property resulting from any ideas, methods, instructions or products referred to in the content. |
© 2026 by the authors. Licensee MDPI, Basel, Switzerland. This article is an open access article distributed under the terms and conditions of the Creative Commons Attribution (CC BY) license.