Abstract
This study aims to develop an artificial neural network (ANN) model to predict the predicted mean vote (PMV) index, a key Indicator of thermal comfort. Based on the ASHRAE II dataset, our approach uses the six PMV variables: air temperature, relative humidity, air velocity, radiative mean temperature, clothing insulation, and metabolic rate. However, accurately calculating PMV to determine the thermal comfort of a space can be complex due to the non-linear relationships between these different parameters. Sensitivity analysis of these parameters, performed by the Spearman rank method, identifies the most influential parameters on thermal comfort. The ANN model is trained and tested on 26,805 datasets. The results demonstrate a strong predictive capacity of the ANN, attested by a coefficient of determination R2 of 0.99 and a low root mean square error RMSE.
1. Introduction
Thermal comfort, essential for human well-being and activity, is defined as a person’s satisfaction with the thermal environment [1]. The most widely used thermal comfort index is the predicted mean vote (PMV) index, developed by Fanger [2]. This index depends on six variables: two individual physiological factors (clothing insulation, metabolism) and four environmental factors (air temperature, wind speed, relative humidity, radiation temperature). Thus, the perception of thermal comfort can vary from one person to another, even in an identical environment. The PMV ranges from −3 (cold) to +3 (hot) [3]. However, the manual calculation of the PMV index is complex. The non-linear nature of the relationships between variables requires complex calculations, which makes determining the PMV in real time impractical [3,4]. In addition, the accurate measurement of some key parameters is difficult. For example, clothing insulation (Clo) and metabolic rate (Met) are personal parameters that are difficult to objectify, while mean radiant temperature (MRT) and air velocity (Vel) often present measurement challenges in real-world conditions [5]. Several attempts to simplify the PMV calculation have been made. Buratti et al. [6] introduced a linear regression model based on operating temperature. However, Sherman [7] developed a simplified equation based on the calculation of a control coefficient derived from the original Fanger formula. Other studies, recognizing the difficulties in directly measuring some key PMV variables, have explored alternative methods to predict them with some validity. For example, Park et al. [8] developed a machine learning-based model for predicting mean radiative temperature (MRT), achieving better results with neural networks and decision trees. Ruivo et al. [9] used atmospheric pressure to estimate metabolic rate (Met). Lee et al. [10] used an infrared camera to estimate clothing insulation (Clo), although this approach led to a slight decrease in PMV accuracy. However, these alternative approaches inevitably lead to a loss of accuracy. Additionally, most recent research in machine learning focuses on predicting thermal preferences or subjective votes (TSV) rather than PMV. For example, Feng et al. [11] proposed a framework for personalized thermal comfort prediction based on available data and sensor technologies. In this framework, Farhan et al. [12] used an SVM model to predict TSV with an accuracy of 76.7%, outperforming Fanger’s PMV model (35.4%). This study therefore aims to analyze the relative impact of these six factors on PMV prediction by combining two approaches, variable analysis and artificial neural networks (ANN), in different input scenarios. First, we assume that all six factors considered do not have an equal influence on PMV, and that some can be neglected without significantly affecting the model performance. Second, we believe that the performance stability and the readability of ANN model predictions can be improved via the careful selection of input factors using a variety of analysis methods, such as linear regression and sensitivity analysis. Finally, we hypothesize that the performance of the neural network is dependent on the chosen scenario, particularly the number of factors included as input, which offers the possibility of optimizing the balance between model complexity and PMV prediction accuracy. In order to verify these hypotheses, the objective of our study is to develop an artificial neural network (ANN) model to accurately predict the thermal comfort index (PMV), relying on a sensitivity analysis based on Spearman correlation to identify the most influential variables. Two scenarios were studied: in the first, the six input parameters of the PMV model were used; in the second, only four environmental parameters were considered.
2. Materials and Methods
2.1. Dataset
The study used the ASHRAE Global thermal Comfort Databases II, which includes 81,846 indoor environment measurements collected from 1995 to 2015 at 52 sites worldwide [3]. A subset of 26,805 data, including the 6 key variables for PMV calculation (ta, rh, vel, mrt, clo, and met), was selected. These data were then divided into a training set (70%) and a validation set (30%), as detailed in Figure 1. All data analysis and modeling were performed using the Python programming language version 3.12.11, leveraging its libraries dedicated to scientific analysis and machine learning.
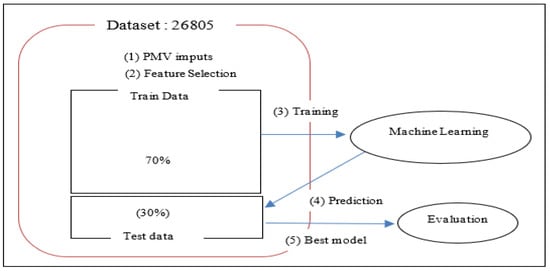
Figure 1.
Diagram of the dataset for PMV value prediction [5].
2.2. Predicted Mean Vote
The Predictive Mean Vote Index is used to assess an individual’s thermal comfort. This index uses a seven-point scale (Table 1) to quantify the comfort level.

Table 1.
Thermal perception scale [3].
PMV is influenced by six factors: metabolic rate, clothing insulation, air temperature, relative humidity, air velocity, and radiation temperature. It is calculated using Equation (1):
where M and W are the metabolic rates (W/m2) and external work (W/m2), respectively, Pa is the partial pressure of water vapor (Pascal), while ta and tr are air temperature (°C) and mean radiation temperature (°C), respectively. The clothing surface temperature (tcl) and convection heat transfer coefficient (hc) are calculated by Equations (2) and (3).
where Va is the air velocity in m/s and Icl is the thermal resistance of clothing in m2. °C/W, while fcl is the ratio of the body surface area covered by clothing to the naked body surface area, and is defined by Equation (4):
Equation (5) is a formula for calculating the partial pressure of water vapor (Pa) as a function of relative air humidity (ha) and air temperature (ta).
The conventional model for PMV uses Equations (1)–(3). Since these equations are nonlinear, their solution is computationally time-consuming and expensive. In addition, the hardware implementation is complex. These two factors make its use difficult in real-time applications [13].
2.3. Analysis of Thermal Comfort Parameters
To study the influence of environmental parameters on thermal comfort, a linear regression analysis was carried out using python. This method made it possible to evaluate the strength and direction of the relationship between the PMV index (comfort variable) and environmental parameters, by calculating the coefficient of determination R2 by Equation (6) which measures the ability of the linear model to predict the PMV index, and by determining the linear regression equation by Equation (7), which establishes a mathematical relationship between the PMV index and environmental parameters.
y is a dependent variable that represents the value of the PMV index, x is an independent variable that represents the environmental parameters, a is a constant, and b is the slope coefficient of the regression line. In order to determine the relative importance of the different parameters on thermal comfort, a sensitivity analysis was conducted using a statistical tool. This analysis is based on Spearman’s rank correlation. The correlation values (between −1 and 1) indicate the strength and direction of the influence of each parameter on comfort (Table 2) and are calculated from Equation (8) [14].
Table 2.
Meaning of the spearman rank correlation value.
The Spearman coefficient (rs), based on the rank of the data (R(xi) for the parameters and R(yi) for the PMV index), is used to assess the influence of each parameter on thermal comfort. By ranking the parameters according to the value of their Spearman coefficient, we can determine those with the greatest impact on the PMV index.
2.4. ANN Modeling for PMV Index Prediction
Since the manual calculation of PMV is complex, an artificial neural network (ANN) is used to approximate the relationship between input variables and the PMV value. The architecture of this network consists of three types of layers: an input layer receiving raw or standardized data; one or more hidden layers, capable of modeling non-linear relationships between variables [15] and an output layer providing the estimated PMV value. The network was trained using the backpropagation algorithm. Two scenarios were studied: in the first, the six input parameters of the PMV model were used; in the second, only four parameters were considered. The final architecture retained integrates five hidden layers, which simplifies the calculations and ensures good performance (Figure 2).
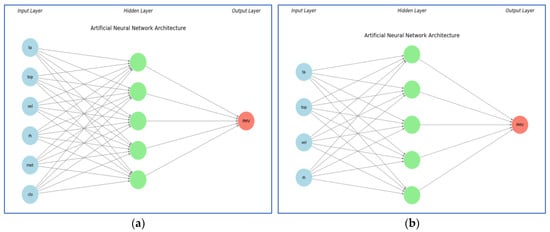
Figure 2.
Artificial neural network architecture dedicated to thermal comfort prediction: (a) Structure of the first scenario ANN model; (b) Structure of the second scenario ANN.
Two metrics are used to assess the quality of the model predictions: the coefficient of determination R2 calculated with Equation (6) and the root mean square error RMSE, with Equation (9). An R2 greater than 0.7 indicates a well-performing model, while an R2 less than 0.4 suggests that the model should not be used [16]. The RMSE is calculated by comparing the values predicted by the model (Y(i)) with the actual values of the PMV index (Y’(i)), by calculating the square root of the average of the squares of these differences for the set of N data.
3. Results and Discussion
3.1. The Relationship of Environmental Parameters with the PMV Index
The thermal comfort experienced by a person is influenced by several environmental parameters, namely air temperature, mean radiation temperature, relative humidity, and air velocity [1]. The impact of these parameters on comfort, measured by the PMV index, is analyzed by linear regression. According to [17], optimal comfort (PMV = 0) corresponds to 5% dissatisfaction (PPD) or 95% satisfaction. An acceptable comfort zone (PMV between −0.5 and +0.5) tolerates up to 10% dissatisfaction or 90% satisfaction. Analyzing the relationship between each parameter and the PMV makes it possible to determine the ranges of parameter values necessary to achieve these comfort conditions.
3.1.1. Air Temperature
Figure 3 illustrates a positive relationship between air temperature and PMV (thermal comfort) index. The black line corresponds to the linear regression line (y = 0.1836x − 4.6337, R2 = 0.519).
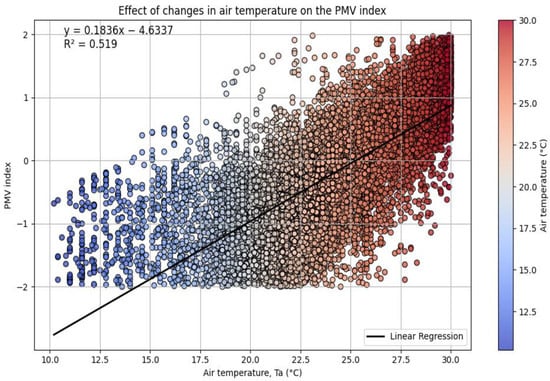
Figure 3.
Effect of air temperature variations on the PMV index.
Linear regression analysis shows that a 1 °C increase in air temperature is associated with a 0.1836 increase in PMV index. In other words, higher air temperature is correlated with increased sensation of heat (higher PMV index). Air temperature explains 51.9% of the variation of the PMV index.
The results presented in Figure 3 confirm the conclusions of the study [18] by highlighting a positive linear relationship between air temperature and the PMV index. Furthermore, Park and Woo [5], using the Gini importance method, identified air temperature (ta) as one of the most influential variables on thermal comfort. The regression analysis allows us to estimate that neutral thermal comfort (PMV = 0) is achieved when the air temperature is 25.17 °C. A comfort range, where approximately 90% of individuals feel comfortable (PMV between −0.5 and +0.5), corresponds to air temperatures between 22 °C and 28 °C.
3.1.2. Operative Temperature
The top is a weighted average of the air temperature ta and the mean radiative temperature (Tmrt), more relevant for the overall assessment of thermal comfort than the air temperature alone [3].
From Figure 4, the linear regression equation shows a positive relationship between operating temperature and PMV index, indicating that a 1 °C increase in operating temperature leads to a 0.1839 increase in PMV index. Thus, the higher the operating temperature, the warmer the perceived thermal sensation. In addition, the coefficient of determination R2 = 0.519 indicates that 51.9% of the variation in PMV is explained by operating temperature, confirming its significant influence on thermal comfort.
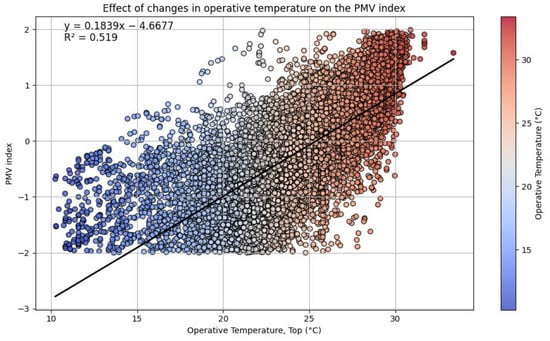
Figure 4.
Effect of operating temperature variations on the PMV index.
3.1.3. Relative Humidity
Figure 5 shows that the relationship between relative humidity and thermal comfort is weakly positive. Linear regression analysis shows that a 1 °C increase in relative humidity is associated with an increase of 0.0075. However, the coefficient of determination R2 = 0.018 is very low, meaning that only 1.8% of the variation in PMV is explained by relative humidity. The scatter plots show a large dispersion, indicating a significant variation in PMV for the same humidity level.
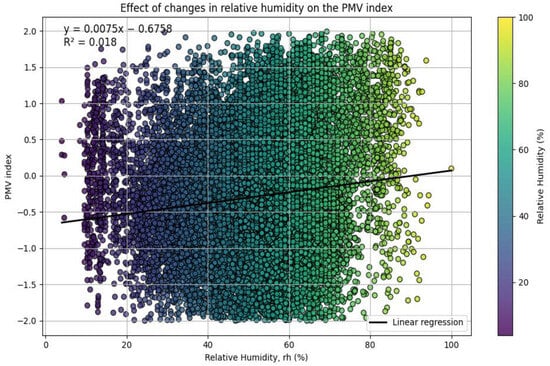
Figure 5.
Effect of relative humidity variations on the PMV index. The black line represents the linear regression fit (y = 0.0075x − 0.6758, R2 = 0.018).
The analysis reveals that relative humidity is inversely related to air temperature and mean radiant temperature; an increase in the latter tends to decrease relative humidity. The results of Park and Woo [5] confirm this relationship, indicating that relative humidity has a relatively limited impact on thermal comfort.
3.1.4. Air Speed
The relationship between air velocity and thermal comfort is weakly positive, as shown in Figure 6. The black line represents the linear regression fit (y = 1.1174x − 0.4413, R2 = 0.037). According to the linear regression equation, an increase in air velocity by x leads to an increase in the PMV index of 1.1174. This means that an increase in air velocity contributes to a warmer thermal sensation. However, the value of the obtained R2 is 0.037, indicating that air speed explains only 3.7% of the variation in PMV. This weak correlation suggests that other environmental factors have a more significant influence on thermal comfort compared to air speed alone. The graph also illustrates a significant scatter of points, indicating that for the same air speed, PMV values vary widely.
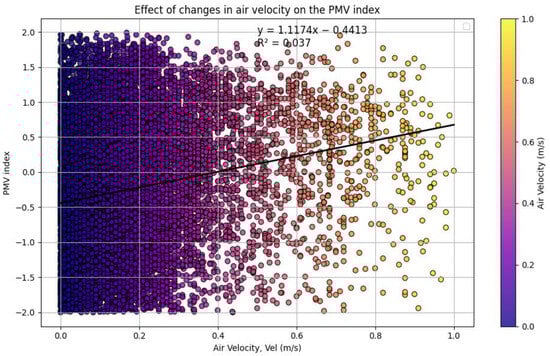
Figure 6.
Effect of air speed variations on the PMV index.
According to the linear regression equation, it can also be seen that comfortable or neutral conditions (PMV = 0) are reached when the air speed is about 0.4 m/s. At the same time, the comfortable air speed range (PMV between −0.5 and +0.5) is about 0.08 m/s to 0.6 m/s. As observed by Park and Woo [5], and more particularly highlighted by their analysis using the Best Subset method, air velocity (vel) seems to play a less crucial role than other factors in determining thermal comfort.
3.2. Sensitivity Analysis of Thermal Comfort Parameters
Sensitivity analysis is used to understand the behavior of environmental and human factors in the PMV index assessment. It is important to determine which parameter has the greatest influence on thermal comfort in order to optimize building design and management adjustments. Figure 7 presents a Spearman correlation matrix, which measures the monotonic relationship between different thermal comfort variables. The numbers indicate the correlation coefficients: red represents positive correlation, blue represents negative correlation, and the darker the color is the stronger the correlation.
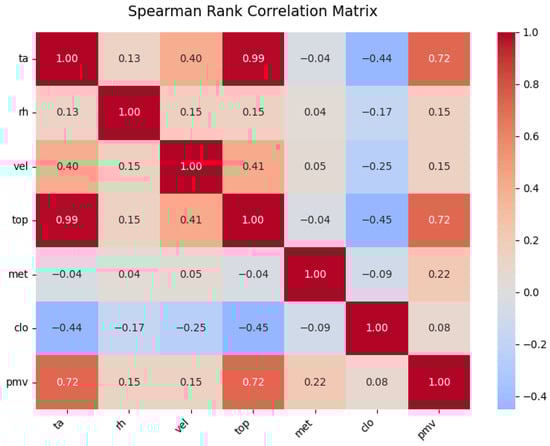
Figure 7.
Spearman correlation matrix.
The results indicate significant relationships between some parameters and PMV. Air temperature (ta) and operating temperature (top), present an almost perfect correlation between them (0.99), are strongly related to PMV (0.72 each), indicating that an increase in these temperatures causes a more intense sensation of heat. This contrasts with the sensitivity analysis of Moutela et al. [19], who ranked metabolic rate as the most influential factor. In contrast, relative humidity (rh) has a limited impact on PMV (0.018) while metabolism (met) has a moderate effect (0.22). Moreover, while Moutela et al. [19] ranked clothing insulation as the third most important factor, our study found it to be the least influential, with a correlation coefficient of 0.079. It is also noted that clothing insulation decreased with increasing temperatures (ta and top), suggesting clothing adaptation to heat. On the other hand, relative humidity (rh) and clothing insulation (clo) have a limited impact on PMV (0.15 and 0.08 respectively) while metabolism (met) has a moderate effect (0.22). It is also noted that clothing insulation decreased with increasing temperatures (ta and top), which suggests clothing adaptation to heat. The results of the calculation of the Spearman coefficient, compared to the coefficient of determination, are presented in Table 3.
Table 3.
Comparison between R2 and Spearman for each variable.
Following the comparison between the coefficient of determination (R2) and the Spearman coefficient, it appears that thermal comfort is most influenced by the operating temperature and the air temperature. At the same time, the parameter having the least effect on thermal comfort is clothing insulation (Figure 8).
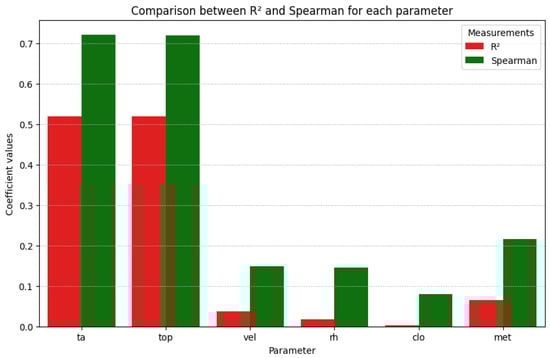
Figure 8.
Comparison between R2 and Spearman coefficient for each thermal comfort parameter.
3.3. Prediction of Thermal Comfort Using ANN Modeling
Artificial neural network modeling was performed in two different scenarios, each using distinct input data. In the first scenario, the model integrated all factors influencing the Predicted Mean Vote (PMV) index, a measure of thermal comfort. Figure 9 illustrates the strong correlation between actual PMV values and PMV values estimated by the ANN model.
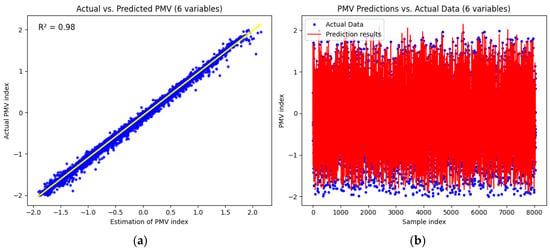
Figure 9.
The performance of the artificial neural network (ANN) model of the first scenario in predicting the PMV index: (a) The graph on the left shows the correlation between actual PMV values (y-axis) and the values estimated by the model (x-axis) of the first scenario; (b) The graph on the right shows the actual and predicted PMV values as a function of the samples in the first scenario.
The model demonstrates high accuracy in predicting thermal comfort based on the PMV index, achieving a coefficient of determination R2 of 0.98 and a root mean square error RMSE of 0.1023. The straight line shown in the figure corresponds ti linear regression between the ANN predicter PMV values and the actual PMV values. The closer the data points are to this line, the more accurate the prediction. This strong performance indicates that the first-scenario ANN model, which accounts for all relevant factors of thermal comfort, is a reliable predictor of thermal comfort levels. When the variable selection is restricted to 4 variables chosen according to Spearman correlation analysis, the model performance decreases slightly with an R2 of 0.74 (Figure 10).
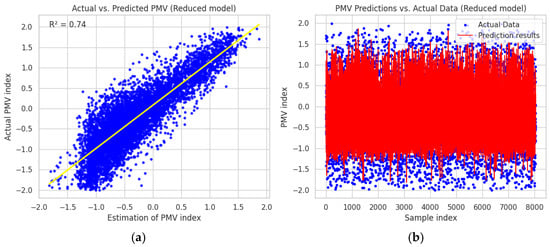
Figure 10.
The performance of the artificial neural network (ANN) model in predicting the PMV index for the 4 variables selected according to Spearman’s correlation analysis: (a) The graph on the left shows the correlation between actual PMV values (y-axis) and the values estimated by the model (x-axis); (b) The graph on the right shows actual and predicted PMV values as a function of samples.
This result highlights that although reducing the number of variables simplifies the model, it also results in a significant loss of information that affects the quality of the prediction. Thus, the selection of input variables has a direct impact on the accuracy of the thermal comfort prediction model. To simplify the modeling, a second scenario based on an ANN neural network was developed. This simplification consisted of reducing the number of input parameters, specifically excluding clothing insulation (clo) and metabolic rate (met). The choice of these two parameters is justified by the relative complexity of their determination and calculation. Figure 11 illustrates the relationship between the actual values of the PMV index and the estimates obtained with this second ANN model.
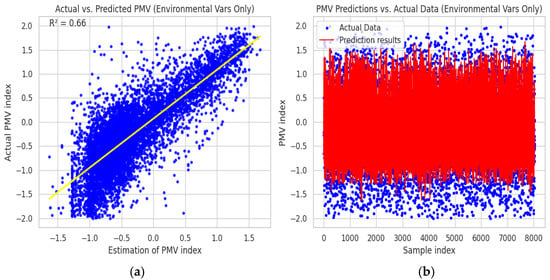
Figure 11.
The performance of the artificial neural network (ANN) model of the second scenario in predicting the PMV index: (a) The graph on the left shows the correlation between the actual PMV values (y-axis) and the values estimated by the model (x-axis) of the second scenario; (b) The graph on the right shows the actual and predicted PMV values as a function of the samples in the second scenario.
The results of the prediction of thermal comfort are less adequate than in the first scenario, the coefficient of determination R2 is 0.66 and the RMSE value is 0.4554. These figures suggest that removing clothing insulation (clo) and metabolic rate (met) as input parameters significantly affects the quality of the modeling. This is explained by the significant influence of these two factors on thermal comfort. The second scenario model still does not provide sufficiently accurate results. An approach of fixing individual parameters such as clothing insulation and metabolic rate was adopted. According to reference [19], the recommended nominal values for a typical sedentary activity in an indoor environment are 1.2 met for metabolism and 0.9 Clo for clothing insulation. However, the two nominal values derived from our data are 1.2 met and 0.5 Clo. Based on these two standard values, a filtering of the dataset was carried out in order to keep only the samples corresponding to these two conditions. This approach makes it possible to eliminate the variability linked to individual behaviors and to focus exclusively on the effect of environmental parameters (air temperature, mean radiant temperature, air speed, relative humidity) on the PMV index. After filtering, 1281 samples were retained for training and evaluation of the ANN model. Thus, the ANN model trained on this reduced subset showed remarkable performance with a coefficient of determination R2 of 0.99, confirming that this simplification improves accuracy while maintaining a realistic representativeness of thermal comfort under standard conditions (Figure 12).
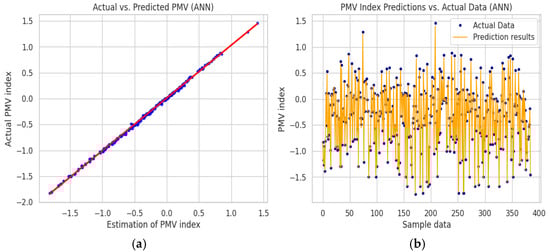
Figure 12.
The performance of the artificial neural network (ANN) model of the second modified scenario in predicting the PMV index: (a) The graph on the left shows the correlation between actual PMV values (y-axis) and model-estimated values (x-axis) of the second modified scenario; (b) The graph on the right shows actual and predicted PMV values as a function of samples in the second modified scenario.
4. Conclusions
The comparative analysis of the determination coefficients R2 and Spearman correlation coefficients for each parameter shows that air (ta) and operative (top) temperatures are the most influential factors on the PMV index. These two variables present both high values of R2 (0.52) and Spearman (0.72), reflecting a strong linear and monotonic relationship with thermal comfort. On the other hand, other parameters, such as air velocity (vel), relative humidity (rh), clothing insulation (clo), and metabolism (met), display very low R2 values, suggesting a weak linear correlation. However, their Spearman coefficients, although moderate, indicate the existence of non-linear monotonic relationships with PMV. This observation justifies the use of an artificial neural network (ANN) capable of modeling these complex and non-linear interactions that classical linear regression does not allow.
The performance evaluation of the artificial neural network (ANN) revealed a strong dependence of the model on the variables met (metabolic activity) and clo (clothing insulation). When all six input variables (ta, top, vel, rh, met, clo) are used, the model achieves a coefficient of determination of 0.98, indicating a near-perfect prediction of PMV. In contrast, when only the environmental variables (ta, top, va, rh) are considered, the performance drops to 0.66. This significant decrease shows that individual factors related to activity and clothing play a key role in the perception of thermal comfort and must be included to ensure reliable predictions. The corrected version of the ANN model of the second scenario relies solely on environmental variables, considering that the two individual parameters are considered constant, which allows for their exclusion from the model. The results show excellent accuracy, with a high coefficient of determination.
Author Contributions
Conceptualization, N.B.Y. and D.T.; methodology, N.B.Y.; software, N.B.Y.; validation, N.B.Y. and D.T.; formal analysis, N.B.Y.; investigation, N.B.Y.; resources, N.B.Y.; data curation, N.B.Y.; writing—original draft preparation, N.B.Y.; writing—review and editing, N.B.Y.; visualization, N.B.Y.; supervision, N.B.Y.; project administration, N.B.Y.; funding acquisition, D.T. All authors have read and agreed to the published version of the manuscript.
Funding
This research received no external funding.
Institutional Review Board Statement
Not applicable.
Informed Consent Statement
Not applicable.
Data Availability Statement
The data supporting this study are openly available in the ASHRAE Global Thermal Comfort Database II via Dryad: https://datadryad.org/dataset/doi:10.6078/D1F671, (accessed on 15 January 2025) (DOI: 10.6078/D1F671).
Conflicts of Interest
The authors declare no conflict of interest.
Abbreviations
The following abbreviations are used in this manuscript:
| PMV | Predicted Mean Vote |
| PPD | Predicted Percentage of Dissatisfied |
| TP | Thermal Preference |
| MRT | Mean Radiant Temperature |
| clo | Clothing Insulation |
| met | Metabolic Activity |
| ta | Air Temperature (°C) |
| top | Operative Temperature |
| vel | Air Velocity |
| rh | Relative Humidity |
| ANN | Artificial Neural Network |
| ASHRAE | American Society of Heating, Refrigerating and Air-Conditioning Engineers |
| RMSE | Root Mean Square Error |
| AI | Artificial Intelligence |
| ML | Machine Learning |
| SVM | Support Vector Machine |
| TSV | Thermal Sensation Vote |
| M | Metabolic Rates (W/m2) |
| W | External Work (W/m2) |
| Pa | Partial Pressure of Water Vapor (Pa) |
| tr | Mean Radiation Temperature (°C) |
| hc | Convective Heat Transfer Coefficient |
| tcl | Clothing Surface Temperature |
References
- Song, Z.; Xia, Y.; Ma, M.; Deng, B.; Miao, T.; Fan, Q.; Li, J. Reliable sleep temperature regulation based on PMV model and dynamic thermal parameters. Build. Environ. 2024, 254, 111420. [Google Scholar] [CrossRef]
- Cheung, T.; Schiavon, S.; Parkinson, T.; Li, P.; Brager, G. Analysis of the accuracy on PMV–PPD model using the ASHRAE Global Thermal Comfort Database II. Build. Environ. 2019, 153, 205–217. [Google Scholar] [CrossRef]
- Roni, M.S.B.; Hariri, A. ASHRAE Global Thermal Comfort Database II: Comparison of Thermal Comfort Conditions in Different Type of Building. Res. Prog. Mech. Manuf. Eng. 2021, 2, 189–200. [Google Scholar]
- Avci, A.B. Machine learning-based prediction of thermal comfort: Exploring building types, climate, ventilation strategies, and seasonal variations. Build. Res. Inf. 2025, 1–18. [Google Scholar] [CrossRef]
- Park, K.Y.; Woo, D.O. PMV Dimension Reduction Utilizing Feature Selection Method: Comparison Study on Machine Learning Models. Energies 2023, 16, 2419. [Google Scholar] [CrossRef]
- Buratti, C.; Ricciardi, P.; Vergoni, M. HVAC systems testing and check: A simplified model to predict thermal comfort conditions in moderate environments. Appl. Energy 2013, 104, 117–127. [Google Scholar] [CrossRef]
- Sherman, M. A simplified model of thermal comfort. Energy Build. 1985, 8, 37–50. [Google Scholar] [CrossRef]
- Park, J.; Choi, H.; Kim, D.; Kim, T. Development of novel PMV-based HVAC control strategies using a mean radiant temperature prediction model by machine learning in Kuwaiti climate. Build. Environ. 2021, 206, 108357. [Google Scholar] [CrossRef]
- Ruivo, C.R.; da Silva, M.G.; Broday, E.E. Study on thermal comfort by using an atmospheric pressure dependent predicted mean vote index. Build. Environ. 2021, 206, 108370. [Google Scholar] [CrossRef]
- Lee, K.; Choi, H.; Kim, H.; Kim, D.D.; Kim, T. Assessment of a real-time prediction method for high clothing thermal insulation using a thermoregulation model and an infrared camera. Atmosphere 2020, 11, 106. [Google Scholar] [CrossRef]
- Feng, Y.; Liu, S.; Wang, J.; Yang, J.; Jao, Y.L.; Wang, N. Data-driven personal thermal comfort prediction: A literature review. Renew. Sustain. Energy Rev. 2022, 161, 112357. [Google Scholar] [CrossRef]
- Farhan, A.A.; Pattipati, K.; Wang, B.; Luh, P. Predicting individual thermal comfort using machine learning algorithms. In Proceedings of the 2015 IEEE International Conference on Automation Science and Engineering (CASE), Gothenburg, Sweden, 24–28 August 2015; pp. 708–713. [Google Scholar] [CrossRef]
- Kumar, M.; Kar, I.N. Non-linear HVAC computations using least square support vector machines. Energy Convers. Manag. 2009, 50, 1411–1418. [Google Scholar] [CrossRef]
- Dudáš, A. Graphical representation of data prediction potential: Correlation graphs and correlation chains. Vis. Comput. 2024, 40, 6969–6982. [Google Scholar] [CrossRef]
- Boutahri, Y.; Tilioua, A. Machine learning-based predictive model for thermal comfort and energy optimization in smart buildings. Results Eng. 2024, 22, 102148. [Google Scholar] [CrossRef]
- Olori, V.E.; Brotherstone, S.; Hill, W.G.; McGuirk, B.J. Fit of standard models of the lactation curve to weekly records of milk production of cows in a single herd Livest. Prod. Sci. 1999, 58, 55–63. [Google Scholar] [CrossRef]
- Ze Ze, C.B.; Nneme Nneme, L.; Monkam, L. PMVd/PPDd model for predicting thermal comfort in air-conditioned buildings in hot and humid regions of Sub-Saharan Africa. Int. J. Air-Cond. Refrig. 2024, 32, 19. [Google Scholar] [CrossRef]
- Kim, J.H.; Min, Y.K.; Kim, B. Is the PMV index an indicator of human thermal comfort sensation. Int. J. Smart Home 2013, 7, 27–34. [Google Scholar]
- Moutela, R.; Carrilho, J.D.; Da Silva, M.G. Sensitivity of the PMV index to the thermal comfort parameters. In Proceedings of the 2nd Energy for Sustainability Multidisciplinary Conference, Coimbra, Portugal, 14–15 May 2015. [Google Scholar]


Disclaimer/Publisher’s Note: The statements, opinions and data contained in all publications are solely those of the individual author(s) and contributor(s) and not of MDPI and/or the editor(s). MDPI and/or the editor(s) disclaim responsibility for any injury to people or property resulting from any ideas, methods, instructions or products referred to in the content. |
© 2025 by the authors. Licensee MDPI, Basel, Switzerland. This article is an open access article distributed under the terms and conditions of the Creative Commons Attribution (CC BY) license (https://creativecommons.org/licenses/by/4.0/).