Abstract
Le Lectier pears (hereafter, Pears) are graded based on appearance, requiring farmers to inspect tens of thousands in a short time before shipment. To assist in this process, a grading support system was developed. The existing cloud-based system used mobile devices to capture images and analyzed them with Convolutional Neural Networks (CNNs) and texture-based algorithms. However, communication delays and algorithm inefficiencies resulted in a 30 s execution time, posing a problem. This paper proposes an edge computing-based system using Mask R-CNN for appearance deterioration detection. Processing on edge servers reduces execution time to 5–10 s, and 39 out of 51 Pears are accurately detected.
1. Introduction
A kind of pear, Le Lectier (hereafter referred to as Pear), is evaluated and graded on its appearance, and the higher grades are used as gifts. Consequently, the quality of appearance significantly impacts its commercial value. Therefore, grading is usually defined by an authority such as the government of Niigata Prefecture in Japan, as shown in Table 1.

Table 1.
Example of grading.
Table 1 categorizes Pears into “Excellent”, “Brilliant”, and “Good” based on the types of appearance deterioration: Alternaria, Injury, Speckle, Plane, and Chemical. Examples of perspectives are shown in Figure 1; Alternaria has dense black spots caused by bacteria (Figure 1a), Injury appeared from damage in farm work or shipping work (Figure 1b), Speckle is caused by dampness or bacteria (Figure 1c), Plane is caused by dampness (Figure 1d), and Chemical has corks or rings caused by pesticides (Figure 1e).
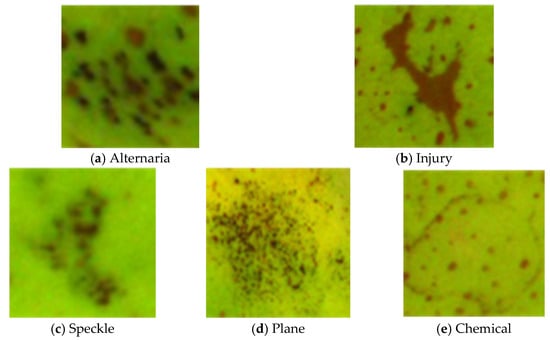
Figure 1.
Examples of appearance deterioration.
Pear farmers are required to visually inspect and grade tens of thousands of Pears one by one, according to Table 1, within a short period. Accurate grading is challenging for less experienced farmers, as the process involves a comprehensive evaluation of the factors and severity of appearance deterioration. The difficulty results in a heavy workload for pear farmers.
This research aims to develop a system (hereafter referred to as the “pear grading support system”) to assist in the grading process of Pears, which is currently performed visually by farmers. The proposed pear grading support system is designed for use by individual Japanese Pear farmers during the pre-shipment grading process. Therefore, the system must be operable in the limited space of the farmer’s workspace and provide fast and simple operation.
Nakazawa and Yamazaki [1] proposed a service for detecting appearance deterioration and grading Pears. This service consisted of capturing Pear images using mobile devices such as tablets or smartphones and analyzing the captured images with an appearance deterioration detection model in a cloud-based system. The detection of appearance deterioration utilized texture features to identify deteriorated areas and employed Convolutional Neural Networks (CNNs) to classify the detected deterioration. An issue of this service was the processing time, which took approximately 30 s per fruit. The main causes of this issue were the reliance on cloud services and the time-consuming detection algorithm. Therefore, it was necessary to change to a service using edge computing and to modify the detection algorithm.
2. Related Work
In this research, a deep learning model based on CNNs [2] is utilized to detect surface defects on Pear fruits. This section describes CNNs and Mask R-CNN [3], which form the basis of the proposed method in this research.
2.1. Convolutional Neural Networks
CNNs are neural networks designed for image recognition, inspired by the visual cortex of the brain, enabling local object recognition regardless of position. As shown in Figure 2, a CNN consists of convolutional layers, pooling layers, and fully connected layers.
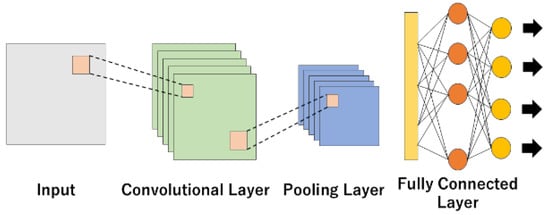
Figure 2.
Structure of the CNN.
In the convolutional layer, a kernel slides across the input image to extract features, generating feature maps. By altering the size of the kernel or the stride (the number of pixels the kernel moves), different results can be achieved. This feature map generation in the convolutional layer allows for the extraction of local features.
In the pooling layer, operations such as max pooling, which uses the maximum value within a region as a feature, or average pooling, which uses the mean value, are performed on the feature maps obtained from the convolutional layer. These operations create new feature maps. Through the generation of these feature maps in the pooling layer, the CNN gains translation invariance, enabling the recognition of features regardless of their position, in addition to the local features extracted by the convolutional layer.
In the fully connected layer, the feature maps generated by the convolutional and pooling layers are used for class classification. Specifically, each feature map is flattened into a one-dimensional vector, consolidating all the local features into a single, comprehensive representation. This process aggregates the spatial information distributed across the image, allowing the network to capture overall patterns and combinations of features.
Each neuron in the fully connected layer has its own set of weights and computes a weighted linear combination of the flattened input. This is then passed through a nonlinear activation function, such as a Rectified Linear Unit (ReLU) or Softmax, which produces a score for each class. Essentially, the fully connected layer acts as a classifier that integrates the localized features extracted earlier, enabling the CNN to make accurate class predictions based on both local and global information.
2.2. Mask R-CNN
Mask R-CNN is a model designed to generate pixel-level segmentation masks for objects within an image. As shown in Figure 3, it consists of a backbone for feature extraction, a Region Proposal Network (RPN), and RoIAlign for the precise preservation of positional information in proposed regions, object classification, bounding box (BBox) regression, and mask prediction.
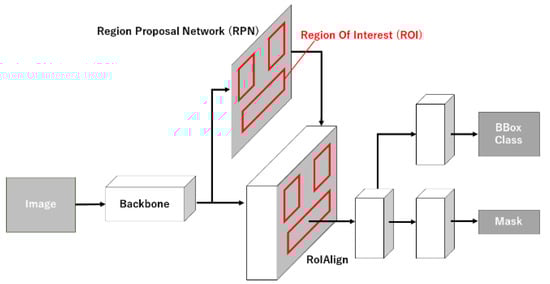
Figure 3.
Architecture of Mask R-CNN.
In the RPN, feature maps extracted via the backbone are used to set points called Anchors. Around each Anchor, Anchor boxes with different scales and aspect ratios are generated and fed into networks that classify whether the region contains an object or is part of the background, as well as networks that adjust the BBox. These processes predict the object existence probability and BBox refinement for multiple Anchor boxes. Additionally, Non-Maximum Suppression (NMS) is employed to remove overlapping regions that exceed an IoU (Intersection of Union) threshold, keeping only the one with the highest probability.
RoIAlign is used to extract object regions on the feature map. Unlike RoIPooling, which suffers from positional inaccuracies, RoIAlign enables precise extraction regardless of the RoI shape. Specifically, it directly uses the original floating-point coordinates when dividing the RoI into a fixed-size grid. Bilinear interpolation is applied to calculate feature values at each grid position, resulting in a fixed-size feature map. Bilinear interpolation is a technique that estimates values at a point within a two-dimensional grid by using data from the nearest four points surrounding it. It performs interpolation by computing weighted averages in the horizontal and vertical directions.
The fixed-length feature map is then used for object classification, BBox regression, and mask prediction.
Mask R-CNN has been widely applied in agriculture for detecting diseases. Afzaal et al. [4] proposed a method using Mask R-CNN to detect strawberry diseases through instance segmentation. Their approach utilized a dataset of 2500 images of strawberry diseases and achieved a mean Average Precision (mAP) of 0.824 for seven types of diseases.
Kumar et al. [5] proposed a real-time detection method for soybean leaf diseases using Mask R-CNN. Their method utilized a dataset of 3127 soybean leaf images and achieved an accuracy of over 0.85 for detections, with a confidence level of 0.9 or higher.
Storey et al. [6] proposed a method for detecting rust diseases on apple leaves using Mask R-CNN. When using a model with ResNet as the backbone, their approach achieved a BBox AP of 0.486 and a segmentation AP of 0.489 at an IoU threshold of 0.5. The inference time was 0.26 s, demonstrating the method’s high-speed performance.
3. Dataset
To train a deep learning model such as Mask R-CNN, a large amount of image data and annotation data with segmentation and labeling applied to the images is required. Therefore, in this section, we first describe the pear data and then explain the annotation applied to the pear images.
3.1. Pear Data
To classify Pears into grades using CNNs, it is necessary to obtain a large amount of data on various types of appearance deterioration. However, no such publicly available dataset currently exists. Therefore, we needed to collect data on Pear appearance deterioration ourselves and create a database. The Pear image data used in this research were collected in 2020 in Sanjo City, Niigata Prefecture. The images were captured from a lateral direction, with the Pears placed on a rotating platform. During image capturing, the platform was rotated at 90-degree intervals, capturing four images per fruit. All captured images were 2048 × 1536-pixel, 32-bit color images. In total, 1204 images were collected from 301 fruits. An example of the Pear images is shown in Figure 4.
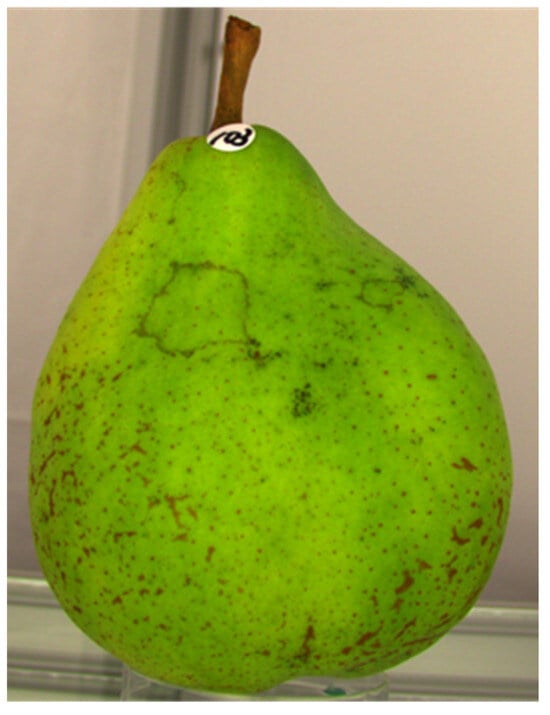
Figure 4.
An example of Pear image.
3.2. Annotation
To extract appearance deterioration and Pear regions from Pear images, annotations were applied to 1204 pre-ripening Pear images, targeting five types of appearance deterioration and Pear regions. The types of appearance deterioration annotated were Alternaria, Injury, Speckle, Plane, and Chemical. Furthermore, since it is also necessary to evaluate the Pear shape for grading, annotations of Pear contours were added. An example of the annotated images is shown in Figure 5.
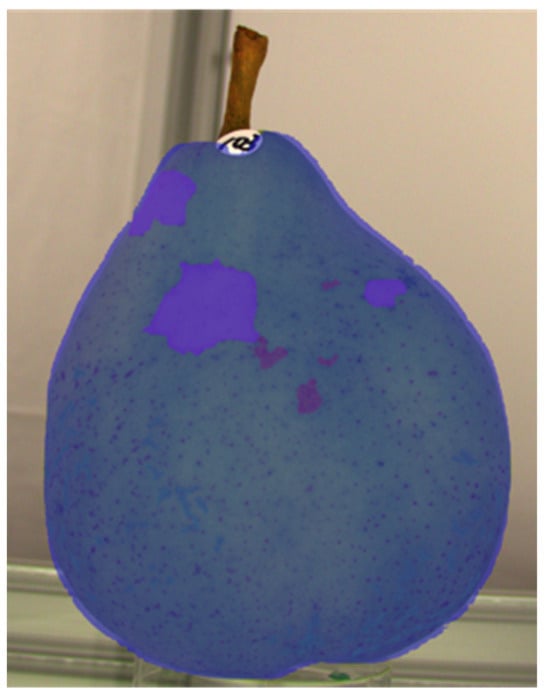
Figure 5.
An example of annotated image.
The JSON (JavaScript Object Notation) format was used for annotation, including segmentation coordinates, BBox coordinates, labeled types of appearance deterioration, and pear regions. The annotation tool used was COCO annotator. The COCO format is a widely used data format in the field of computer vision and consists of images, annotations, and categories. The images section contains information about the image, such as its ID, filename, height, and width. The annotations section includes information regarding the appearance deterioration and Pear regions within the image, such as BBox and segmentation coordinates. The categories section contains information about the categories into which appearance deterioration and Pear regions are classified. The number of annotated appearance deteriorations is shown in Table 2.
Table 2.
Number of appearance deteriorations.
4. Pear Grading Method
The grading of Pears requires the number of appearance deteriorations and the area ratio of deteriorations relative to the Pear region, as indicated in Table 1. In this paper, we propose a method for grading Pears by using Mask R-CNN to detect Pear regions and five types of appearance deterioration.
The following describes the training process of Mask R-CNN. For the Mask R-CNN dataset, 80% of the dataset was used as training data, and 20% was used as validation data. The evaluation of accuracy was performed using the mAP, which is a metric commonly used to evaluate the performance of models in object detection and segmentation tasks. By setting a threshold for the IoU, predictions exceeding the threshold are regarded as correct. Based on these correct predictions, Precision and Recall are calculated, and Average Precision (AP) is determined using Equation (1), where p represents Precision and r represents Recall. The mAP is calculated as the average of these values across all classes in Equation (2).
In this experiment, the IoU threshold was set to 0.5, which is a commonly used value for model comparison. Since Mask R-CNN detects both BBox and segmentation, evaluations were conducted using the BBox mAP and Segmentation mAP. The BBox mAP for the validation data was 0.62, while the Segmentation mAP was 0.63. As shown in Figure 6, inference images successfully detected each type of appearance deterioration. Therefore, it is evident that Mask R-CNN can detect both Pear regions and appearance deterioration.
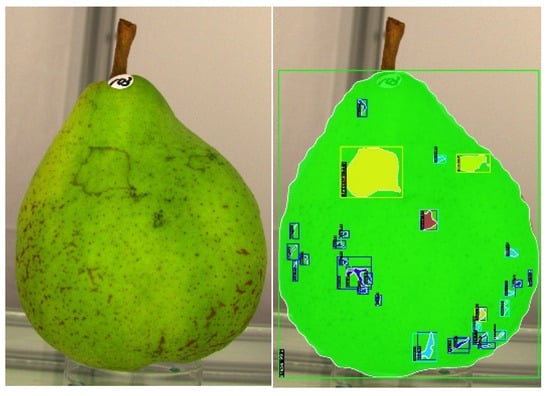
Figure 6.
Inference image.
5. Pear Grading Support System
In this section, we propose a grading support system using edge computing that incorporates the pear grading method explained in the previous section. First, we describe the architecture of the grading support system. Next, we explain the graphical user interface (GUI) application used to operate the system and display the grading results. Finally, we describe the edge server that performs the Mask R-CNN processing.
5.1. System Architecture
The pear grading support system consists of a client and a server. The client is composed of a client device, such as a PC or mobile device, and a USB-connected Web camera. A GUI application is implemented on the client device. The Web camera used is the UCAM-CW50ABWH model from ELECOM (Osaka, Japan), a wearable correspondence Web camera. The captured images are RGB images with a resolution of 1920 × 1080 pixels. As the server, the system utilizes the Jetson Nano edge device equipped with a GPU as the edge device. The configuration of the pear grading support system is shown in Figure 7.
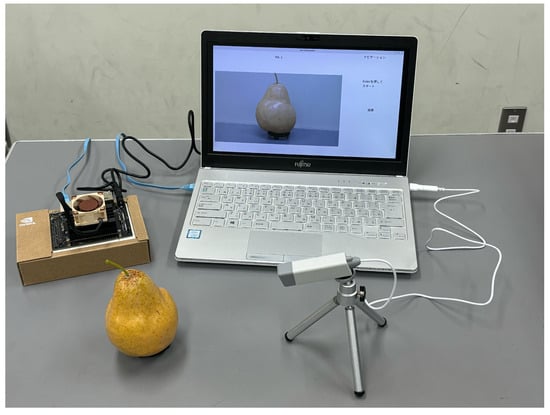
Figure 7.
Configuration of the pear grading support system.
The proposed grading support system can be implemented at an estimated cost of approximately USD 1000. This cost includes a Jetson Nano (approximately USD 200), a PC (approximately USD 600), and a USB camera (approximately USD 200), making it an affordable and accessible solution for automated fruit grading. Furthermore, unlike cloud-based solutions, which operate on a pay-as-you-go model where costs accumulate with usage, edge computing follows a one-time purchase model. This eliminates concerns about ongoing costs, making it a cost-effective solution for long-term deployment.
5.2. GUI Application
To implement this system, a PC was used as the client device, and a GUI application was developed on it. This section describes the implemented GUI application. The GUI application was developed using Kivy, an open-source framework for Python-based GUI application development. Since Kivy supports cross-platform compatibility, the application can run in various environments such as Windows, macOS, and Linux OS. The libraries used in the application are as follows:
- python = 3.12.4;
- kivy = 2.3.0;
- tritonclient = 2.49.0;
- opencv-python = 4.10.0.84.
Next, the application’s execution process is described. As shown in Figure 8, when the application is launched, the start screen is displayed, and the navigation shows “Press Enter to start”. By pressing the Enter key on the PC, the grading process can be executed.
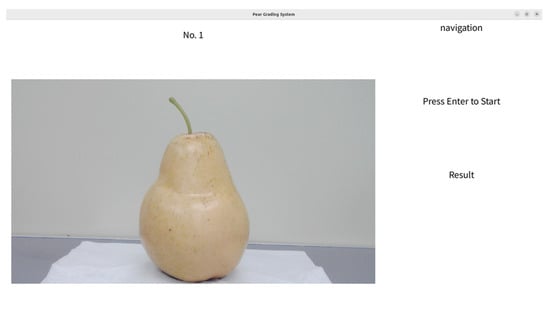
Figure 8.
Start screen.
Pressing Enter allows the application to capture an image of the Pear displayed on the screen. As shown in Figure 9a–c, the navigation displays prompts to press Enter to capture the first, second, and third images of the pear. The Pear is rotated and captured from three different angles. Simultaneously with the Pear capture, the image is transmitted to the edge server for processing with Mask R-CNN.
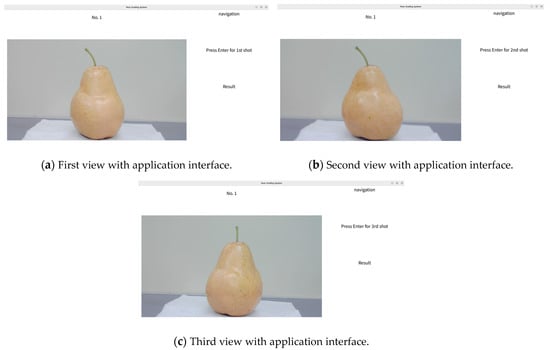
Figure 9.
Capturing the images.
Once the Pear capture is complete, the navigation displays “Calculating”, as shown in Figure 10, and the grading calculation is performed.
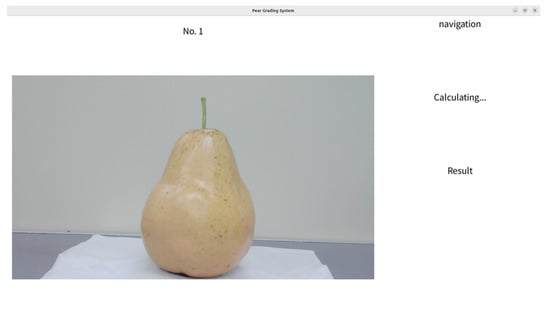
Figure 10.
Screen during grading calculation.
After the grading calculation is finished, the grading results are displayed in the results section, as shown in Figure 11.
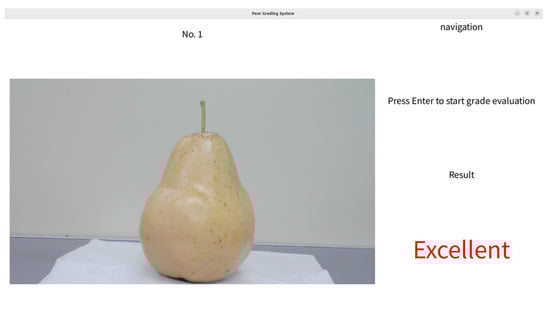
Figure 11.
Screen displaying the grading result.
5.3. Edge Server
The edge server utilized the Jetson Nano Developer Kit B01 (hereafter referred to as Jetson Nano), a compact computer board developed by NVIDIA, which is cost-effective and suitable for implementing edge AI and embedded systems. To implement Mask R-CNN processing on the Jetson Nano, the Triton Inference Server was used. Deploying the Triton Inference Server on the Jetson Nano required converting the Mask R-CNN model into a TensorRT model, so the conversion was performed in advance and implemented accordingly.
The server requires Pear images as input, with an input size of 1333 × 800 pixels. The server outputs include class labels, BBox, and mask information.
The Jetson Nano was set up using JetPack 4.6. The operating system is Ubuntu 18.04.6 LTS, the CPU is a Quad-Core ARM Cortex-A57, and the GPU is an NVIDIA Maxwell GPU. The library used for this implementation is as follows:
- python = 3.6.7;
- mmcv = 2.1.0;
- mmdeploy = 1.3.1;
- mmdet = 3.3.0;
- mmengine = 0.10.5;
- numpy = 1.19.4;
- onnx = 1.10.0;
- opencv-python = 4.10.0.84;
- tensorrt = 8.0.1.6;
- torch = 1.10.0;
- torchvision = 0.11.0.
6. Experiment
In this section, we describe the experiments on the detection accuracy and execution time of the grading support system explained in the previous section. First, we explain the experimental conditions, followed by the results and discussion.
6.1. Experimental Condition
In this research, we conducted experiments using the edge computing-based pear grading support system. The experiments targeted 51 unripe Pears harvested in November 2024 in Sanjo City, Niigata Prefecture. For Pear photography, a USB camera was fixed on a tripod, and a pedestal was prepared to hold Pears in place during image capturing. The images were captured in an environment with an illuminance of 4200 to 4300 lux.
The evaluation of the experiment focused on two aspects: the system’s execution time and the detection accuracy of Pears’ appearance deteriorations. The execution time was measured from the start of the photography process to the output of the results. Detection accuracy was assessed qualitatively by generating images of the inference results obtained using Mask R-CNN.
6.2. Results and Discussion
First, the results for the execution time are described. The proposed pear grading support system reduces the execution time to between 5 and 10 s compared to 30 s in the existing cloud-based system, which corresponds to a reduction of about 70%.
Regarding detection accuracy, appearance deteriorations are successfully identified in 39 out of 51 pears. As shown in Figure 12 and Figure 13, Alternaria and Injury were correctly detected. However, as also shown in Figure 14, some Chemical and Plane were not detected.
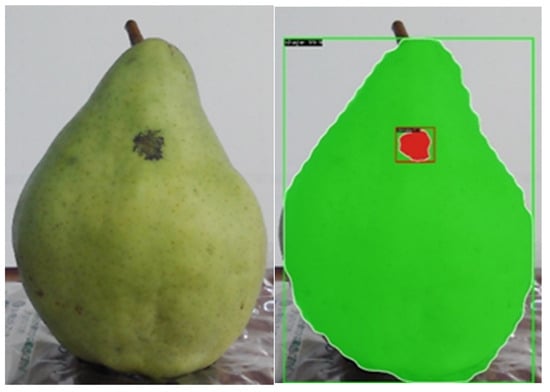
Figure 12.
Image of Alternaria detection.
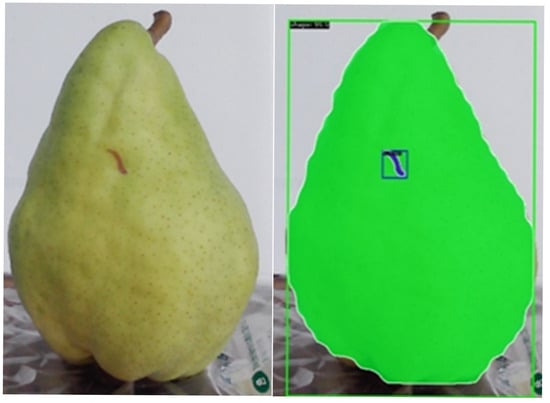
Figure 13.
Image of Injury detection.
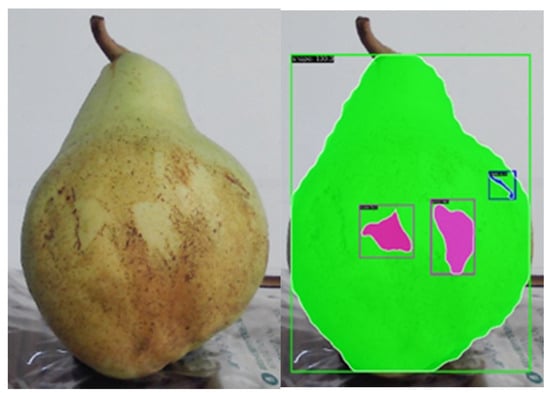
Figure 14.
Image of Plane detection.
This result is likely due to the diverse shape characteristics of these appearance deteriorations and the insufficient training data to detect the wide variety of appearance deteriorations. Additionally, Chemical and Plane blemishes occur less frequently compared to Injury and Speckle, resulting in fewer training data samples. Therefore, the model can be improved by incorporating new Pear images containing Chemical and Plane into the training process.
Currently, Mask R-CNN is used for detection, with ResNet-50 as the backbone for feature extraction. However, ResNet-50 has fixed filter sizes in its convolutional layers, which limits its ability to detect objects with significantly different scales. Additionally, because it relies on local convolutions, it struggles to capture the global context of an image. These two limitations may contribute to the lower detection accuracy of Plane and Chemical blemishes.
To address these issues, using a backbone such as Swin Transformer [7] could be beneficial. Swin Transformer leverages a self-attention mechanism to capture global features, enabling a more comprehensive understanding of the image. Furthermore, its self-attention mechanism allows the receptive field to dynamically adapt, making it more effective at handling variations in object shape and scale. Incorporating Swin Transformer as the backbone could improve the detection accuracy of appearance deteriorations, particularly for Plane and Chemical blemishes.
7. Conclusions
In this research, we proposed a pear grading support system utilizing edge computing to overcome the limitations of a previous cloud-based system. The previous system captured images via mobile devices and detected appearance deterioration using CNNs and texture-based algorithms. However, it faced a significant issue of a long execution time, taking approximately 30 s to process each pear. This delay was particularly problematic in scenarios requiring rapid processing, such as large-scale agricultural facilities that must grade thousands of pears within a short period.
To address this challenge, we developed a system composed of a camera, a PC, and an edge server. The camera captures images of the pears and transmits them to the PC, which provides a user-friendly interface for monitoring and control. The PC then forwards the images to a Jetson Nano edge server where advanced image processing is performed using Mask R-CNN.
By leveraging edge computing with Mask R-CNN and deploying the system on a Jetson Nano edge server, we successfully reduced the execution time to a range of 5 to 10 s, achieving a 70% reduction compared to the cloud-based approach. Furthermore, the proposed system accurately detected appearance deteriorations in 39 out of 51 pears. This improvement makes the system more practical for real-world use, where the rapid grading of tens of thousands of pears is required within a limited timeframe.
The proposed system effectively detected major appearance deteriorations like Alternaria and Injury, enabling accurate grading based on predefined criteria. However, limitations remain in detecting certain blemishes, such as Chemical and Plane, due to the limited variety and quantity of training data for these categories.
In the future, we aim to enhance detection accuracy by expanding the dataset with additional images, particularly focusing on Chemical and Plane. Additionally, we plan to improve detection accuracy by modifying the backbone of the Mask R-CNN model. Furthermore, we plan to develop a grading support system using a fruit sorting machine. Large-scale farms have fruit sorting machines that can automatically sort pears by weight. By utilizing this machine to capture images of the pears as they pass through and automatically classify them based on their grade, it is expected to significantly reduce the workload of sorting tens of thousands of pears. Moreover, by constructing a dataset for other fruits that are graded based on visual inspection, such as Japanese pears and peaches, this system could also be applied.
Author Contributions
Conceptualization, R.I. and T.Y.; methodology, R.I.; software, R.I.; validation, R.I., S.K. and T.Y.; formal analysis, R.I.; investigation, R.I.; resources, T.Y.; data curation, R.I.; writing—original draft preparation, R.I.; writing—review and editing, T.Y.; visualization, R.I.; supervision, T.Y.; project administration, T.Y.; funding acquisition, T.Y. All authors have read and agreed to the published version of the manuscript.
Funding
This research received no external funding.
Institutional Review Board Statement
Not applicable.
Informed Consent Statement
No application.
Data Availability Statement
The data are not publicly available due to restrictions from the producers.
Acknowledgments
I would like to express my heartfelt gratitude to Hiroaki Takano, a pear farmer, for his generous cooperation in providing pear fruits and for his invaluable guidance regarding pears, which greatly contributed to the experiments conducted in this research.
Conflicts of Interest
The authors declare no conflict of interest.
References
- Nakazawa, K.; Yamazaki, T. A Grading Evaluation System for Pear Fruit Appearance Using Deep Learning Methods. In Proceedings of the 13th International Conference on Application of Information Technology in Agriculture Asia-Pacific Region (APFITA), Hanoi, Vietnam, 24–26 November 2022; pp. 296–302. [Google Scholar]
- Krizhevsky, A.; Sutskever, I.; Hinton, G. ImageNet Classification with Deep Convolutional Neural Networks. Adv. Neural Inf. Process. Syst. 2012, 25, 1097–1105. [Google Scholar] [CrossRef]
- He, K.; Gkioxari, G.; Dollar, P.; Girshick, R. Mask RCNN. In Proceedings of the IEEE International Conference on Computer Vision (ICCV), Venice, Italy, 22–29 October 2017; pp. 2961–2969. [Google Scholar]
- Afzaal, U.; Bhattarai, B.; Pandeya, Y.R.; Lee, J. An Instance Segmentation Model for Strawberry Diseases Based on Mask R-CNN. Sensors 2021, 21, 6565. [Google Scholar] [CrossRef] [PubMed]
- Kumar, M.; Chandel, N.S.; Singh, D.; Rajput, L.S. Soybean Disease Detection and Segmentation Based on Mask-RCNN Algorithm. J. Exp. Agric. Int. 2023, 45, 63–72. [Google Scholar] [CrossRef]
- Storey, G.; Meng, Q.; Li, B. Leaf Disease Segmentation and Detection in Apple Orchards for Precise Smart Spraying in Sustainable Agriculture. Sustainability 2022, 14, 1458. [Google Scholar] [CrossRef]
- Liu, Z.; Lin, Y.; Cao, H.; Hu, H.; Wei, Y.; Zhang, Z.; Lin, S.; Guo, B. Swin Transformer. In Proceedings of the IEEE/CVF International Conference on Computer Vision (ICCV), Montreal, BC, Canada, 11–17 October 2021; pp. 10012–10022. [Google Scholar]
Disclaimer/Publisher’s Note: The statements, opinions and data contained in all publications are solely those of the individual author(s) and contributor(s) and not of MDPI and/or the editor(s). MDPI and/or the editor(s) disclaim responsibility for any injury to people or property resulting from any ideas, methods, instructions or products referred to in the content. |
© 2025 by the authors. Licensee MDPI, Basel, Switzerland. This article is an open access article distributed under the terms and conditions of the Creative Commons Attribution (CC BY) license (https://creativecommons.org/licenses/by/4.0/).