Abstract
Aircraft performance metrics such as range and endurance are highly dependent on induced and vortex drag. There is a close relationship between wake structure and aerodynamic performance. In the present paper, the velocity field behind the model of a wing with winglet is studied. The methodology and equipment for study in a low-speed wind tunnel ULAK–1 are presented. The pressure field was obtained using a five-hole pressure probe, which was positioned in a cross plane at 300 mm behind the wing trailing edge. The acquired experimental data are used to calculate the cross flow velocity and vorticity fields at an angle of attack of 6 degrees—around the maximum lift-to-drag ratio. The results are compared to the data of a model with planar wing. During the subsequent processing, coefficients of lift and induced drag can be obtained.
1. Introduction
In experimental studies conducted in wind tunnels, methods utilizing flow parameter data in a control area around the object of interest are commonly employed [1,2,3]. This approach facilitates the determination of the components of aerodynamic drag—namely profile drag, induced drag, and wave drag—and allows for an assessment of how the design parameters of the model influence these components [4].
One study [5] examined the vortex wake of a transport aircraft model featuring a wing with a winglet and two engines mounted on pylons at mid-wing, using a constant-temperature anemometry for measurements across seven planes. The processed data revealed the velocity distribution, the axial component of the vorticity (perpendicular to the measurement plane), and the turbulence intensity, while also establishing the vortex structures in the wake near the model.
Another study [6] explored the effect of the winglet’s dihedral angle on the velocity distribution and wake characteristics of a wing model. This investigation utilized a spatial velocity probe with seven measurement openings to capture the velocity field [7,8]. The wing airfoil tested was NACA 0015, and experiments were conducted at a Reynolds number of 185,000. The results indicated a reduction in the maximum velocity projection in the measurement plane, a decrease in vorticity, and diminished induced drag when employing a wing with a winglet compared to a baseline wing.
In yet another study [9], the equipment, methodology, and findings from an experimental investigation into the near wake of a rectangular wing were presented. A pressure sensor was employed to directly ascertain the velocity circulation in the measurement area, with a grid measurement step of 2 mm. The formation and development of the trailing vortices were also examined [10].
Additionally, equipment that utilizes optical [11,12,13] or ultrasonic measurement methods has been deployed to assess flow parameters in the test section of the wind tunnel. A study [14] investigating the flow in the wake of a rectangular wing shaped with NACA 0012 airfoil was carried out using Particle Image Velocimetry (PIV), a modern optical method increasingly gaining traction. The findings from this study indicate that the flow velocity within the core of the trailing vortex varied according to an exponential law.
The techniques for determining aerodynamic characteristics based on wake parameters are among those utilized in the analysis of wings equipped with wingtip devices and play a crucial role in enhancing the understanding of flow dynamics and evaluating the contributions to induced drag.
This publication introduces the equipment and methodological background of a developed system designed to measure flow parameters within the test section of the wind tunnel at the Laboratory of Aerodynamics in the Plovdiv branch of the Technical University of Sofia. The studies are centered on the assessment of the pressure field using a five-hole pressure probe. Following analysis of the experimental data, the characteristics of the velocity field were obtained. The measurement results for two configurations—a wing with a winglet and a planar wing at an angle of attack of 6°—are presented, along with an overview of the equipment’s capabilities for determining the aerodynamic characteristics of a lifting surface using alternative methods.
2. Materials and Methods
2.1. System for Determining Flow Parameters
An experimental setup was designed and constructed to determine the flow parameters (static pressure, total pressure, magnitude, and direction of velocity) in the test section of a wind tunnel.
The main components of the developed laboratory setup include the following:
- A low-speed wind tunnel with an open test section [15].
- A model positioning mechanism (α-β mechanism).
- A two-coordinate stand for the movement and positioning of a spatial five-hole velocity probe.
- A servo drive equipped with stepper motors and CNC control.
- A module for measuring total pressure, velocity, and flow angles, utilizing a spatial velocity probe and five 24PC differential pressure sensors.
- Measuring and control equipment based on a personal computer, utilizing NI cDAQ—9174, NI 9237, and NI USB—6211 modules.
- Specialized software for processing measurement results in the LabVIEW environment.
This setup allows for the comprehensive analysis of airflow characteristics within the wind tunnel.
The main component of the system is a two-coordinate stand designed for the movement and positioning of a spatial velocity measuring probe within the test section of the aerodynamic wind tunnel (AWT). The moving plane is oriented perpendicular to the direction of the undisturbed flow, with the object of study positioned in front of it (Figure 1).
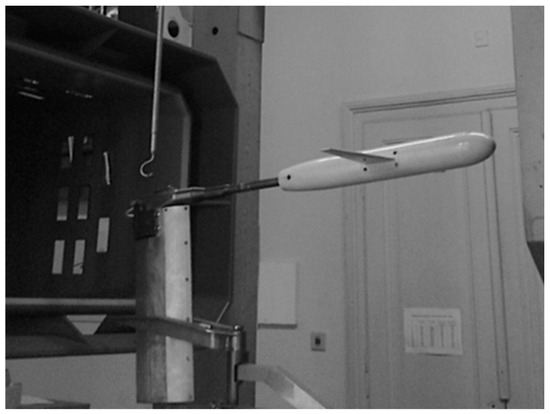
Figure 1.
Location of the model and the velocity measuring probe in the test section of the wind tunnel.
A pressure receiver, connected to a stepper servo drive, can be moved to provide various movement profiles and speeds. The software allows for setting a single position or executing a predefined movement profile.
The mechanical part employs ball screw pairs, cylindrical guides, and ball bushings. The movement range along the horizontal z-axis extends from 0 to 650 mm, while the vertical y-axis ranges from 0 to 400 mm. This configuration enables the measurement of flow parameters at all points across the cross-section of the test area, with a displacement speed of up to 1000 mm/min. The position of the probe within the plane is measured using ELPT position sensors. During experiment, the following parameters are measured: atmospheric pressure (pa), overpressure in the fore chamber of the AWT (pf), pressure readings from the spatial velocity probe (p1–p5), and model positioning, which includes angles of attack (α) and sideslip (β). All measured values are recorded in a file. Control of the system is managed through NI cDAQ—9174, NI 9237, and NI USB—6211 modules, utilizing software developed in the LabVIEW environment.
The model is attached to the positioning mechanism within the test section of the AWT and is set to the appropriate angles of attack and slip by sending control signals from the NI USB–6211 module. Since the spatial velocity probe remains in a fixed position, a device was developed to adjust the model’s distance from this plane.
The software enables the automation of measurements during experiments. To achieve this, the specified movement profile of the pressure probe is executed through digital programming control of the coordinate stand. A software module is in place to read and record measurement results, synchronized with the coordinate stand’s movements via the ELPT position sensors. Pressure readings are taken at predetermined steps along the movement trajectory set previously in the software.
The graphical user interface of the software module (Figure 2) provides real-time information regarding the position of the pressure probe, pressure values, average flow velocity in the test section, and atmospheric pressure. These quantities are recorded in a file and vary based on the coordinates in the displacement plane yOz. The system allows for the continuous measurement of pressures p1–p5, as well as measurements taken upon reaching specific positions within the plane.
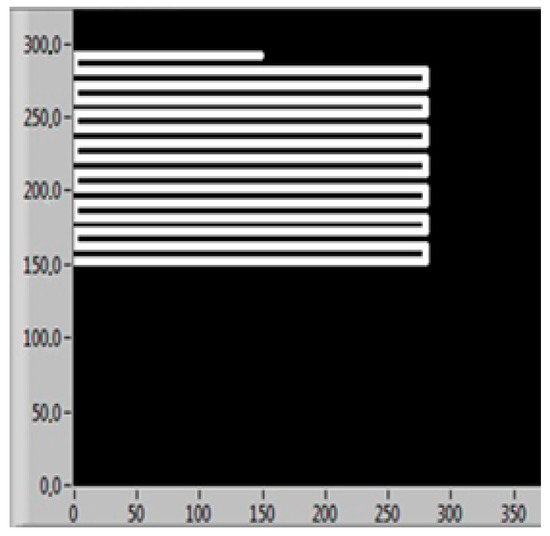
Figure 2.
Path of spherical head probe.
The system utilizes a spatial velocity probe with a spherical head and five pressure holes (Figure 3): a central (p1), two lateral holes in the vertical plane (p2, p3), and two lateral holes in the horizontal plane (p4, p5). The diameter of the sphere is 3.5 mm, and the design angle is 45°. To determine the velocity components Vx, Vy, and Vz, it is essential to calibrate the pressure probe [16,17]. This calibration process involves obtaining functions of the pressure coefficients based on the flow angles α and β within both the horizontal and vertical planes.
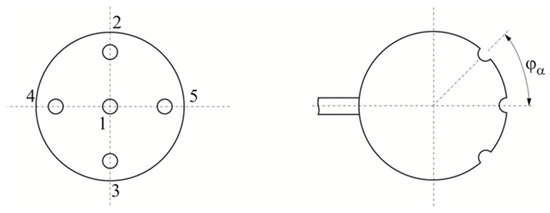
Figure 3.
Layout of the pressure receiver holes.
These coefficients are calculated as follows:
In the dependencies (1)–(4), pt и pst represent the total and static pressures of the undisturbed flow, respectively, while —denotes the arithmetic mean value of the pressures p2–p5. The measured quantities are obtained at the nodes of a rectangular grid defined by the coordinates y and z in the measurement plane.
The processing of the experimental results adopts the following sequence:
1. For each position (z, y), the pressure coefficients Cp,α and Cp,β are determined from the measured pressures p1–p5 using dependencies (1)–(4).
2. Utilizing calibration dependencies and the determined pressure coefficients, the local flow angles α and β in the measurement plane are established.
3. The velocity V and its components in the measurement plane are calculated using the established relationships.
4. The velocity field in the measurement plane is represented graphically, allowing for the determination of the format and location of the vortex wake.
5. Next, the radius of the trailing vortex core and the distance from its center to the plane of symmetry of the model are measured. To identify these characteristics of the wake, the distribution of horizontal and vertical velocity projections within the measurement plane are analyzed. The data are extracted from the graphical representation in areas where there is a quantities transition from maximum positive to maximum negative values of the velocity projections.
6. The axial component of the vorticity ζx is defined:
The results obtained can be used to determine the lift and induced drag coefficients.
2.2. Processing of Experimental Data
When studying the characteristics of the airflow past the wing, the velocity components’ distribution is measured in a specific plane. Typically, the measurement points are arranged in a rectangular, structured grid, which may have constant or varying intervals in both coordinates. The vorticity of the vortex layer is represented by the circulation of the velocity around the corresponding cell in the computational grid (Figure 4).
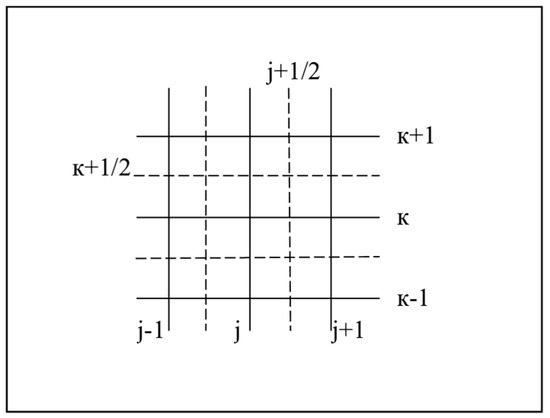
Figure 4.
Scheme of the computational grid.
In the expression above, Δy and Δz denote the grid intervals in the vertical and horizontal directions, respectively. The circulation of velocity around a given computational cell is calculated as follows [18].
2.3. Geometric Characteristics of the Models
The models used in the wind tunnel research were fabricated using Fused Deposition Modeling (FDM) rapid prototyping technology, employing polymers like ABS that are suitable for both prototypes and final products. Before testing, the manufactured parts undergo additional processing to enhance the quality of their surfaces and achieve the required smoothness.
The configuration of the test model is determined by how it is attached in the test section of the AWT. The model features a cylindrical body with a rounded front end and two half wing consoles (Figure 1). The base planar wing has a trapezoidal shape with a span of 400 mm, a root chord of 60 mm, a tip chord of 40 mm, a mean geometric chord of 50 mm, a taper ratio of 1.5, and an aspect ratio of 8. The wing gross area is 0.02 m2, without geometric twist. The cross-sections of both the wing and winglet are constructed from the same airfoils—NACA0012. The model body has a diameter of 56.5 mm and a length of 384 mm.
In the wing with winglet model, the leading edge sweep is increased at the end of the cantilever by 15% of the half-span. The winglet measures 20 mm in length, with chords of 30 mm at the root and 15 mm at the tip, and features a dihedral of 75° (Figure 5).
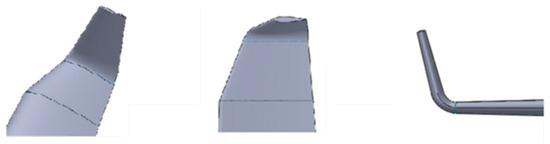
Figure 5.
Wing tip shape with winglet.
3. Results and Discussion
Experiments were conducted using two different wing models. Flow parameter studies were performed with a flow velocity of 20 m/s and a wing angle of attack (α) of 6°. Measurements were taken in a plane located 300 mm behind the trailing edge of the wingtip: specifically in the wake area behind the right half of the wing. The measurement step was set at 10 mm. The following charts present the results of the velocity projections, which help outline and characterize the vortex wake.
In Figure 6, Figure 7, Figure 8 and Figure 9, the coordinates of the measurement points have been recalculated so that the position of the base planar wing is at the level of y = 0 mm, and the model’s plane of symmetry coincides with the coordinates z = 0 mm. Additionally, dimensionless coordinates are employed, using the half-span (l/2) of the planar wing as a parameter.
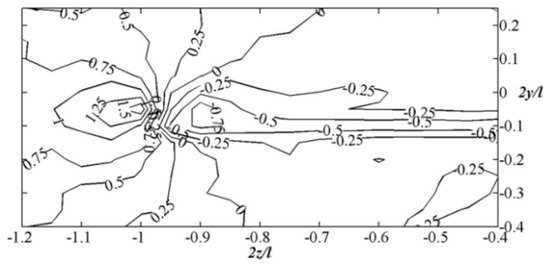
Figure 6.
Distribution of the velocity vertical projection Vy for a planar wing.
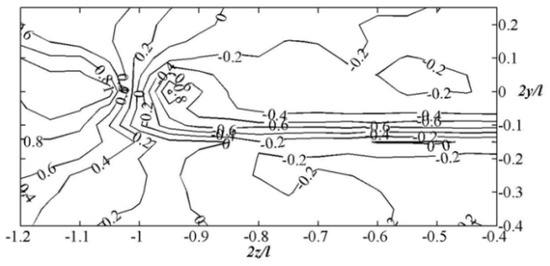
Figure 7.
Distribution of the velocity vertical projection Vy for a wing with winglets.
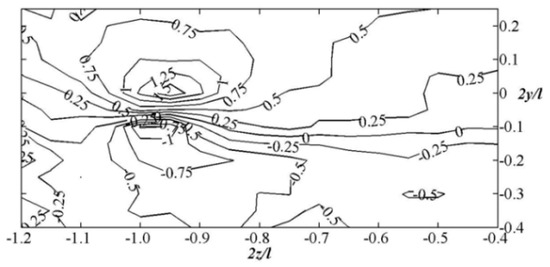
Figure 8.
Distribution of the velocity horizontal projection Vz for a planar wing.
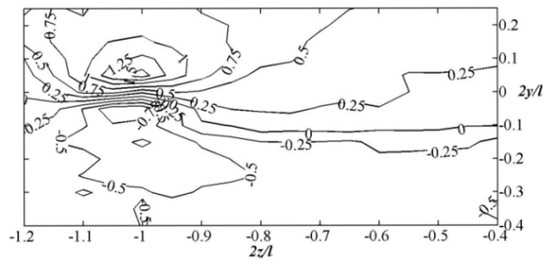
Figure 9.
Distribution of the velocity horizontal projection Vz for a wing with winglets.
The presented data clearly demonstrate the differences in flow behind the two research models. For the wing with the winglet, the wake exhibits a pronounced spatial character. The end vortex zone is positioned higher and is located further from the model’s plane of symmetry.
Using methods and dependencies (10) and (11), the velocity field results for both the base wing and the model featuring the winglet were processed. The distribution of vorticity in the wake for both wing types was obtained (Figure 10 and Figure 11).
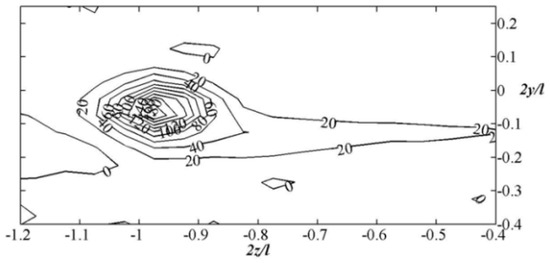
Figure 10.
Distribution of vorticity ζx for the base wing.
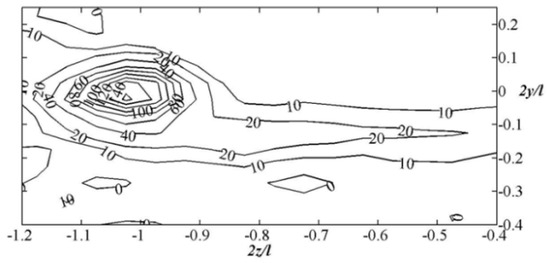
Figure 11.
Distribution of vorticity ζx for a wing with winglets model.
When analyzing the results presented in Figure 10 and Figure 11, it is observed that the vorticity reaches a larger maximum value for the planar wing. In contrast, the vorticity distribution for the wing equipped with a winglet is more uniform. The vortex wake occupies a larger area, and the center of the formed end vortices are positioned farther from the plane of symmetry. There are established theoretical models that describe aerodynamic characteristics based on the circulation of the flow velocity in the wake, the radius of the vortex core, and the distance between the centers of the end vortices [19]. According to these models, an increase in the distance between the end vortices corresponds to an increase in lift and a decrease in the induced drag of the wing. When evaluating different wing models, these results are supported by studies of integral aerodynamic characteristics [20], which indicate an increase in the lift-to-angle of attack ratio, as well as an improved lift-to-drag ratio.
4. Conclusions
The equipment and methodological framework outlined in this publication provide an opportunity to enhance research at the Laboratory of Aerodynamics in the Plovdiv Branch of the Technical University of Sofia. The experimental data can also be utilized to determine the lift force and components of aerodynamic drag. Visualization and quantitative assessment of the flow velocity field are crucial processes in the design of an aircraft and specifically for assessing the aerodynamic efficiency of various wingtip devices. This is an essential area for further research development. Additionally, combining these methods with others, such as Particle Image Velocimetry (PIV), could improve existing vortex wake models and aid in the development of new ones.
Author Contributions
Methodology, software and data analysis—S.P. and H.P.; Data analysis and writing—S.P. and M.Z.; Supervision—H.P. All authors have read and agreed to the published version of the manuscript.
Funding
This research was funded by the European Regional Development Fund within the OP “Research, Innovation and Digitalization Programme for Intelligent Transformation 2021-2027”, Project CoC “Smart Mechatronics, Eco- and Energy Saving Systems and Technologies”, No. BG16RFPR002-1.014-0005.
Institutional Review Board Statement
Not applicable.
Informed Consent Statement
Not applicable.
Data Availability Statement
The data presented in this study are available on request from the corresponding author. The data are not publicly available due to relation to public funding specifics.
Acknowledgments
The authors would like to thank to the National Program “Young Scientists and Postdoctoral Fellows—2” at the Technical University of Sofia for administrative and technical support of the experiments.
Conflicts of Interest
The authors declare no conflict of interest.
References
- Chao, D.D.; Van Dam, C.P. Wing drag prediction and decomposition. J. Aircr. 2006, 43, 82–90. [Google Scholar] [CrossRef]
- Ganzevles, F.L.A.; de Bruin, A.C.; Puffert-Meissner, W. A Quantitative Analysis of Viscous and Lift-induced Drag Components from Detailed Wake Measurements behind Half-Span Model. In Proceedings of the CEAS Aerospace Aerodynamics Research Conference, Cambridge, UK, 10–12 June 2002. [Google Scholar]
- Lanzetta, M.; Mele, B.; Tognaccini, R. Advances in aerodynamic drag extraction by far-field methods. J. Aircr. 2015, 52, 1873–1886. [Google Scholar] [CrossRef]
- Deng, Y.; Zhang, Y.; Chen, H. Drag prediction and decomposition of a real aircraft based on middle-field and far-field methods. In Proceedings of the 7th European Conference for Aeronautics and Space Sciences (EUCASS), Milan, Italy, 3–6 July 2017. [Google Scholar] [CrossRef]
- Alexander, A.; Breitsamter, C. Transport aircraft wake influenced by a large winglet and winglet flaps. J. Aircr. 2008, 45, 686–699. [Google Scholar]
- Gerontakos, P.; Lee, T. Effect of winglet dihedral on a tip vortex. J. Aircr. 2006, 43, 117–124. [Google Scholar] [CrossRef]
- Birch, D.; Lee, T.; Mokhtarian, F.; Kafyeke, F. Structure and induced drag of a tip vortex. J. Aircr. 2004, 41, 1138–1145. [Google Scholar] [CrossRef]
- Lee, T.; Ko, L.S. Vortex wake generated behind a forward swept wing. J. Aircr. 2009, 46, 717–721. [Google Scholar] [CrossRef]
- Lombardi, G.; Skinner, P. Wing tip vortex in the near field: An experimental study. J. Aircr. 2005, 42, 1366–1368. [Google Scholar] [CrossRef]
- Giuni, M. Formation and Early Development of Wingtip Vortices. Ph.D. Thesis, University of Glasgow, Glasgow, Scotland, 2013. [Google Scholar]
- Elsayed, O.A.; Asrar, W.; Omar, A.A.; Kwon, K.; Jung, H. Experimental Investigation of Plain- and Flapped-Wing Tip Vortex. J. Aircr. 2009, 46, 254–262. [Google Scholar] [CrossRef]
- Kaplan, S.M.; Altman, A.; Ol, M. Wake Vorticity Measurements for Low Aspect Ratio Wings at Low Reynolds Number. J. Aircr. 2007, 44, 241–251. [Google Scholar] [CrossRef]
- Britcher, C.; Landman, D. Wind Tunnel Test Techniques; Academic Press: Cambridge, MA, USA, 2023. [Google Scholar]
- Zhang, H.J.; Zhou, Y.; Whitelaw, J.H. Near-field wing-tip vortices and exponential vortex solution. J. Aircr. 2006, 43, 445–449. [Google Scholar] [CrossRef]
- Panayotov, H.; Penchev, S.; Zikyamov, M. Experimental study of turbulence in the test section of wind tunnel. Environ. Technol. Resour. Proc. Int. Sci. Pract. Conf. 2024, 3, 217–220. [Google Scholar] [CrossRef]
- Brune, G.W. Quantitative low-speed wake surveys. J. Aircr. 1994, 31, 249–255. [Google Scholar] [CrossRef]
- Diebold, J.; Bragg, M. Study of a swept wing with leading-edge ice using a wake survey technique. In Proceedings of the 51st AIAA Aerospace Sciences Meeting including the New Horizons Forum and Aerospace Exposition, Grapevine, TX, USA, 7–10 January 2013. AIAA 2013-0245. [Google Scholar]
- Giles, M.B.; Cummings, R.M. Wake integration for three-dimensional flowfield computations: Theoretical development. J. Aircr. 1999, 36, 357–365. [Google Scholar] [CrossRef]
- Penchev, S. Application of various vortex models for determination of wing induced drag. MTM J. 2008, 57–60. [Google Scholar]
- Penchev, S. Wind tunnel study of wing with winglets. Therm. Eng. 2016, 11, 37–40. [Google Scholar]
Disclaimer/Publisher’s Note: The statements, opinions and data contained in all publications are solely those of the individual author(s) and contributor(s) and not of MDPI and/or the editor(s). MDPI and/or the editor(s) disclaim responsibility for any injury to people or property resulting from any ideas, methods, instructions or products referred to in the content. |
© 2025 by the authors. Licensee MDPI, Basel, Switzerland. This article is an open access article distributed under the terms and conditions of the Creative Commons Attribution (CC BY) license (https://creativecommons.org/licenses/by/4.0/).