Article

Revealing the Ion Chemistry Occurring in High Kinetic Energy-Ion Mobility Spectrometry: A Proof of Principle Study

1
Institute for Breath Research, Universität Innsbruck, Innrain 66 and 80/82, 6020 Innsbruck, Austria
2
Institute of Electrical Engineering and Measurement Technology, Leibniz University Hannover, 30167 Hannover, Germany
3
Institute for Ion Physics and Applied Physics, Universität Innsbruck, Technikerstraße 25/3, 6020 Innsbruck, Austria
*
Author to whom correspondence should be addressed.
Analytica 2023, 4(2), 113-125; https://doi.org/10.3390/analytica4020010
Submission received: 17 March 2023 / Revised: 18 April 2023 / Accepted: 19 April 2023 / Published: 23 April 2023

Abstract

:
Here, we present proof of principle studies to demonstrate how the product ions associated with the ion mobility peaks obtained from a High Kinetic Energy-Ion Mobility Spectrometer (HiKE-IMS) measurement of a volatile can be identified using a Proton Transfer Reaction/Selective Reagent Ion-Time-of-Flight-Mass Spectrometer (PTR/SRI-ToF-MS) when operating both instruments at the same reduced electric field value and similar humidities. This identification of product ions improves our understanding of the ion chemistry occurring in the ion source region of a HiKE-IMS. The combination of the two analytical techniques is needed, because in the HiKE-IMS three reagent ions (NO+, H3O+ and O2+•) are present at the same time in high concentrations in the reaction region of the instrument for reduced electric fields of 100 Td and above. This means that even with a mass spectrometer coupled to the HiKE-IMS, the assignment of the product ions to a given reagent ion to a high level of confidence can be challenging. In this paper, we demonstrate an alternative approach using PTR/SRI-ToF-MS that allows separate investigations of the reactions of the reagent ions NO+, H3O+ and O2+•. In this study, we apply this approach to four nitrile containing organic compounds, namely acetonitrile, 2-furonitrile, benzonitrile and acrylonitrile. Both the HiKE-IMS and the PTR/SRI-ToF-MS instruments were operated at a commonly used reduced electric field strength of 120 Td and with gas flows at the same humidities.

Graphical Abstract

1. Introduction

High Kinetic Energy-Ion Mobility Spectrometry (HiKE-IMS) is a relatively new analytical technique that has been developed by Zimmermann’s group in Hannover, (e.g., see Langejürgen et al. [1]). In order to exploit fully the unique analytical capabilities of this new technology, an understanding of the reagent ion–molecule reaction processes occurring in the instrument’s reaction (ion source) region is needed. Toward this goal, an unambiguous identification of the product ions contained in the various ion mobility peaks resulting from the reactions of NO+, O2+• and H3O+ with volatiles of interest is required when operating the instrument at reduced electric fields greater than about 100 Td and under low humidity conditions [2,3,4]. (The reduced electric field is the ratio of the electric field, E, applied, and the buffer gas number density, N, within a drift tube (E/N). The standard unit used for E/N is the Townsend (Td), where 1 Td = 10−17 V cm2.) The value of E/N used, in either the HiKE-IMS or PTR/SRI-ToF-MS, is a crucial operating parameter, because it defines the center-of-mass collisional energy between ions (reagent and product) and neutral species. A mass spectrometer can be coupled to the back-end of a HiKE-IMS system to help identify the product ions resulting in the various ion mobility peaks. However, the coupling is technically demanding, and to date, it has only been achieved using an available ToF-MS with a very low mass resolving power [2]. We have recently measured the mass resolution to be ~60 mm (Full Width Half Maximum (FWHM)) at m/z 117 (protonated acetone dimer). This can make the separation and hence identification of product ions with the same nominal m/z values impossible and for product ions separated by one atomic mass unit challenging. This causes problems, for example, because of the presence of NO+, O2+• and H3O+ in the reaction region (for low humidity conditions and for E/N > 100 Td), which can lead to product ions that cannot be resolved, e.g., MH+ resulting from non-dissociative proton transfer and M+• from non-dissociative charge transfer. Therefore, alternative analytical methods need to be developed to provide the data required for the understanding of the ion chemistry occurring in the ion source region of a HiKE-IMS system, which is the purpose of this paper. We demonstrate in this proof of principle study how that can be achieved through the application of comparing Proton Transfer/Selective Reagent Ion-Time of Flight-Mass Spectrometry (PTR/SRI-ToF-MS) measurements to HiKE-IMS results. NO+, O2+• and H3O+ are the most commonly used reagent ions in not only PTR/SRI- ToF-MS investigations but also in other soft chemical ionization mass spectrometric techniques, such as Selected Ion Flow Tube Mass Spectrometry (SIFT-MS) [5]. There are two main advantages in using a commercial PTR/SRI-ToF-MS. First is its high mass resolving power, which currently has reached a mass resolution of >10,000 mm (FWHM) for m/z > 181 [6], which means that isobaric species can be easily separated. Second, by the use of suitable gases or vapors that are introduced into the ionization source region of the PTR/SRI-ToF-MS in controlled amounts using mass flow controllers, ion chemistry can be taken advantage of to ensure that only one major dominant reagent ion is present. Upon transferring these terminal reagent ions to the drift (reaction) region of the instrument, analyte ionization occurs. Thus, the product ions resulting from the reaction of a single reagent ion species with a neutral volatile species of interest can be investigated that is divorced from the reagent ion situation and hence the chemical complexity of the HiKE-IMS. To illustrate the approach of using PTR/SRI-ToF-MS to provide an understanding of the ion chemistry occurring in the ion source region, which is also the analyte reaction region, of a HiKE-IMS, we report in this paper PTR/SRI-ToF-MS and HiKE-IMS investigations of four nitrile containing organic compounds: namely, acetonitrile (C2H3N), 2-furonitrile (C5H3NO), benzonitrile (C7H5N) and acrylonitrile (C3H3N). Of the four nitrile compounds presented in this paper, to date, HiKE-IMS studies have only been reported for acetonitrile by Allers et al. [7] and Weiss et al. [8].

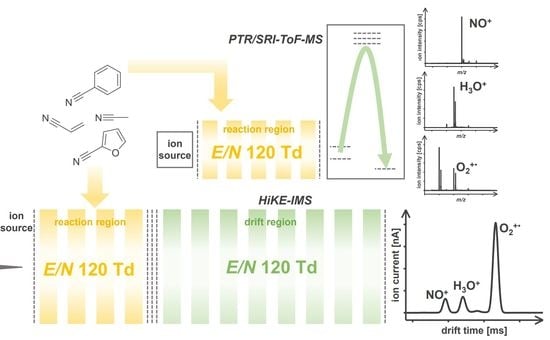
2. Materials and Methods

Measurements on both analytical instruments (HiKE-IMS and PTR/SRI-ToF-MS) were obtained while operating their drift tubes at a reduced electric field strength of 120 Td. In the case of the HiKE-IMS, the drift tube refers to both the ion source and drift regions. The ion source region of the HiKE-IMS is used both for reagent ion generation and for analyte ionization. For PTR/SRI-ToF-MS, the ion source region is separated from the analyte ionization region. It is just used for reagent ion generation. Upon entry into the drift tube, which is the reaction region of the PTR/SRI-ToF-MS, interactions of the reagent ions with the volatiles present in the drift tube may lead to analyte ionization. The selection of a reduced electric field of 120 Td ensures that O2+•, NO+ and H3O+ are all present in the reaction region of the HiKE-IMS in high quantities under low humidity conditions and with no observed clustering of the reagent and product ions with neutral water. Furthermore, for analytical purposes, the choice of 120 Td is appropriate given that the majority of PTR/SRI-ToF-MS analytical measurements are usually performed at operating reduced electric fields of between 100 and 140 Td. We comment that for both HiKE-IMS and PTR/SRI-ToF-MS instruments, NO2+ is always present as an unwanted reagent ion in the reaction regions of the instruments, with the ion being produced in the ion source through the reactions of nitrogen containing ions with background oxygen. However, for the majority of volatiles, its presence in the ion source (analyte ionization) region of the HiKE-IMS or in the reaction (drift tube) region of the PTR/SRI-ToF-MS can be generally ignored. This is because it is either unreactive, owing to its low recombination energy of 9.6 eV or, if reactive, because of its low intensity that can only result a low contribution of any associated product ions to the total product ion signal. Therefore, for the majority of volatiles, it can be safely ignored in terms of product ion identification, which is the case here for the four nitriles investigated.

2.1. HiKE-IMS Dimensions and Operational Details

More detailed descriptions of the operating principles of the HiKE-IMS instrument can be found in earlier publications by Zimmermann’s group [1,2]. This study uses a different HiKE-IMS design than the one used in those earlier publications, which is described by Schlottmann et al. [9]. The important difference is the material used in the construction of the device, with this HiKE-IMS having been manufactured from printed circuit boards. Furthermore, unlike the earlier HiKE-IMS systems, which operated at room temperature, the HiKE-IMS used in this study could be heated, which can be used to reduce clustering effects and memory effects. For convenience, an overview of the key dimensions and standard operating parameters and conditions of the HiKE-IMS used in this study are summarized in Table 1.
Other than for the supplemental data, for the majority of the measurements presented here, the instrument was operated using zero purified air for both the ion source (analyte) and drift region gases. We will refer to the term dry operating gas conditions for measurements that involved using both the analyte and drift air flows at a relative humidity (rH) of about 0% ((<3 ppmv water)). The term humid is used to refer to those small number of measurements we present here that used the analyte gas flow at a humidity of about 100% rH, whilst the drift gas was kept at the dry conditions. A high humidity airflow of the analyte gas was achieved by bubbling the zero purified air through distilled water contained in a wash bottle prior to its introduction into the ion source (reaction) region of the HiKE-IMS.

2.2. PTR/SRI-ToF-MS Operational Details

Ellis and Mayhew have provided detailed descriptions of the PTR/SRI-ToF-MS technology and its analytical applications [10]. Hence, only a brief description of its operating principles is required here. For this study, the PTR/SRI-ToF-MS used to identify the product ions was an extended PTR-ToF 6000 X2 (Ionicon Analytic GmbH, Innsbruck, Austria) [11]. As the name suggests, this instrument has a mass resolving power of approximately 6000 (at m/z 147). This means that peak positions can be accurately measured, which leads to the identification of the molecular structure of the product ions with a high level of certainty. The formation of each dominant reagent ion was achieved by introducing an appropriate gas (or gas mixture) into the hollow cathode ion source of the instrument. Thus, to generate H3O+ as the dominant reagent ion, 6 standard cubic centimeters per minute (sccm) of water vapor was introduced into the ion source. Ionization and fragmentation of H2O and air molecules (which back stream from the drift tube) and a series of ion–water reactions lead to H3O+ becoming the dominant (terminal) reagent ion. For O2+• production, a flow of 6 sccm of medical grade oxygen was introduced into the ion source. From O2, both O2+• and O+• are formed in the ion source, but non-dissociative electron transfer from O2 to O+• leads to O2+• being the terminal and hence dominant reagent ion. To generate NO+ as a reagent ion, we used a mixture of oxygen and nitrogen that were introduced into the ion source at flows of 7 and 2.5 sccm, respectively. Both the oxygen and nitrogen molecules were ionized and fragmented in the ion source, and then, a number of possible ion–molecule pathways led to NO+ production, e.g., N+ + O2 → NO+ + O or O+ + N2 → NO+ + N, so that NO+ became a dominant product ion.

2.3. Nitrile Compounds

Acetonitrile (CAS number: 75-05-8) was supplied from BAKER ANALYZEDTM with a stated purity of 99.8%. 2-Furonitrile (CAS number: 617-90-3) and benzonitrile (CAS number: 100-47-0) were purchased from Sigma Aldrich with a stated purity of 99%. Acrylonitrile (CAS number: 107-13-1) was sourced from Fluka with a stated purity of ≥99.5%. All of these chemicals were used in this study without any further purification.

2.4. Gas Standard Production

Gas samples containing known volume mixing ratios of a given nitrile compound were prepared using 1000 mL glass gas bulbs that were sealed using two valves and a septum. Gas bulbs were evacuated and maintained at a temperature of 60 °C in a drying cabinet (Memmert). For each standard, 0.5 µL of the liquid chemical was injected into a gas bulb using a 5 µL glass syringe (Hamilton®). The gas bulb was then brought to atmospheric pressure by filling the container with dry nitrogen. It was then stored at 60 °C in an oven to prevent condensation of the nitrile. In order to prepare the samples for measurements, a 250 mL syringe (DosysTM 155, Socorex Isba S.A, Ecublens, Switzerland) was connected to a 3-way Luer-lock stopcock (Discofix® C, B.Braun Medical Limited, Melsungen, Germany).
For the HiKE-IMS investigations, the samples were prepared using predominantly dry zero air (using our in-house gas supply, cleaned air being cold-dried). For the PTR/SRI-ToF-MS investigations, syringes were filled with dry and pure nitrogen. The syringes were then spiked with a volume of the gas present in the bulb that contained the required nitrile compound to provide sufficient analyte concentration for analysis, but it was not sufficiently high to result in significant loss of the reagent ion signal. The final volume mixing ratios for each compound investigated using HiKE-IMS (PTR/SRI-ToF-MS) were as follows: acetonitrile 2.1 (2.1) ppmv; 2-furonitrile 1.3 (0.65) ppmv; benzonitrile 1.1 (0.3) ppmv; and acrylonitrile 2.8 (2.8) ppmv.

3. Results and Discussion
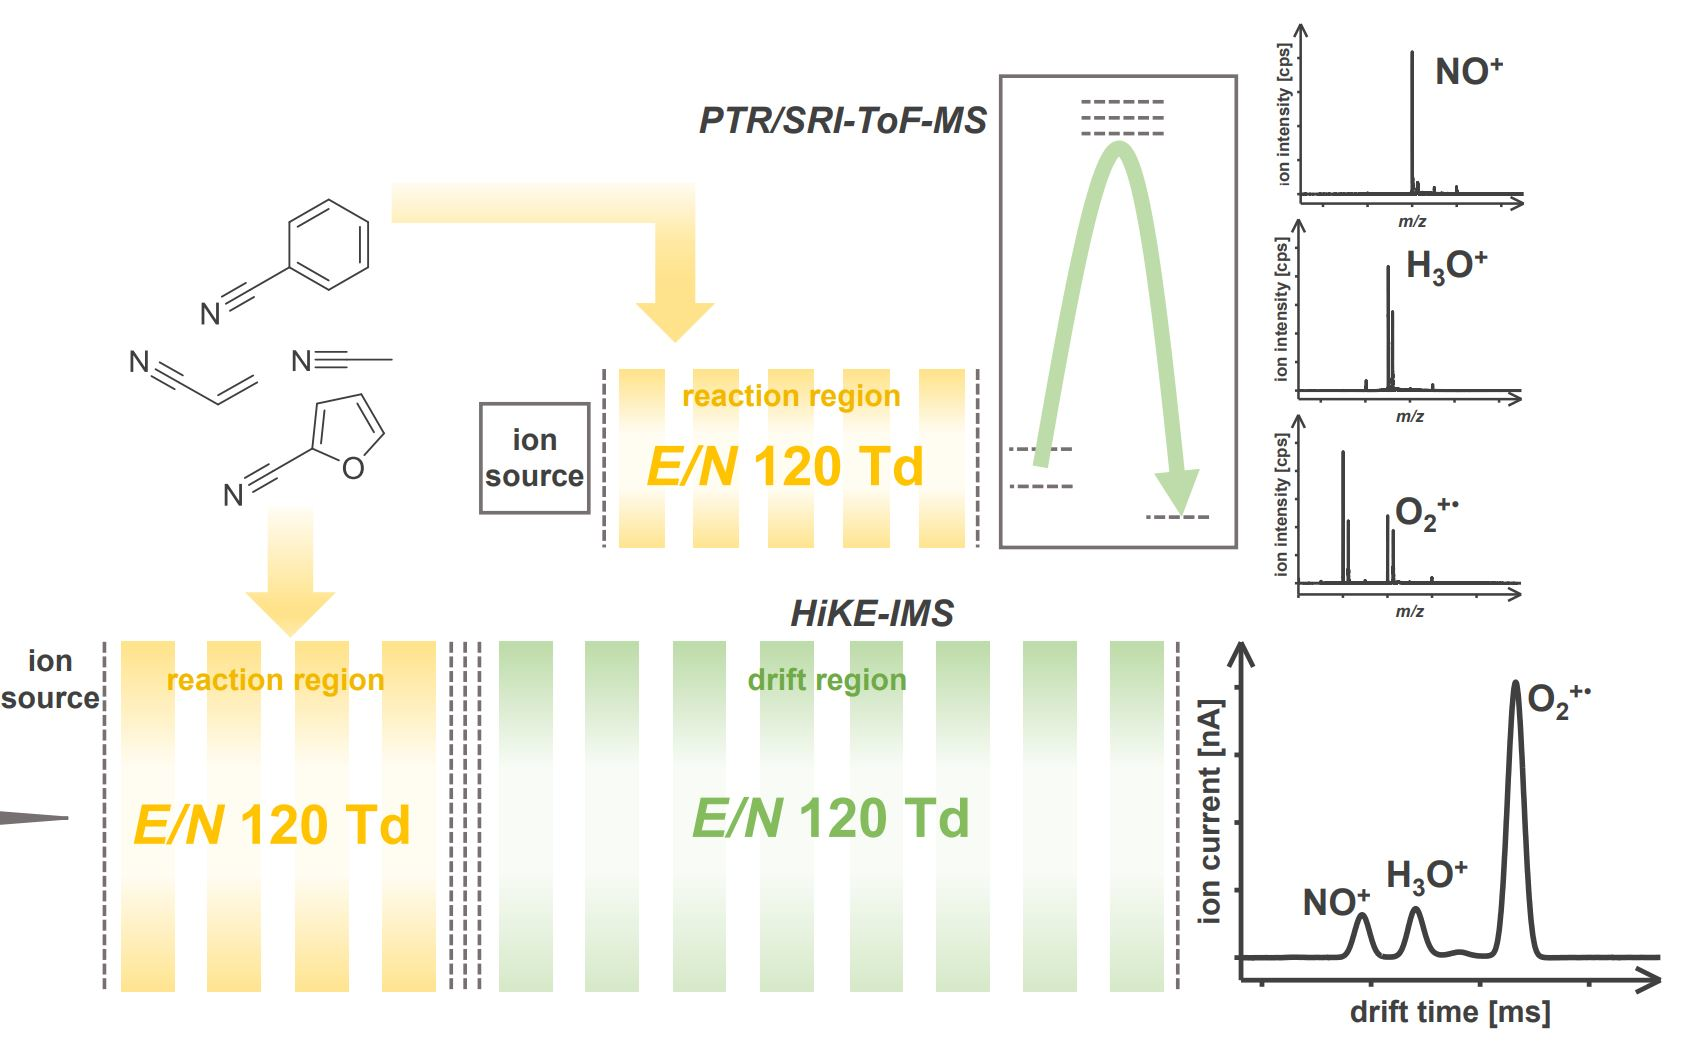
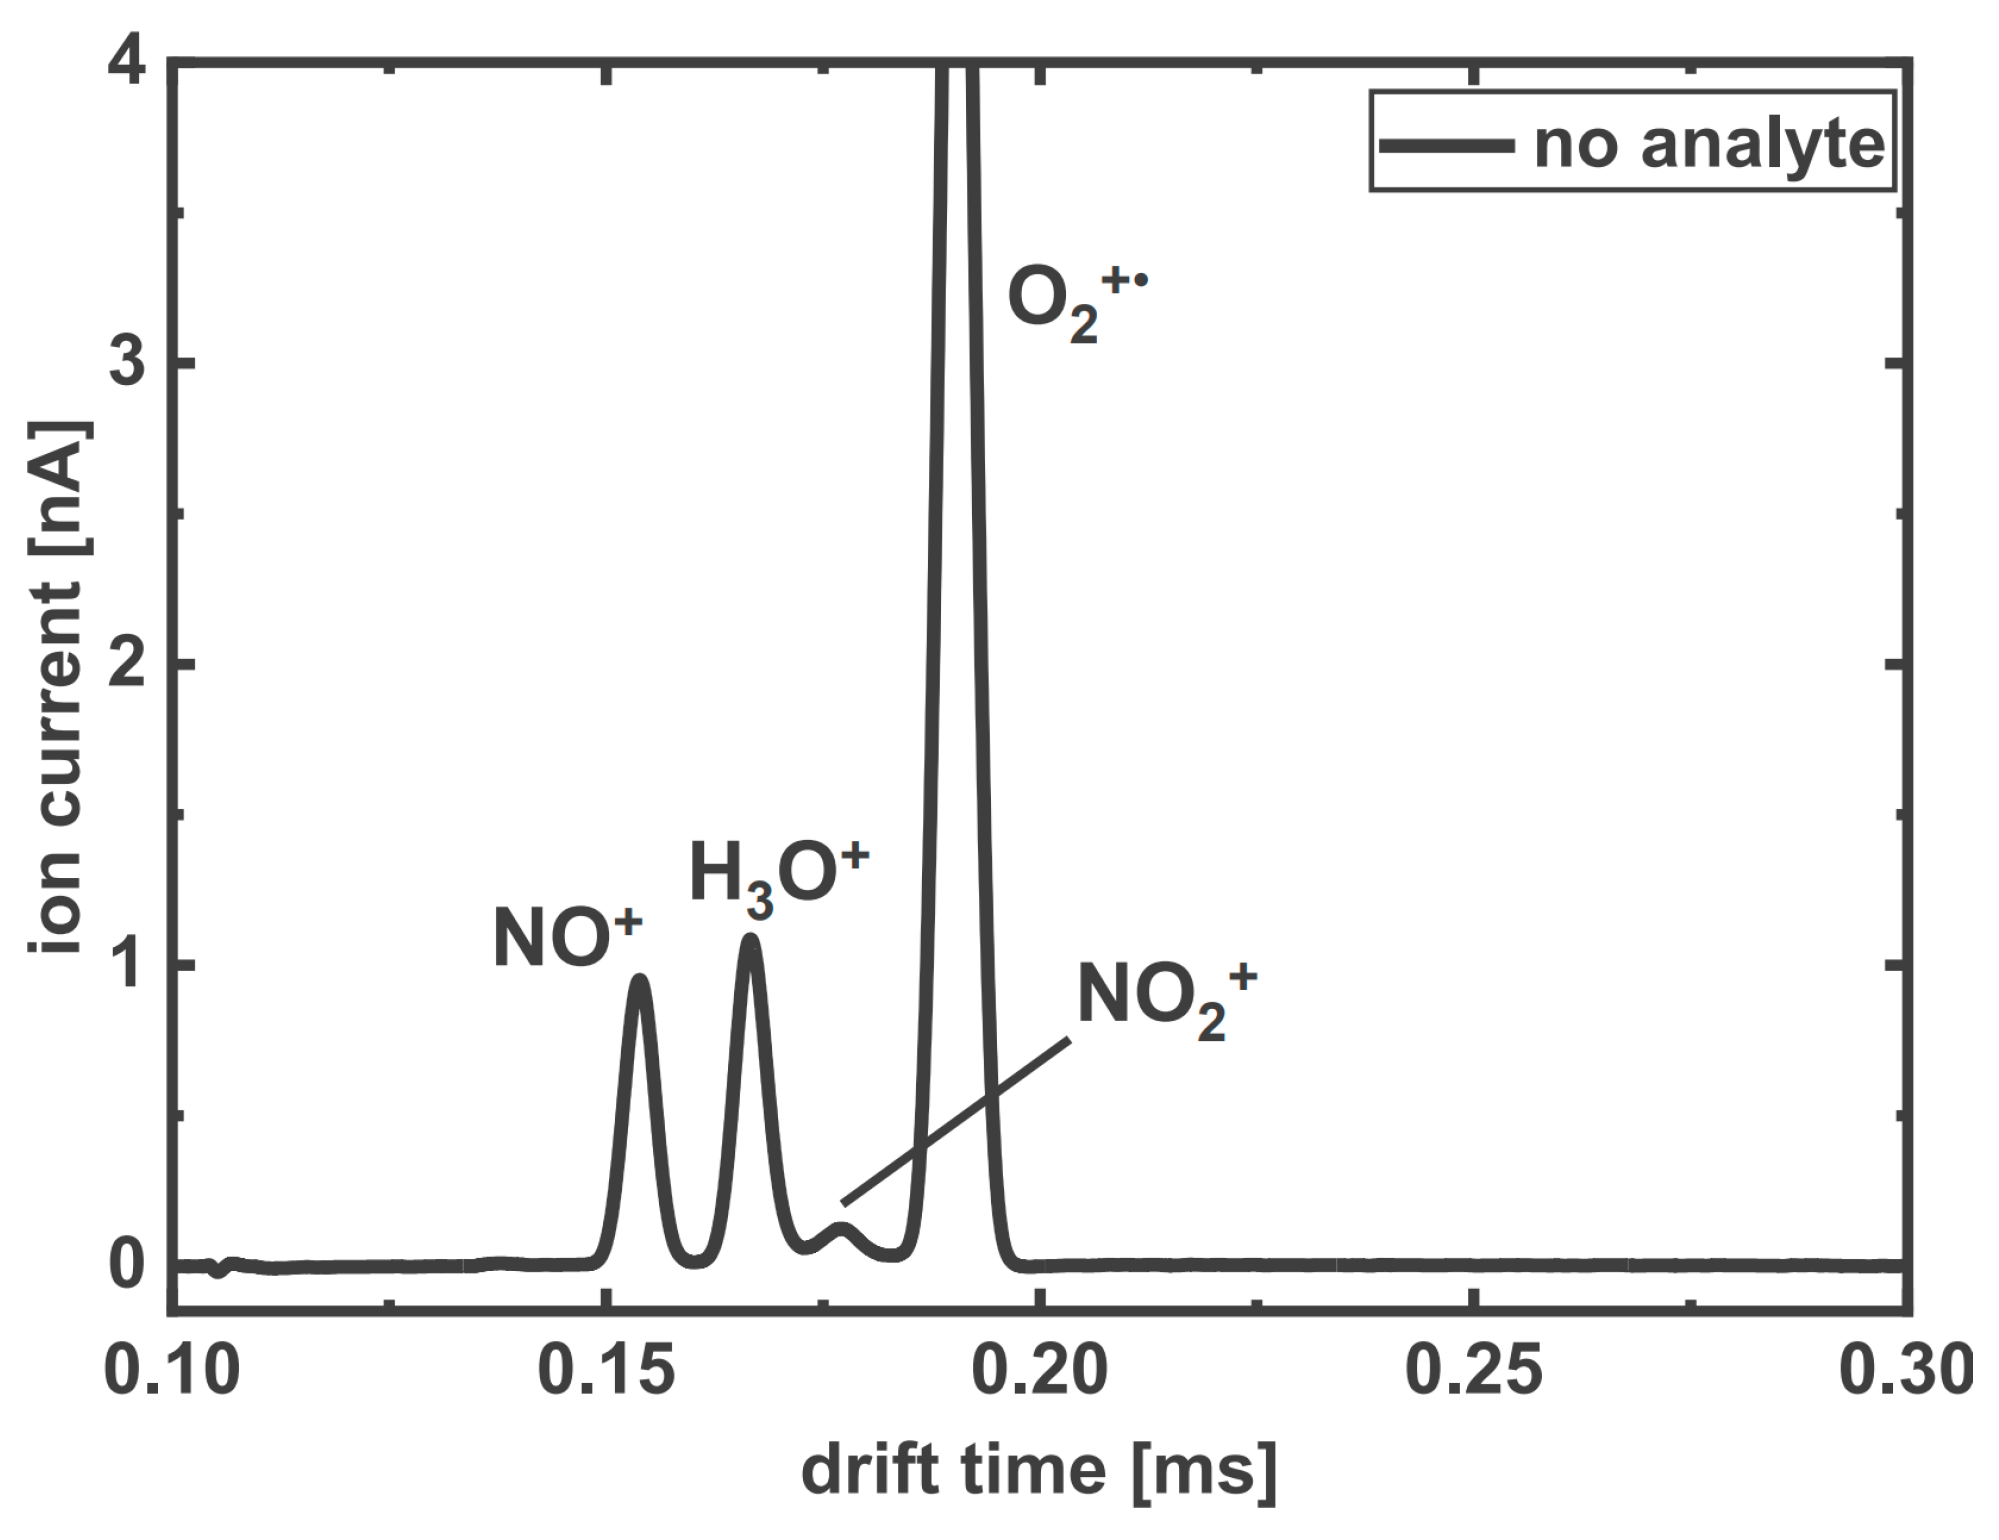
3.1. Reagent Ions

3.1.1. HiKE-IMS Reagent Ions

At a reduced electric field of 120 Td and for a dry analyte gas, the reagent ions in the ion source (reaction region) of the HiKE-IMS are known to be made up of NO+, H3O+ and O2+• [2,3,4]. An illustrative overview of typical ion mobility reagent ion signal intensities recorded in this study at 120 Td under conditions of dry analyte and drift gases is provided in Figure 1, with the reagent ions identified. The drift times of NO+, H3O+ and O2+• are ~ 0.153 ms, 0.166 ms and 0.190 ms. The percentage intensities of NO+, H3O+ and O2+• for the ion mobility spectrum shown in Figure 1 are 11%, 13% and 76%, respectively. Reduced reaction times ensure that the complete conversion of O2+• to H3O+ is prevented (conversion starts around 55 Td [4]), hence causing the high O2+• signals. These intensities are of course very much dependent on the humidity of the flow gases used. At high humidities (rH ~ 80–100%), O2+• is converted to H3O+ (H2O)n (n = 0, 1, 2, 3, …). Correspondingly, under our humidified sample gas conditions and whilst operating at 120 Td, nearly all of the O2+• reagent ions are converted to H3O+, because protonated water clusters are reduced through collisional induced dissociation. Under these operating conditions, we find that the percentages of the precursor ions change to the following: NO+ at 14%, H3O+ at 84% and O2+• at 2%. As mentioned above, another reagent ion, NO2+, is also present in the reaction region. However, and as mentioned above, given that its intensity is much smaller than the other precursor ions, its effect on product ion production is negligible and hence is here not considered further. Further details on their formation and their dependence on the reduced electric field strength and the sample gas humidity have been discussed in detail elsewhere, e.g., Allers et al. [2,3].

3.1.2. PTR/SRI-ToF-MS

Unlike the HiKE-IMS, the ion source region can rely on ion chemistry to insure selectively so that only one reagent ion dominates in the reaction region (drift tube) of the PTR/SRI-ToF-MS. Thus, when introducing only water into the hollow cathode, H3O+ is the dominant (terminal) reagent ion in the drift tube contributing to the total precursor ion signal about 97% (the NO+ and O2+• combined contribution to the total reagent signal is only about 3%). When operating in O2+• mode, the H3O+ and NO+ signals contribute approximately 1% and 6%, respectively, to the total reagent ion signal across the full E/N range investigated [11]. In NO+ mode, H3O+ and O2+• combined contribute less than 2% to the total precursor (reagent) ion signal, and hence, the NO+ contribution to the total reagent ion signal is about 98%. For more details on the operational procedures of the PTR/SRI-ToF-MS used in this study, please refer to our earlier publications [11,12].

3.2. HiKE-IMS Product Ion Mobility Peaks and PTR/SRI-ToF-MS Product Ion Identification

Figure 2a, Figure 3a, Figure 4a and Figure 5a provide examples of typical ion mobility spectra obtained for acetonitrile, 2-furonitrile, benzonitrile and acrylonitrile, respectively, which were obtained using dry zero air gas samples, with the ion mobility peaks that are associated with a given compound highlighted in the figures to differentiate them from the reagent ion mobility peaks. The PTR/SRI-ToF-MS spectra of the four nitrile compounds for the reagent ions are shown as inserts in Figure 2, Figure 3, Figure 4 and Figure 5, with each providing the mass spectrum observed under the different ion modes of operation for (b) NO+, (c) H3O+ and (d) O2+•. It should be appreciated that the SRI-ToF-MS O2+• signals (O2+•-mode) peaks identified in Figure 2b, Figure 3b, Figure 4b and Figure 5b show intensities smaller than that of NO+, which is misleading. This is due to the detector saturation of the 16O16O+• signal. The actual intensity was therefore determined from the unsaturated 16O18O+• peak. Key primary product ions are identified in these figures, which we can assign to given HiKE-IMS ion mobility peaks as discussed below for each nitrile.

3.2.1. Acetonitrile

Only one ion mobility peak at ~0.177 ms (Figure 2a) is found for acetonitrile. This product ion mobility peak overlaps with the ion mobility peak associated with the reagent ion NO2+. The observation of only one ion mobility peak for acetonitrile agrees with earlier HiKE-IMS studies of this compound [7,8]. Acetonitrile’s ionization energy is 12.201 eV [13]. Given that the recombination energies of O2+• and NO+ are 12.07 and 9.26 eV, respectively, charge transfer to acetonitrile is endothermic for these two reagent ions and hence should not be observed. However, in the O2+• mode of PTR/SRI-ToF-MS, a minor signal is observed at m/z 41.028 (Figure 2d), which corresponds to the singly charged parent, C2H3N+• resulting from a non-dissociative electron transfer process from C2H3N to O2+•. The difference of only 0.13 eV needed to drive the charge transfer process is provided in this case by the energy gained by O2+• from the electric field present in the drift tube. However, the back reaction with the far more dominant O2 present in the drift tube of the PTR/SRI-ToF-MS results in C2H3N+• being a minor product ion, which will not result in any ion mobility peak in the HiKE-IMS. The formation of the molecular radical ion cannot fully be excluded since it might be the case that its low intensity is hidden underneath the baseline or is beneath the reagent ions signals. Nevertheless, the results agree with our earlier HiKE-IMS-MS acetonitrile investigation where only the protonated monomer was observed above 100 Td [8]. In addition to this charge transfer product ion, Figure 2d also shows another ion at m/z 42.041, corresponding to (C2H3N)H+, which was formed in this case via protonation from the residual H3O+ ions that were also present in the drift tube in the O2+• mode of PTR/SRI-ToF-MS. Acetonitrile’s proton affinity (PA) is 779.2 kJ mol−1 [14], which means proton transfer from H3O+ is energetically favorable and hence will proceed at the capture rate coefficient [15], leading to (C2H3N)H+ at m/z 42.041. No dissociative proton transfer reaction pathway is observed. Therefore, the PTR/SRI-ToF-MS results agree with and confirm the observation of only one ion mobility peak being associated with the HiKE-IMS measurements of this molecule, which corresponds to the product ion (C2H3N)H+. It is of note that the (C2H3N)H+ signal for acetonitrile in the HiKE-IMS spectrum is relatively weak in regard to the high sample gas volume mixing ratio of 2.1 ppmv used. We comment that the standard production procedure leads to a high uncertainty, especially when the liquid is injected into the evacuated gasbulb. This could result in the calculated volume mixing ratio differing from the one produced. However, as the aim of this study is a proof of principle study, no precisely prepared analyte gas volume mixing ratios are required. The calculated concentrations stated should therefore be regarded with some caution. Importantly, the volume mixing ratios were all sufficient to provide good product ion intensities without limiting the reagent ions.

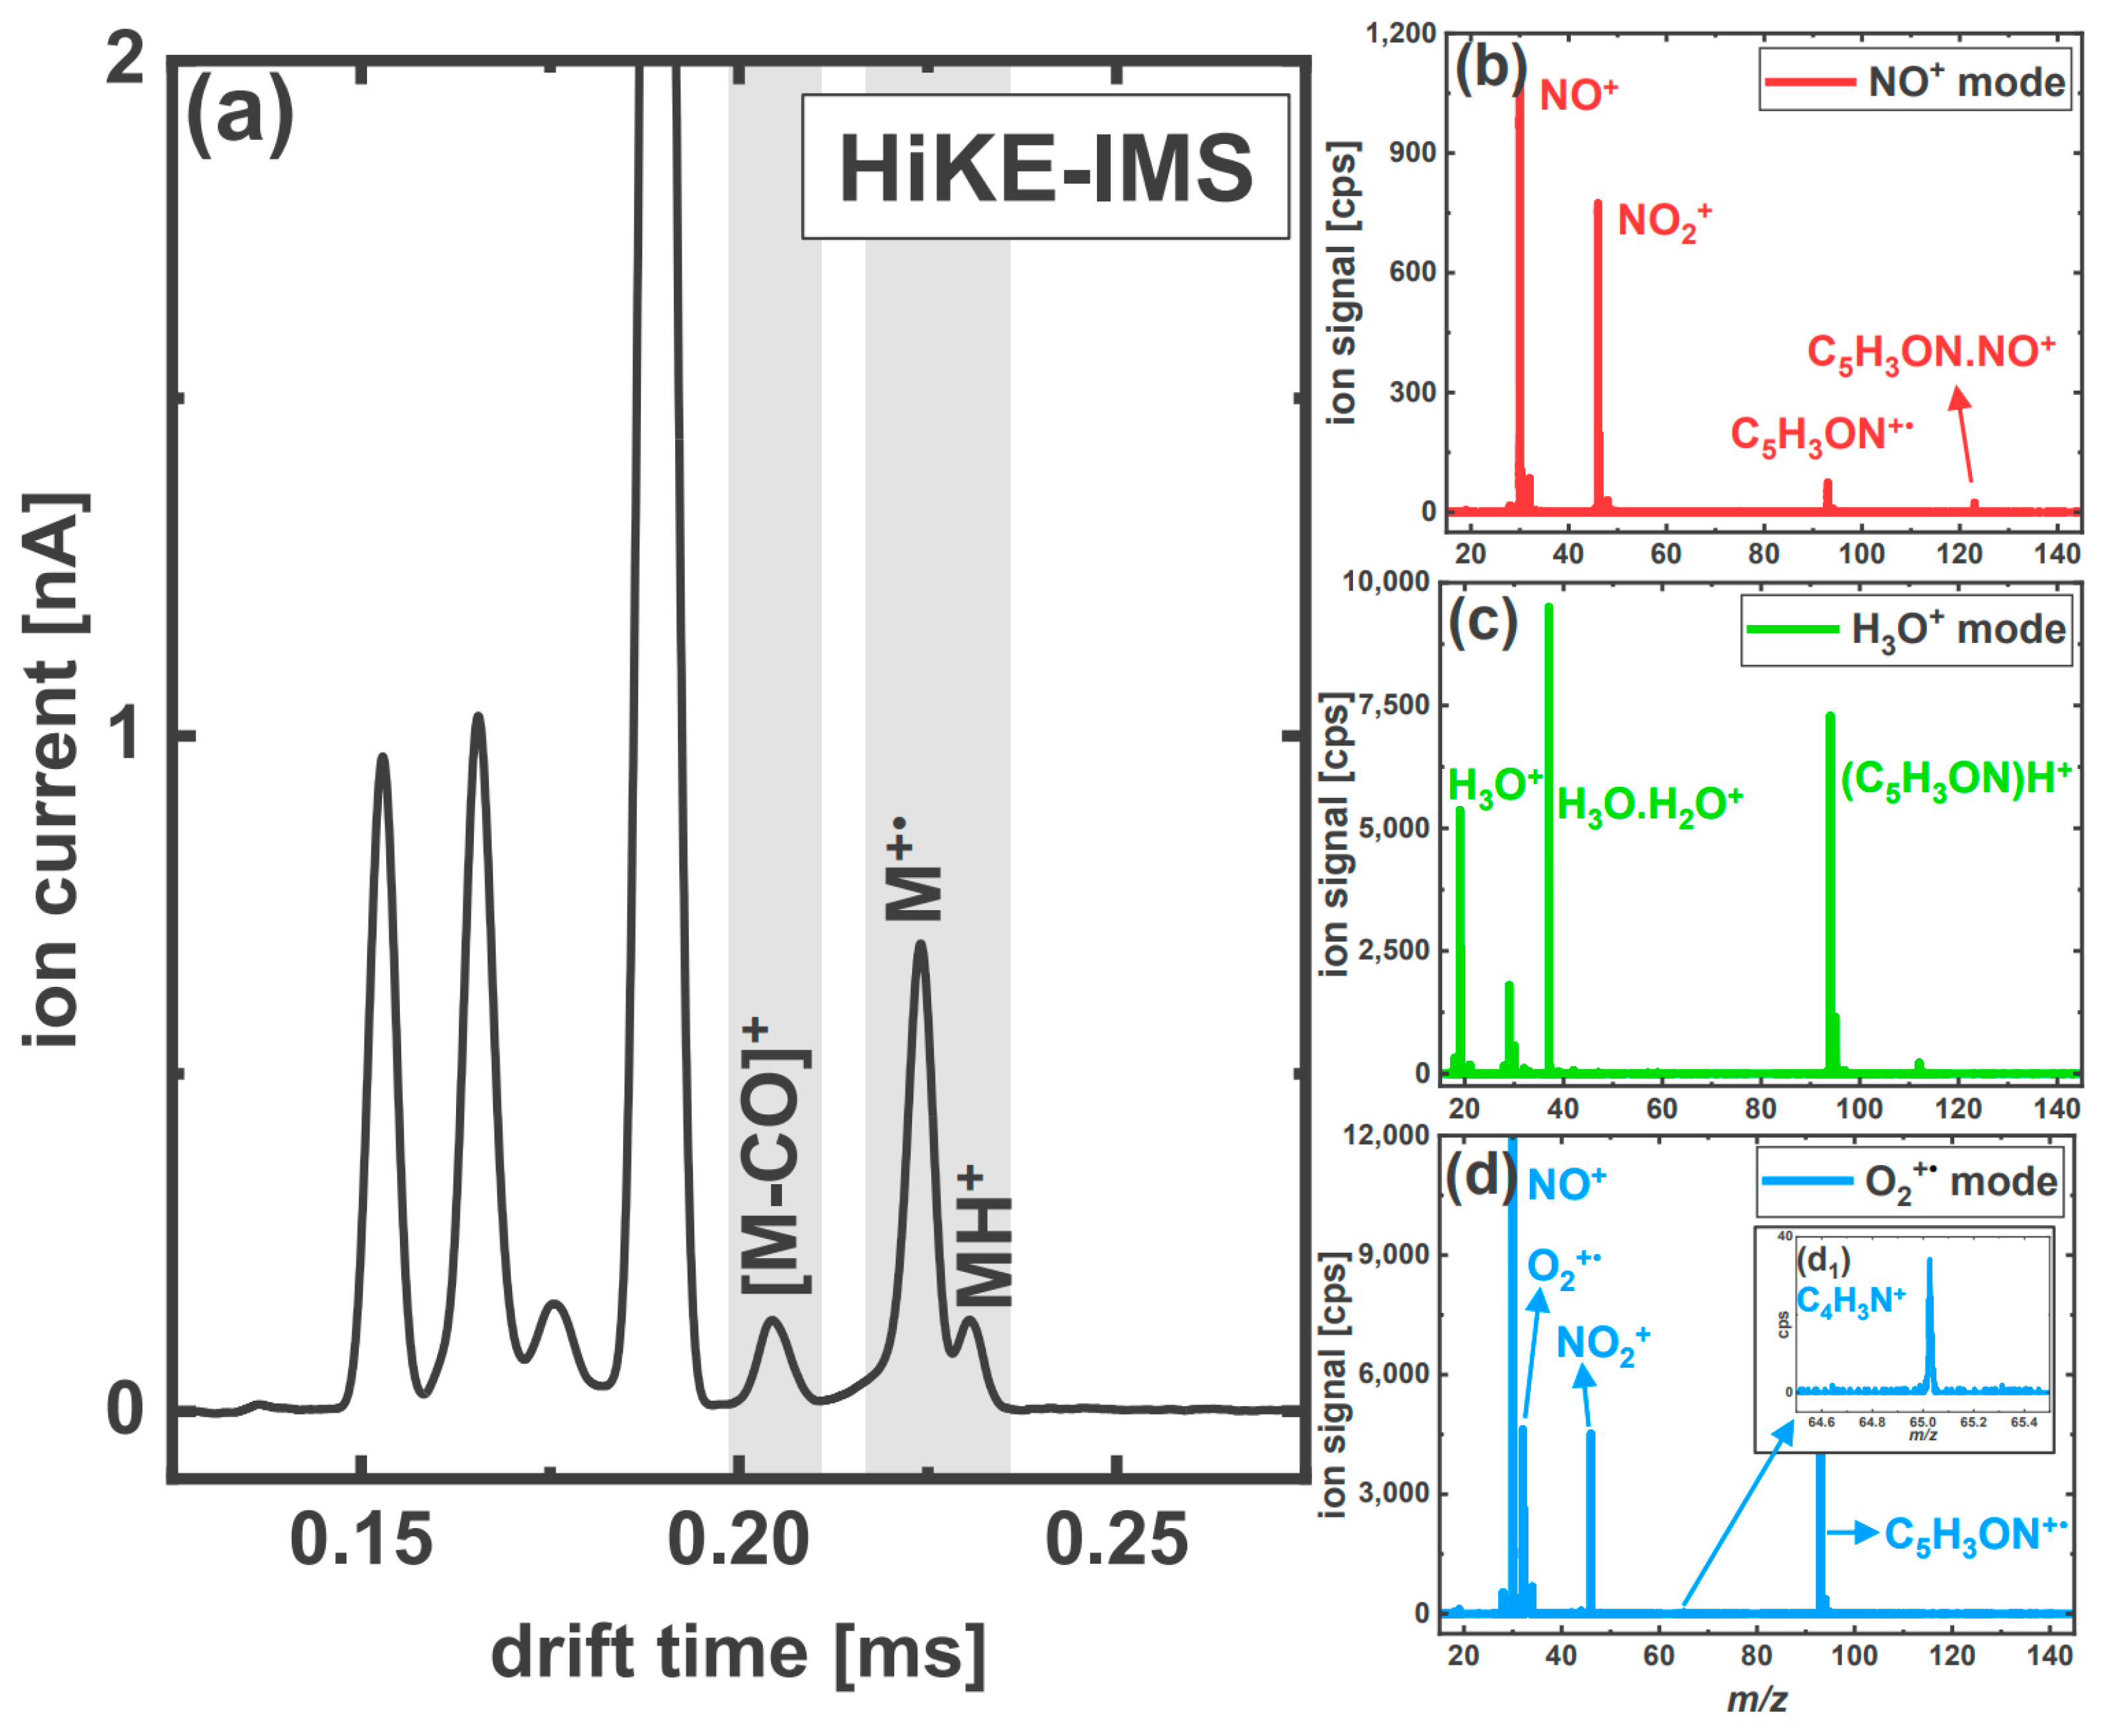
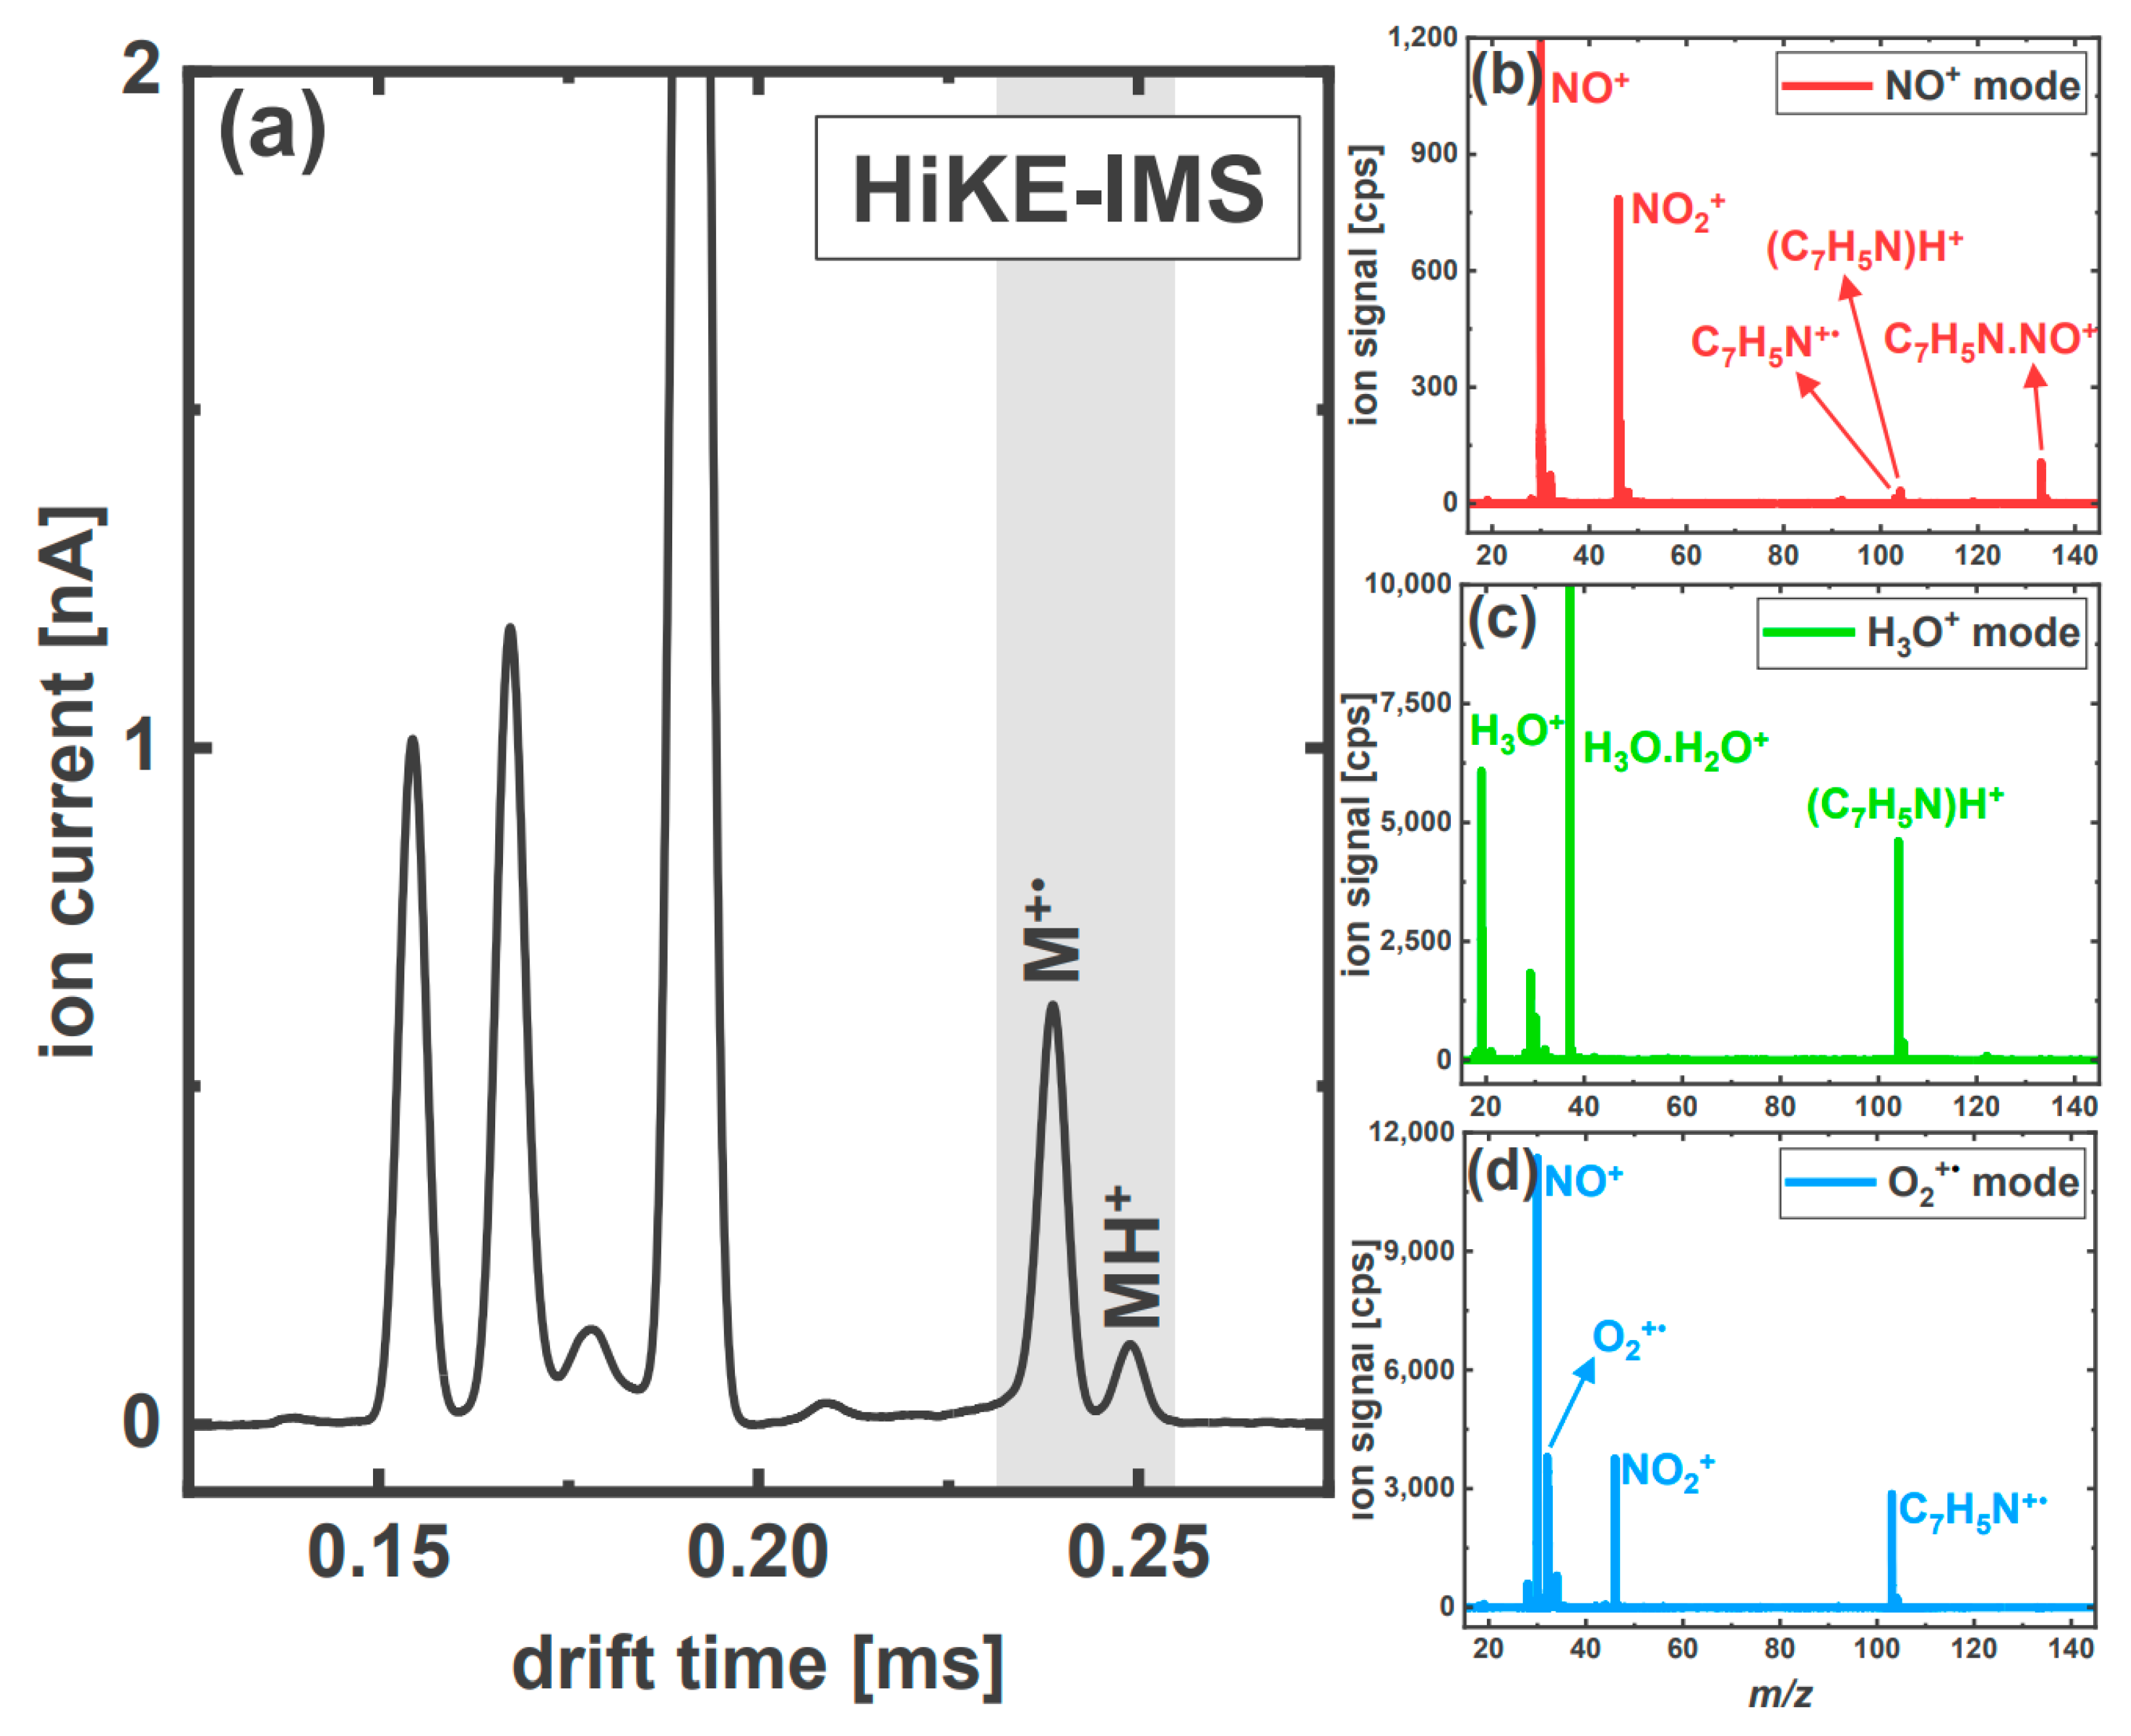
3.2.2. The Aromatic Nitriles: 2-Furonitrile and Benzonitrile

For 2-furonitrile, three ion mobility peaks are present in the ion mobility spectrum of the HiKE-IMS (Figure 3a) at ~0.205 ms, 0.224 ms and 0.231 ms. For benzonitrile, two ion mobility peaks are observed (Figure 4a) at ~0.238 ms and 0.248 ms.
The PTR/SRI-ToF-MS measurements show that NO+ has no significant reaction with 2-furonitrile, which is understandable given that its recombination energy is 0.19 eV below that of 2-furonitrile [16,17]. There are small ion signals observed at m/z 93.023 and m/z 123.022 in Figure 3b, which are assigned to be C5H3ON+• and C5H3ON.NO+, respectively. C5H3ON+• results from a charge transfer process involving NO+, driven by the energy gained by the reagent ion in the electric field, and/or from the small O2+• signal remaining whilst operating in NO+ mode. The other ion results from a simple third body association reaction. However, the intensities of these two ions are insufficient to result in detectable ion mobility peaks in the HiKE-IMS spectrum of this molecule.
The PTR-ToF-MS measurements show that H3O+ reacts with 2-furonitrile via non-dissociative proton transfer resulting in the product ion (C5H3ON)H+ at m/z 94.036 (Figure 3c). Thus, the PA 2-furonitrile must be above that of water (accepted literature value of PA(H2O) = 691 kJ mol−1 [13]). This observation agrees with a very recent theoretical publication that provides for site 5 a PA of 747 kJ mol−1 at 298 K [18]. This has been independently confirmed by us, also at 298 K, using the density function theory calculation that used the Gaussian09W program with the GaussView05 for Windows interface and the B3LYP functional with 6–31 + G(d,p) basis set [19]. Our calculations provided a PA for 2-furonitrile to be 752 kJ mol−1 (c.f., using the same basis set provides the PA of water to be 684 kJ mol−1, which is in excellent agreement with the accepted value of 691 kJ mol−1). The value we give for the proton affinity also corresponds to the fifth position. (We found all other positions have lower proton affinities.) For completeness, the gas basicity of 2-furonitrile was also calculated with a value of 721 kJ mol−1.
The protonated monomer, being the heaviest product ion, results in the HiKE-IMS ion mobility peak observed at a drift time ~0.231 ms. The ion mobility peak with a greater intensity to the left of the protonated 2-furonitrile, at a drift time of ~0.224 ms (Figure 3a), is caused by the molecular ion C5H3ON+• at m/z 93.030, which is formed via a charge transfer process involving only O2+•. This pathway is exothermic given that the ionization energy of 2-furonitrile is 9.45 eV, which is approximately 2.6 eV below the ionization energy of O2. Given the high exothermicity of the charge transfer reaction, it is not surprising that dissociative charge transfer is also observed to occur. A relatively minor ion, in terms of its intensity, is associated with this pathway at m/z 65.028. This is assigned to be C4H3N+, which results from the elimination of CO from C5H3ON+. We comment that the electron ionization mass spectrum of 2-furonitrile given in the NIST database also shows an ion with a nominal m/z value of 65 [20] consistent with our results. This product ion, C4H3N+, results in the ion mobility peak observed at ~ 0.205 ms. This assignment is confirmed from those measurements undertaken under humid conditions (Figure S1) for which the ion mobility peak disappears owing to the near complete depletion of O2+• in the ion source region of the HiKE-IMS. It is noticeable that the signal intensity of C4H3N+ ([M-CO]+) in the HiKE-IMS spectrum in Figure 3a is greater than that for the ion observed in SRI-ToF-MS O2+•-mode; compare Figure 3a with Figure 3d and Figure 3(d1) (insert). This is attributed to the m/z transmission dependence in the ToF-MS that discriminates against lower m/z ions, i.e., the higher intensity signal observed in the HiKE-IMS spectrum should not be interpreted as more fragmentation.
Similar results to those obtained for 2-furonitrile are found for benzonitrile. The PA of this compound is available in the literature as 811.5 kJ mol−1 [14]. Thus, proton transfer from H3O+ to benzonitrile is facile, leading to the protonated parent (C7H5N)H+ at m/z 104.056 (Figure 4c). This is assigned to the HiKE-IMS ion mobility peak with the ion mobility peak that has the largest drift time of ~0.248 ms. To the left of this is another ion mobility peak at ~0.238 ms, which we assign to be a result of charge transfer processes. Charge transfer is energetically possible for O2+• but not for NO+ given that the ionization energy of benzonitrile at 9.73 eV [21], and that is effectively observed from the PTR/SRI-ToF-MS measurements (compare Figure 4b,d). The PTR/SRI-ToF-MS measurements show that the charge transfer involving O2+• is non-dissociative, leading to C7H5N+• at m/z 103.047 (see Figure 4d).
Although electron transfer to NO+ from benzonitrile is endothermic, the energy gained by NO+ in the electric field of the PTR/SRI-ToF-MS drift tube does result in a small signal associated with charge transfer (see Figure 4b). In addition to this product ion, and as observed for 2-furonitrile, adduct formation results in a product ion; this time, it is C7H5N.NO+ at m/z 133.043 (see Figure 4b). However, the intensities of these two ions are also too small to result in observable ion mobility peaks in the HiKE-IMS ion mobility spectra.
The assignment of the product ions originating from the aromatic nitriles to certain ion mobility peaks in the HiKE-IMS spectra is supported by the results obtained under humid sample gas conditions. As mentioned above, as a result of ion–molecule chemistry under high humidity conditions and at 120 Td, the reagent ions are predominantly H3O+ and NO+ (as shown in Figure S1a of Supplementary Material); i.e., there is a shift toward “water ion chemistry” as occurs for standard atmospheric pressure IMS systems operating in positive ion mode. Only a minor contribution in the ion mobility peak spectrum is associated with O2+•. Thus, the intensity ratio between the parent ion and the protonated parent ion mobility peaks in the HiKE-IMS spectrum shifts toward the protonated species (observed for both 2-furonitrile and benzonitrile) (see Figure S1b,c). We comment that in Figure S1b, an additional ion mobility peak is observed for benzonitrile at a drift time of approximately 0.232 ms, which is recognizable as the shoulder of the C7H5N+• peak, the cause of which is not known, but it may result from an impurity in the system.

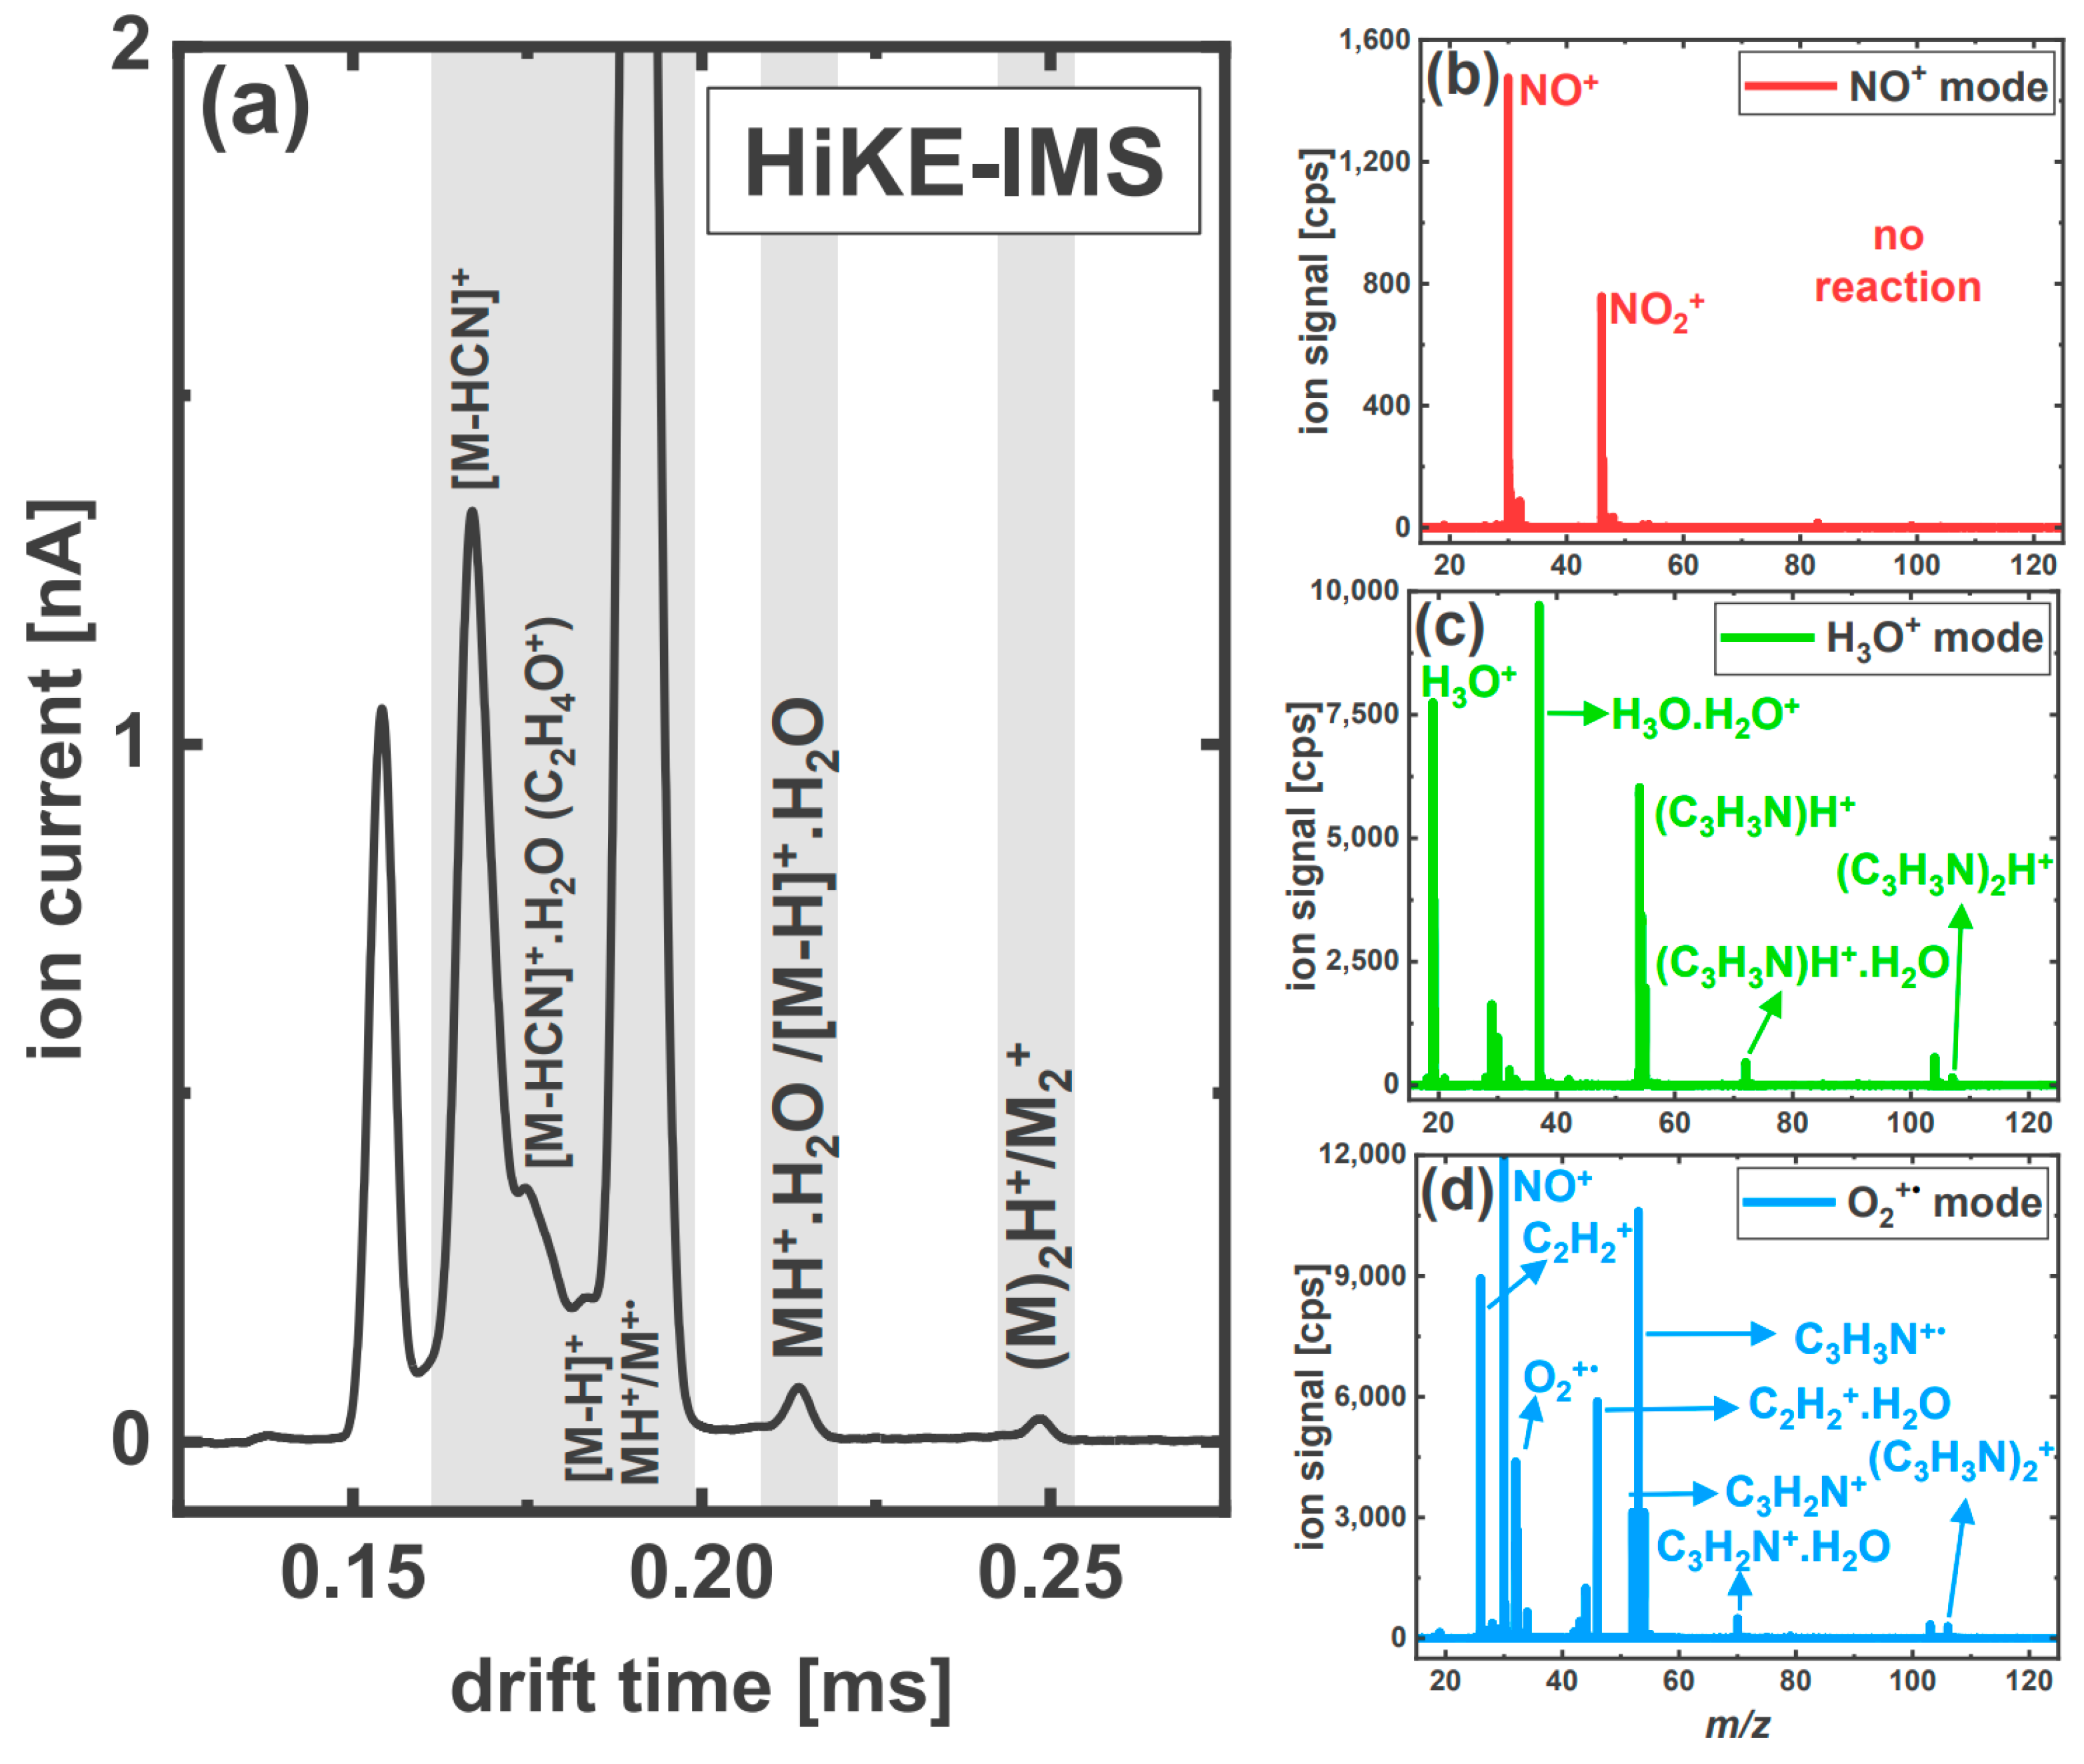
3.2.3. Acrylonitrile

In comparison to the two aromatic nitriles, the HiKE-IMS spectrum for acrylonitrile is more complicated, with six ion mobility peaks identified (Figure 5a), at drift times of ~0.166 ms, 0.172 ms, 0.181 ms, 0.190 ms (twice), 0.213 ms and 0.247 ms. Four of the product ion mobility peaks at ~ 0.167 ms, 0.172 ms, 0.181 ms and 0.190 ms overlap with more intense reagent ion mobility peaks, and hence to provide a more accurate value for the drift times provided, a Gaussian deconvolution was used.
The PTR/SRI-ToF-MS investigations also show that the product ion formation of acrylonitrile (Figure 5b–d for NO+, H3O+ and O2+•, respectively), other than for NO+ mode, is more complicated than that observed for the other nitriles and even more so than the HiKE-IMS spectrum suggests (Figure 5a).
NO+ shows no reaction with acrylonitrile (Figure 5b). This is because the ionization energy of acrylonitrile is 10.91 eV [22]), which is well above that of NO, thereby ruling out charge transfer. In comparison, charge transfer involving O2+• is exothermic. Charge transfer is both non-dissociative, leading to C3H3N+• at m/z 52.033, and dissociative, resulting in the product C2H2•+ at m/z 26.020, which results from the elimination of HCN from C3H3N+• (Figure 5d). One other primary product ion is observed that comes from the reaction of O2+• with acrylonitrile, namely C3H2N+, resulting from a hydride abstraction leading to the formation of HO2. In addition to the primary product ions, an ion is observed at m/z 44.028, which we assign to an associative reaction of C2H2•+ with water, resulting in C2H2•+.H2O, i.e., resulting from a secondary process. Figure 5d also shows that other ions are observed in O2+• mode at m/z values of 70.031, 103.045 and 106.056. We cannot identify the product ion at m/z 103, but the other two are associated with association reactions corresponding to C3H2N+.H2O and (C3H3N)2+, respectively.
The PA of acrylonitrile is 785 kJ mol−1, which means that proton transfer from H3O+ is exothermic, and hence, the reaction proceeds at the collisional rate. Although highly exothermic, only the protonated parent is observed; i.e., no dissociative proton transfer pathways are observed. This results in the dominant product ion being (C3H3N)H+ at m/z 54.034. In addition to this major product ion, other ion signals are observed at m/z values of 72.046 and m/z 107.062 (Figure 5c), which are assigned to be secondary product ions resulting from association of (C3H3N)H+ with water and (C3H3N)H+ with C3H3N, respectively. The ion observed at a m/z 104.053 shown in Figure 5c cannot be assigned to acrylonitrile and therefore must be a result of an impurity in the system.
Given the m/z values of the product ions obtained from the PTR/SRI-ToF-MS investigations, we can assign the ion mobility peaks at drift times of ~0.166 ms, 0.172 ms, 0.181 ms, and 0.190 ms to be associated with the product ions C2H2•+, C2H4O+, C3H2N+ (which overlays the ion mobility peak associated with NO2+), and C3H3N+•/C3H3NH+, respectively. The ion mobility peak at 0.190 ms overlays with that associated with the reagent ion O2+•. This becomes apparent by comparing the dry HiKE-IMS spectra in Figure 5a to the one under humid conditions in Figure S1d. Under humid conditions, the ion mobility peak height at ~0.190 ms (Figure S1d) is significantly higher compared to the humid blank sample Figure S1a.
We suggest that C2H4O+ (C2H2•+.H2O above) is a secondary ion resulting from the reaction of C2H2•+ with residual water in the drift tube forming a covalently bonded species. Given the strength of the signal, we are ruling out a simple association process. We propose that the two ion mobility peaks at ~0.213 ms and 0.247 ms found in the HiKE-IMS measurements also result from secondary product ion–acrylonitrile reactions. Namely, the ion mobility peak at ~0.213 ms corresponds to the associative secondary product ions C3H2N+.H2O and (C3H3N)H+.H2O, and the ion mobility peak at ~0.247 ms results from the dimers, i.e., (C3H3N)2+ and (C3H3N)2H+. It is of note that these two ion mobility peaks do not appear in the humid HiKE-IMS spectra of acrylonitrile in Figure S1d. The only explanation for this is due to secondary processes between water and the product ions. The product ions presumably lose their charge to neutral water which is accompanied with the reduction in the signal. A similar loss of product ion signal intensity at increased water concentrations has also been observed in an earlier HiKE-IMS-MS study, dealing with the production ion formation of fluranes, which is a class of inhalation anesthetics [4].

4. Concluding Remarks

In this paper, we have demonstrated how SRI/PTR-ToF-MS measurements can be usefully used to identify the product ions that make up the individual ion mobility peaks obtained from HiKE-IMS measurements and hence aid in revealing and understanding the ion–molecule reaction chemistry occurring in the ion source region of the HiKE-IMS. An advantage of is that the HiKE-IMS does not have to be coupled to a mass spectrometer for this purpose. Requirements for these comparison studies to be undertaken are that within the drift tubes of the instruments, the same reduced electric field value must be used, and they must be operating under similar humidity conditions. Nevertheless, a simple one-to-one correspondence between those investigations cannot be guaranteed, since all of the three major reagent ions H3O+, NO+ and O2+• are present at the same time at 120 Td in the reaction region of the HiKE-IMS. In conclusion, we have successfully illustrated this approach of comparing PTR/SRI-ToF-MS and HiKE-IMS investigations by providing proof of principle measurements involving four nitriles.

Supplementary Materials

The following supporting information can be downloaded at https://www.mdpi.com/article/10.3390/analytica4020010/s1. Figure S1: HiKE-IMS spectra of (a) zero air introduced into the drift tube at approximately 100% relative humidity (rH) and for zero air containing (b) benzonitrile (1.1 ppmv), (c) 2-furonitrlie (1.3 ppmv) and (d) acrylonitrile (2.8 ppmv). All of the ion mobility spectra were recorded at a reduced electric field value of 120 Td. The ion mobility peaks associated with a given nitrile compound are highlighted.

Author Contributions

F.W. proposed and developed the experimental methods, undertook all of the experiments, analyzed the data, and produced the figures. Together with his PhD supervisor, F.W. was involved in preparing all drafts of the paper. T.D.M. contributed to a number of scientific discussions involving the ion chemistry and was involved in assessing and commenting on the draft paper prior to its submission. S.Z. and C.S. were involved in the hardware development of the HiKE-IMS. C.S. was responsible for setting up the new HiKE-IMS system in the laboratory of the Institute for Breath Research in Innsbruck, Austria. S.Z. and C.S. also provided a number of useful comments on the contents of the paper prior to its submission. C.A.M. supervised F.W. and took the lead in writing all draft versions of the paper. All authors have read and agreed to the published version of the manuscript.

Funding

We wish to acknowledge the EU HORIZON Innovation Actions HORIZON CL3-2021-DRS-01-05, Project Number 101073924 (ONELAB), for funding this project. Open access funding was provided by the University of Innsbruck.

Data Availability Statement

Please contact the corresponding author Florentin Weiss.

Acknowledgments

We wish to thank Peter Watts (Institute for Breath Research) for useful discussions and for undertaking the DFT calculations of the PA and GB values for 2-furonitrile and water.

Conflicts of Interest

The authors declare no conflict of interest. The funders had no role in the design of the study; in the collection, analyses, or interpretation of data; in the writing of the manuscript; or in the decision to publish the results.

References

  1. Langejuergen, J.; Allers, M.; Oermann, J.; Kirk, A.; Zimmermann, S. High Kinetic Energy Ion Mobility Spectrometer: Quantitative Analysis of Gas Mixtures with Ion Mobility Spectrometry. Anal. Chem. 2014, 86, 7023–7032. [Google Scholar] [CrossRef] [PubMed]
  2. Allers, M.; Kirk, A.T.; von Roßbitzky, N.; Erdogdu, D.; Hillen, R.; Wissdorf, W.; Benter, T.; Zimmermann, S. Analyzing Positive Reactant Ions in High Kinetic Energy Ion Mobility Spectrometry (HiKE-IMS) by HiKE-IMS-MS. J. Am. Soc. Mass Spectrom. 2020, 31, 812–821. [Google Scholar] [CrossRef] [PubMed]
  3. Allers, M.; Kirk, A.T.; Eckermann, M.; Schaefer, C.; Erdogdu, D.; Wissdorf, W.; Benter, T.; Zimmermann, S. Positive Reactant Ion Formation in High Kinetic Energy Ion Mobility Spectrometry (HiKE-IMS). J. Am. Soc. Mass Spectrom. 2020, 31, 1291–1301. [Google Scholar] [CrossRef] [PubMed]
  4. Weiss, F.; Schaefer, C.; Ruzsanyi, V.; Märk, T.D.; Eiceman, G.; Mayhew, C.A.; Zimmermann, S. High kinetic energy Ion Mobility Spectrometry—Mass spectrometry investigations of four inhalation anaesthetics: Isoflurane, enflurane, sevoflurane and desflurane. Int. J. Mass Spectrom. 2022, 475, 116831. [Google Scholar] [CrossRef]
  5. Hegan, O.; Gómez, J.I.S.; Schlögl, R. The potential of NO+ and O2+• in switchable reagent ion proton transfer reaction time-of-flight mass spectrometry. Mass Spec. Rev. 2022. [CrossRef]
  6. Available online: https://www.ionicon.com/products/details/ptr-tof-10k (accessed on 13 April 2023).
  7. Allers, M.; Kirk, A.T.; Schaefer, C.; Schlottmann, F.; Zimmermann, S. Formation of positive product ions from substances with low proton affinity in high kinetic energy ion mobility spectrometry. Rapid Commun. Mass Spectrom. 2021, 35, e8998. [Google Scholar] [CrossRef] [PubMed]
  8. Weiss, F.; Eiceman, G.; Märk, T.D.; Mayhew, C.A.; Ruzsanyi, V.; Schaefer, C.; Zimmermann, S. High kinetic energy-ion mobility spectrometry-mass spectrometry investigations of several volatiles and their fully deuterated analogues. Eur. Phys. J. D 2022, 76, 181. [Google Scholar] [CrossRef]
  9. Schlottmann, F.; Kirk, A.T.; Allers, M.; Bohnhorst, A.; Zimmermann, S. High Kinetic Energy Ion Mobility Spectrometry (HiKE-IMS) at 40 mbar. J. Am. Soc. Mass Spectrom. 2020, 31, 1536–1543. [Google Scholar] [CrossRef] [PubMed]
  10. Ellis, A.M.; Mayhew, C.A. Proton Transfer Reaction Mass Spectrometry: Principles and Applications; Wiley: West Sussex, UK, 2014; ISBN 978-1-4051-7668-2. [Google Scholar]
  11. Weiss, F.; Mayhew, C.A.; Ruzsanyi, V.; Lederer, W.; Märk, T.D. A selective reagent ion-time-of-flight-mass spectrometric study of the reactions of O2+• with several volatile halogenated inhalation anaesthetics: Potential for breath analysis. Eur. Phys. J. D 2022, 76, 193. [Google Scholar] [CrossRef]
  12. Malásková, M.; Olivenza-León, D.; Chellayah, P.D.; Martini, J.; Lederer, W.; Ruzsanyi, V.; Unterkofler, K.; Mochalski, P.; Märk, T.D.; Watts, P.; et al. Studies pertaining to the monitoring of volatile halogenated anaesthetics in breath by proton transfer reaction mass spectrometry. J. Breath Res. 2020, 14, 026004. [Google Scholar] [CrossRef] [PubMed]
  13. Gochel-Dupuis, M.; Delwiche, J.; Hubin-Franskin, M.-J.; Collin, J.E. High resolution HeI photoelectron spectrum of acetonitrile. Chem. Phys. Lett. 1992, 193, 41–48. [Google Scholar] [CrossRef]
  14. Hunter, E.P.L.; Lias, S.G. Evaluated Gas Phase Basicities and Proton Affinities of Molecules: An Update. J. Phys. Chem. Ref. Data 1998, 27, 413–656. [Google Scholar] [CrossRef]
  15. Bohme, D.K.; Mackay, G.I.; Schiff, H.I. Determination of proton affinities from the kinetics of proton transfer reactions. VII. The proton affinities of O2, H2, Kr, O, N2, Xe, CO2, CH4, N2O, and CO. J. Chem. Phys. 1980, 73, 4976–4986. [Google Scholar] [CrossRef]
  16. Klapstein, D.; MacPherson, C.D.; O’Brien, R.T. The photoelectron spectra and electronic structure of 2-carbonyl furans. Can. J. Chem. 1990, 68, 747–754. [Google Scholar] [CrossRef]
  17. Reiser, G.; Habenicht, W.; Müller-Dethlefs, K.; Schlag, E.W. The ionization energy of nitric oxide. Chem. Phys. Lett. 1988, 152, 119–123. [Google Scholar] [CrossRef]
  18. Simbizi, R.; Nduwimana, D.; Niyoncuti, J.; Cishahayo, P.; Gahungu, G. On the formation of 2- and 3-cyanofurans and their protonated forms in interstellar medium conditions: Quantum chemical evidence. RSC Adv. 2022, 12, 25332. [Google Scholar] [CrossRef]
  19. Frisch, M.J.; Trucks, G.W.; Schlegel, H.B.; Scuseria, G.E.; Robb, M.A.; Cheeseman, J.R.; Scalmani, G.; Barone, V.; Mennucci, B.; Petersson, G.A. Gaussian 09, Revision A.1; Gaussian, Inc.: Wallingford, CT, USA, 2009. [Google Scholar]
  20. Linstrom, P. NIST Chemistry WebBook; NIST Standard Reference Database 69; NIST: Gaithersburg, MD, USA, 1997. [Google Scholar]
  21. Araki, M.; Sato, S.; Kimura, K. Two-color zero kinetic energy photoelectron spectra of benzonitrile and its van der Waals complexes with argon. Adiabatic ionization potentials and cation vibrational frequencies. J. Phys. Chem. 1996, 100, 10542–10546. [Google Scholar] [CrossRef]
  22. Ohno, K.; Matumoto, S.; Imai, K.; Harada, Y. Penning ionization electron spectroscopy of nitriles. J. Phys. Chem. 1984, 88, 206–209. [Google Scholar] [CrossRef]
Figure 1. HiKE-IMS spectrum of zero air being introduced into the drift tube at approximately 0% relative humidity recorded at a reduced electric field of 120 Td. The reagent ion peaks result from the dominant reagent ions NO+, H3O+, and O2+• as identified, in addition to a lower intensity NO2+ ion mobility peak, at drift times of ~0.153 ms, 0.166 ms, 0.190 ms and 0.177 ms, respectively.
Analytica 04 00010 g001
Figure 2. Acetonitrile spectra from (a) HiKE-IMS measurements and from PTR/SRI-ToF-MS investigations using (b) NO+, (c) H3O+ and (d) O2+• reagent ions. Both instruments were operated at a reduced electric field of 120 Td and with gas flows that used dry zero air to provide similar humidities in the drift tubes. The concentration of acetonitrile used was 2.1 ppmv, which is low enough not to deplete the reagent ion signals. The ion mobility peak associated with acetonitrile (M) is highlighted by the vertical shading.
Analytica 04 00010 g002
Figure 3. 2-Furonitrile spectra from (a) HiKE-IMS measurements and from PTR/SRI-ToF-MS investigations using (b) NO+, (c) H3O+ and (d,d1) O2+• reagent ions. Both instruments were operated at a reduced electric field of 120 Td and with gas flows that used dry zero air to provide similar humidities in the drift tubes. The concentrations of 2-furonitrile used were 1.3 ppmv (HiKE-IMS) and 0.65 ppmv (PTR/SRI-ToF-MS), which are low enough not to deplete the reagent ion signals. The ion mobility peaks associated with 2-furonitrile (M) are highlighted by the vertical shading.
Analytica 04 00010 g003
Figure 4. Benzonitrile spectra from (a) HiKE-IMS measurements and from PTR/SRI-ToF-MS investigations using (b) NO+, (c) H3O+ and (d) O2+• reagent ions. Both instruments were operated at a reduced electric field of 120 Td and with gas flows that used dry zero air to provide similar humidities in the drift tubes. The concentrations of benzonitrile used were 1.1 ppmv (HiKE-IMS) and 0.3 ppmv (PTR/SRI-ToF-MS), which are low enough not to deplete the reagent ion signals. The ion mobility peaks associated with benzonitrile are highlighted. The ion mobility peaks associated with benzonitrile (M) are highlighted by the vertical shading. A small ion mobility peak at approximately 0.209 ms is attributed to an impurity in the sample.
Analytica 04 00010 g004
Figure 5. Acrylonitrile spectra from (a) HiKE-IMS measurements and from PTR/SRI-ToF-MS investigations using (b) NO+, (c) H3O+ and (d) O2+• reagent ions. Both instruments were operated at a reduced electric field of 120 Td and with gas flows that used dry zero air to provide similar humidities in the drift tubes. The concentration of acrylonitrile used was 2.8 ppmv, which is low enough not to deplete the reagent ion signals. The ion mobility peaks associated with acrylonitrile (M) are highlighted by the vertical shading.
Analytica 04 00010 g005
Table 1. Key dimensions and operating parameters of the HiKE-IMS used in this study.
reaction region length49 mm
drift region length149 mm
corona voltage1200 V
E/N—reaction region120 Td
E/N—drift region120 Td
IMS pressure17 mbar
IMS temperature60 °C
drift gas flow12 mLs/min
analyte gas flow18 mLs/min
injection time3 µs
temperature of inlet capillary100 °C
Disclaimer/Publisher’s Note: The statements, opinions and data contained in all publications are solely those of the individual author(s) and contributor(s) and not of MDPI and/or the editor(s). MDPI and/or the editor(s) disclaim responsibility for any injury to people or property resulting from any ideas, methods, instructions or products referred to in the content.

