1. Introduction
The continued operation and potential power uprates of the U.S. light water reactor (LWR) fleet demand a shift from traditional prescriptive safety criteria toward performance-based metrics. One of the leading approaches under investigation is the use of time-at-temperature thresholds [
1] to evaluate fuel cladding performance during limiting transient events. This strategy seeks to allow for temporary dryout and re-wet of the fuel during limiting transients, assuming that it can be shown that the temperature transient will not lead to fuel failure or inhibit the future performance of the fuel. Utilizing this strategy instead of the current strategy of complete avoidance of critical heat flux (CHF) will allow for more flexible operations, power uprates, and improved operational economics for the current fleet of LWRs. This paradigm shift introduces a critical need for advanced modeling and simulation tools that can accurately capture the complex interplay of multiphysics phenomena that occur in nuclear reactors during such events. Among the transients of interest, the boiling water reactor (BWR) turbine trip is notable because of its rapid and significant reactivity insertion driven by void collapse, which challenges both neutronic and thermal hydraulic modeling capabilities.
The Peach Bottom turbine trip (PBTT) benchmark [
2,
3] provides a rigorous test case for validating the accuracy of simulation tools. The benchmark is based on a well-documented transient event that occurred on 28 April 1977, in a General Electric (GE) Type-4 BWR [
4]. This event has been used in multiple international code comparisons coordinated by the OECD/NEA to assess the accuracy and robustness of various modeling approaches and tools [
5,
6,
7,
8]. The PBTT benchmark includes detailed data for both steady-state and transient conditions, allowing for separate and integral validation of simulation tools. Moreover, the benchmark is structured in a way that isolates in-core behavior from system-level effects, offering a controlled environment for assessing core physics models under challenging conditions.
In this study, the Virtual Environment for Reactor Applications (VERA) [
9], developed by the U.S. Department of Energy’s (DOE’s) Consortium for Advanced Simulation of Light Water Reactors (CASL) energy innovation hub and now incorporated into the Nuclear Energy Advanced Modeling and Simulation (NEAMS) program, is employed to develop and validate a high-fidelity model of Peach Bottom Unit 2 (PB2). VERA integrates high-resolution neutron transport with subchannel-scale thermal hydraulics, depletion modeling, and feedback effects, making it a suitable candidate for simulating complex LWR transients. The focus of the work is on Exercise 2 of the PBTT benchmark, which evaluates the reactor core’s response from steady-state “hot power” conditions through the turbine-trip transient. Core boundary conditions, such as inlet temperature, mass flow rate, and outlet pressure, are prescribed by benchmark organizers, allowing the study to concentrate on the fidelity of in-core physics models.
The objectives of this work are threefold: (1) to demonstrate VERA’s capability in performing high-fidelity, pin-resolved simulations of a turbine-trip transient, (2) to compare its predictions against benchmark data and the results of other international participants, and (3) to lay the groundwork for further analysis involving dryout and re-wet phenomena during this class of transients; this further analysis will include fuel performance modeling using BISON [
10] and uncertainty quantification (UQ) analysis of the solution. The simulation results presented here show strong agreement with benchmark averages in key metrics such as core reactivity and power excursion timing/magnitude. Our findings support the use of VERA for high-fidelity best-estimate evaluations and provide a validated foundation for future studies that will further investigate this type of transient.
Moreover, this work contributes to NEAMS programmatic goals that aim to develop validated, predictive modeling and simulation tools that support the nuclear industry in deployment of the time-at-temperature strategy.
2. Materials and Methods
This study employed VERA (2025, ORNL, Oak Ridge, TN, USA) to perform high-fidelity simulations of the PBTT benchmark. VERA integrates several multiphysics components, including neutron transport, fuel depletion, thermal hydraulics, and reactor kinetics, allowing for tightly coupled, full-core simulations of reactor behavior under both steady-state and transient conditions.
2.1. Reactor Model Setup
The reactor modeled in this work corresponds to the PB2 BWR, a GE Type-4 reactor with 764 fuel assemblies, (during the time of the benchmark) a rated thermal power of 3293 MWth, and a rated core flow of 102.5 Mlb/h [
4]. A radial cross section of this core is shown in
Figure 1.
The benchmark transient of interest, a turbine trip, was performed on 28 April 1977, near the end of cycle 2 [
2]. The operating conditions and plant data from the turbine-trip exercises were later used to organize a benchmark exercise in the early 2000s [
3]. The VERA model is based on the core design and operating data provided in the Electric Power Research Institute (EPRI, Palo Alto, CA, USA) report [
4] and follows the specifications outlined in the benchmark [
3]. Additionally, this model was built primarily on a previously available PB2 VERA model used for depletion validation [
11].
2.2. Neutronics and Depletion Modeling
The simulation domain consists of a full-core 3D neutron transport model using 51 energy groups with
scattering and using the subgroup method [
12] for increased accuracy. The VERA neutronic solver is MPACT [
13], which resolves neutron fluxes and reaction rates at an intra-pin level. Depletion calculations were performed using VERA’s coupled neutronics and depletion capability provided by the Oak Ridge Isotope GENeration (ORIGEN) module, which is part of the SCALE [
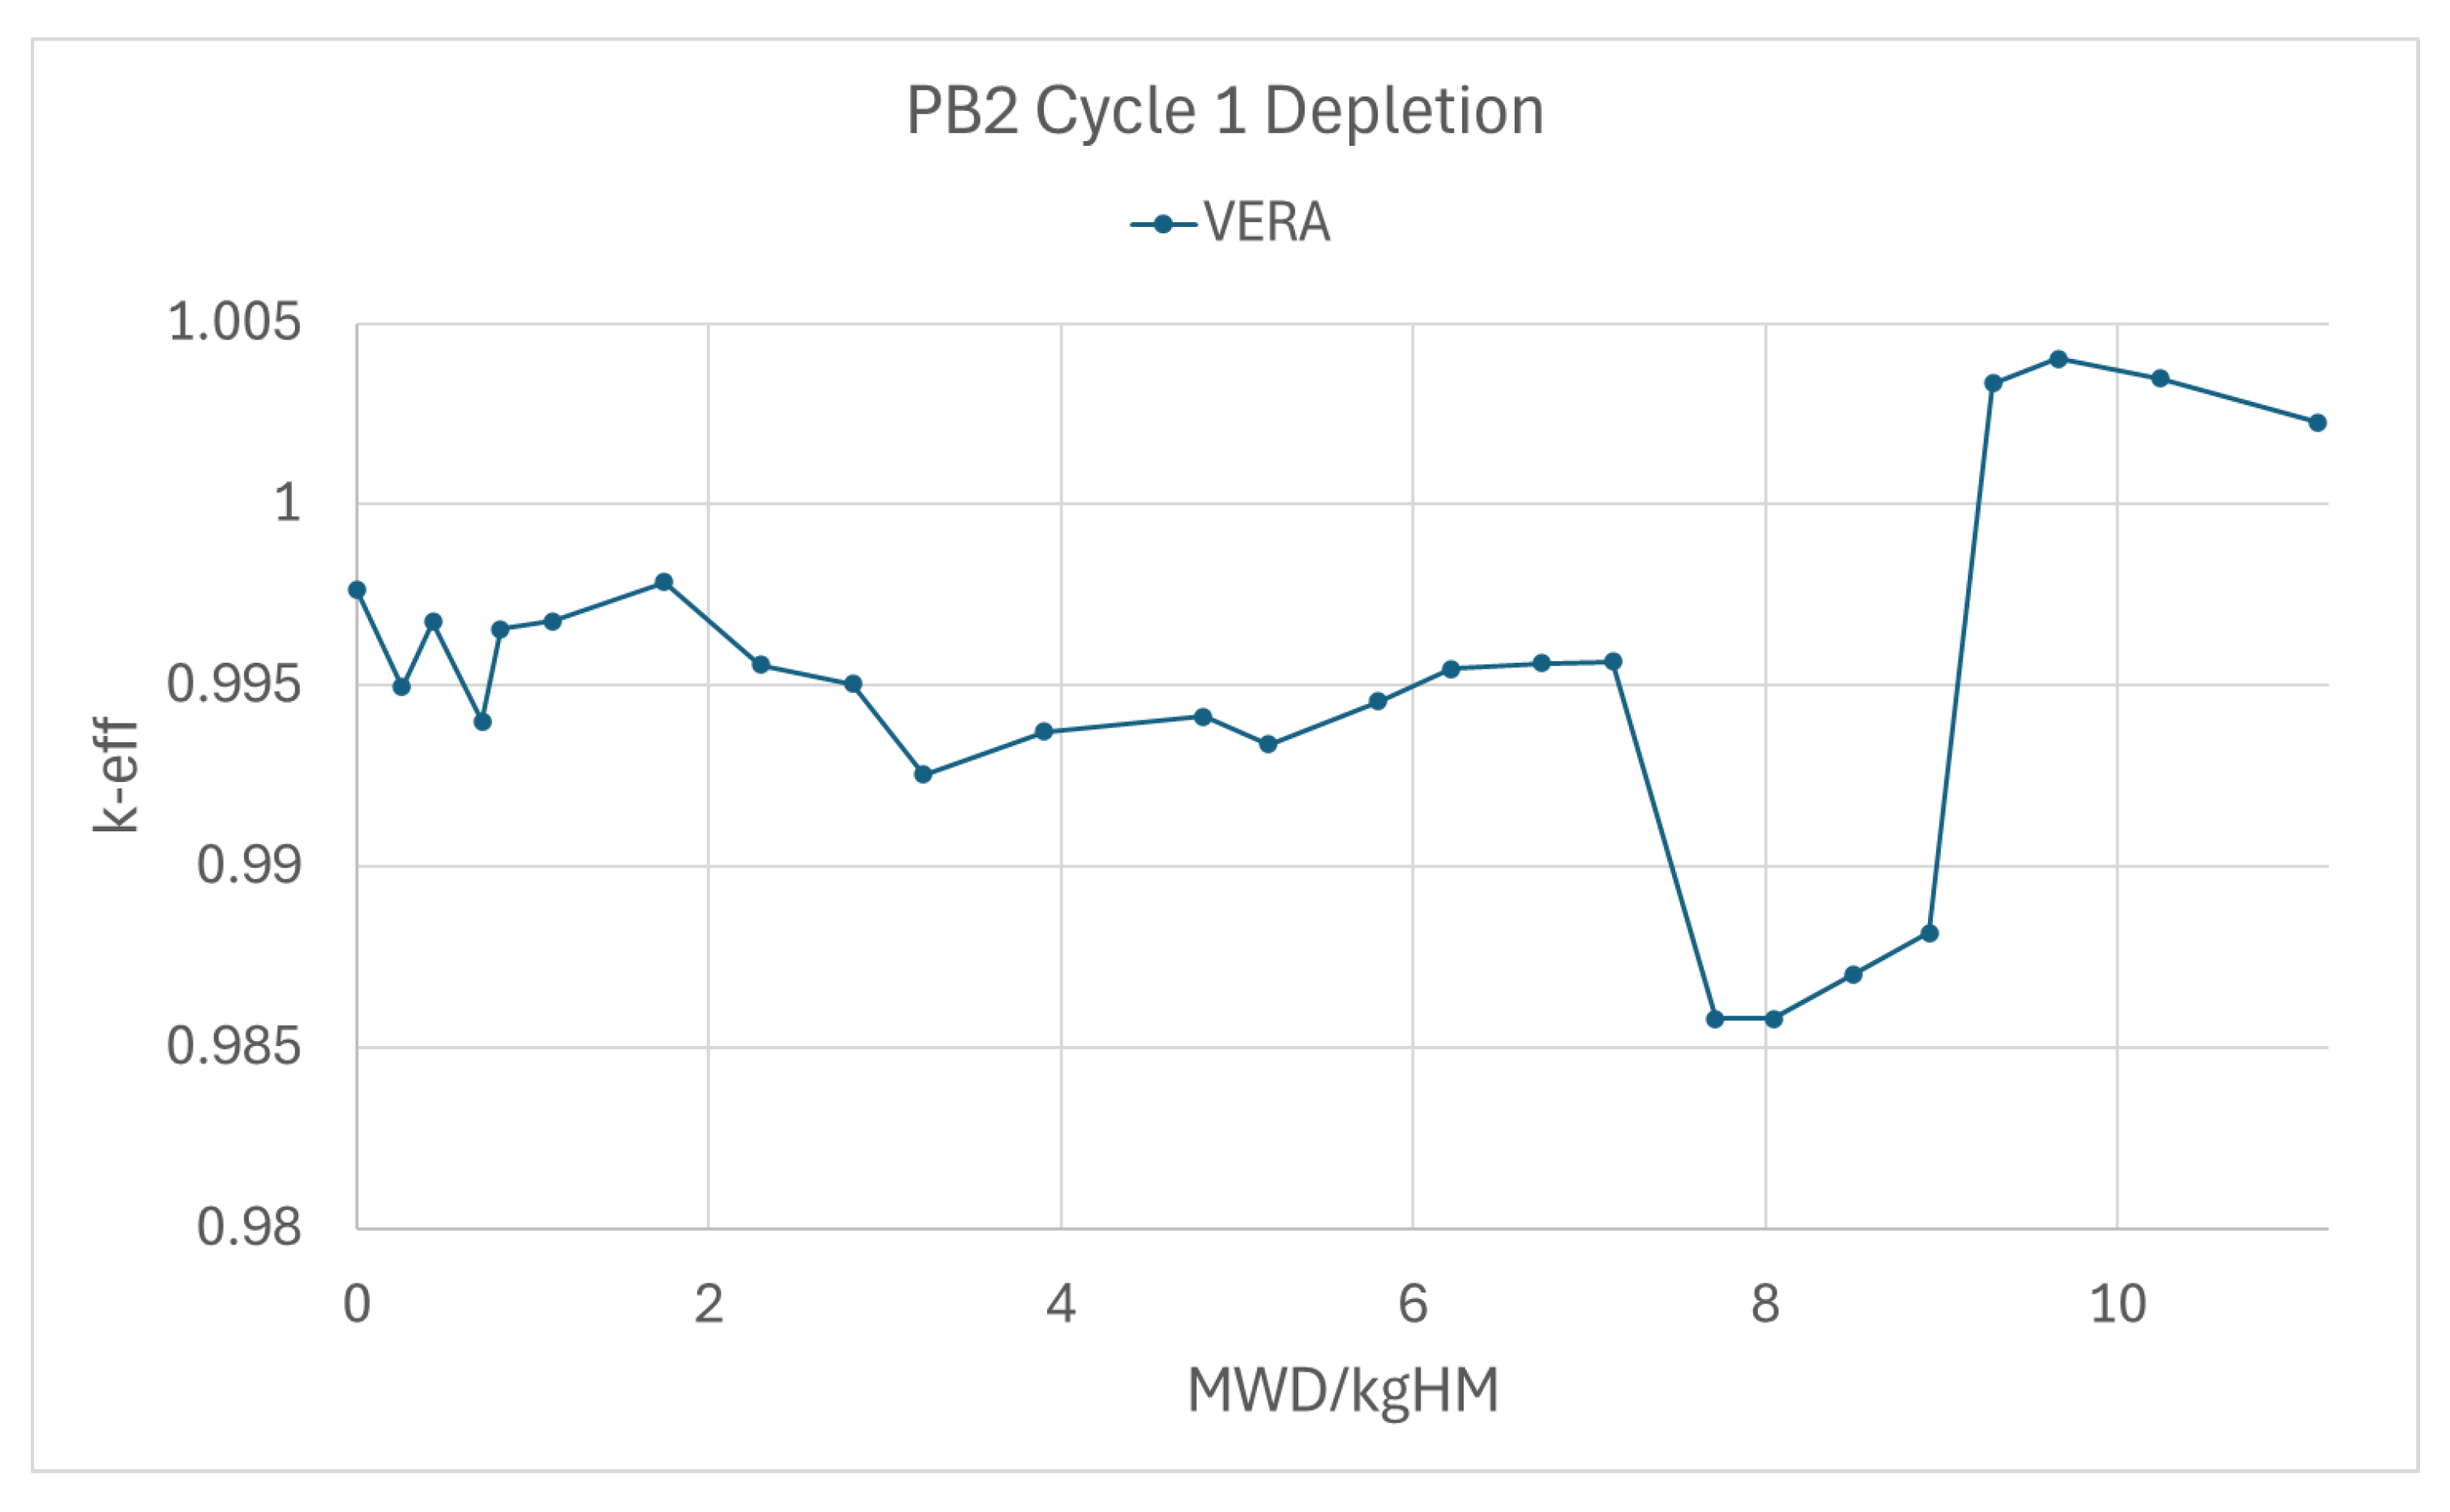
14] suite; ORIGEN includes explicit modeling of isotopic decay and fission product buildup at local conditions. Exposure and core reactivity predictions were validated by comparing against expected reactivity measurements; cycle 1 predictions were within 1500 pcm of criticality, and cycle 2 predictions were within 400 pcm, as shown in
Figure 2 and
Figure 3.
The depletion calculations used reactor-specific boundary conditions and core operating histories. The resulting end of cycle (EOC) restart files were then used to initialize the transient model rather than relying on the benchmark-provided cross sections.
2.3. Thermal Hydraulic Modeling
Thermal hydraulic feedback during depletion was modeled using MPACT’s simplified thermal hydraulics (STH) [
15], which performs its calculations at the assembly level. For the transient phase, VERA was coupled with the COBRA-TF (CTF) [
16] thermal hydraulics solver, which computes coolant flow, temperature, pressure, and void distributions at the subchannel level.
The boundary conditions and model setup closely followed the PB2 hot power scenario and turbine-trip transient specifications in the benchmark [
3], including outlet pressure, mass flow rate, bypass fraction, and inlet temperature.
2.4. Turbine-Trip Transient Simulation
The turbine-trip simulation was initiated from the EOC hot power steady-state conditions for cycle 2, and transient boundary conditions were applied through the full 5 s transient. The model captures key transient behavior including void collapse, reactivity insertion, scram insertion at 0.75 s, and the resulting power excursion. Major changes do not begin until after 0.3 s, and the most significant global reactor changes happen within the first 2 s of the transient. VERA’s predictions for reactivity insertion and power profiles are compared with benchmark participants’ results [
6] so that the accuracy of the steady-state and transient calculations could be assessed.
3. Results
The simulation of the PBTT benchmark using VERA yielded results that are consistent with expectations from the benchmark specifications and in good agreement with reported participant averages. The outcomes of the study are presented according to three main phases: the reactor depletion leading up to the transient event, the steady-state conditions prior to the transient, and the turbine-trip transient itself. Results are presented with interpretation in the context of model fidelity, benchmark agreement, and applicability to future best-estimate assessments. Note that the participant averages represent the average results from the 18 original participants which tended to be similar to each other but were not identical with some noticeable variation [
6].
3.1. Reactor Depletion Results
VERA was used to deplete the core through cycles 1 and 2 of PB2 using detailed, pin-resolved depletion models. Depletion results for cycle 1 are shown in
Figure 2, and the results for cycle 2 are shown in
Figure 3.
The cycle 1 depletion used 25 steps over a depletion of 11.13 MWd/kgHM. The simulation maximum absolute divergence from criticality was 1421 pcm, and the standard deviation of the absolute divergence from criticality was 354 pcm. The cycle 2 depletion used 14 steps over a depletion of 5.02 MWd/kgHM. The simulation maximum absolute divergence from criticality was 389 pcm, and the standard deviation of the absolute divergence from criticality was 121 pcm. It is conjectured that cycle 1’s poorer depletion criticality results compared with those of cycle 2 stem from greater variance in reactor behavior early in the reactor’s life, and more uncertainty may have been present in recorded operating conditions (such as power levels and durations). Indeed, the cycle 1 state points modeled had over an 18% standard deviation in power, whereas the cycle 2 state points had only a 7% standard deviation in power, most of which came from the initial reactor startup [
4,
11].
3.2. EOC 2 Hot Power
For the EOC 2 hot power calculation of PB2 in steady-state conditions prior to the transient, the VERA simulation utilized STH and achieved a close match to criticality: a calculated
of 0.99490 was observed, which is in comparison to the benchmark participant average
of 1.003943 [
6]. Some of this difference is a result of the fact that we depleted Peach Bottom 2 for two cycles using VERA to achieve our turbine-trip initial conditions, instead of utilizing the provided cross sections used by the benchmark participants. Note that the benchmark participant minimum
was about 0.990 and the maximum was about 1.010, so our result still falls within this range.
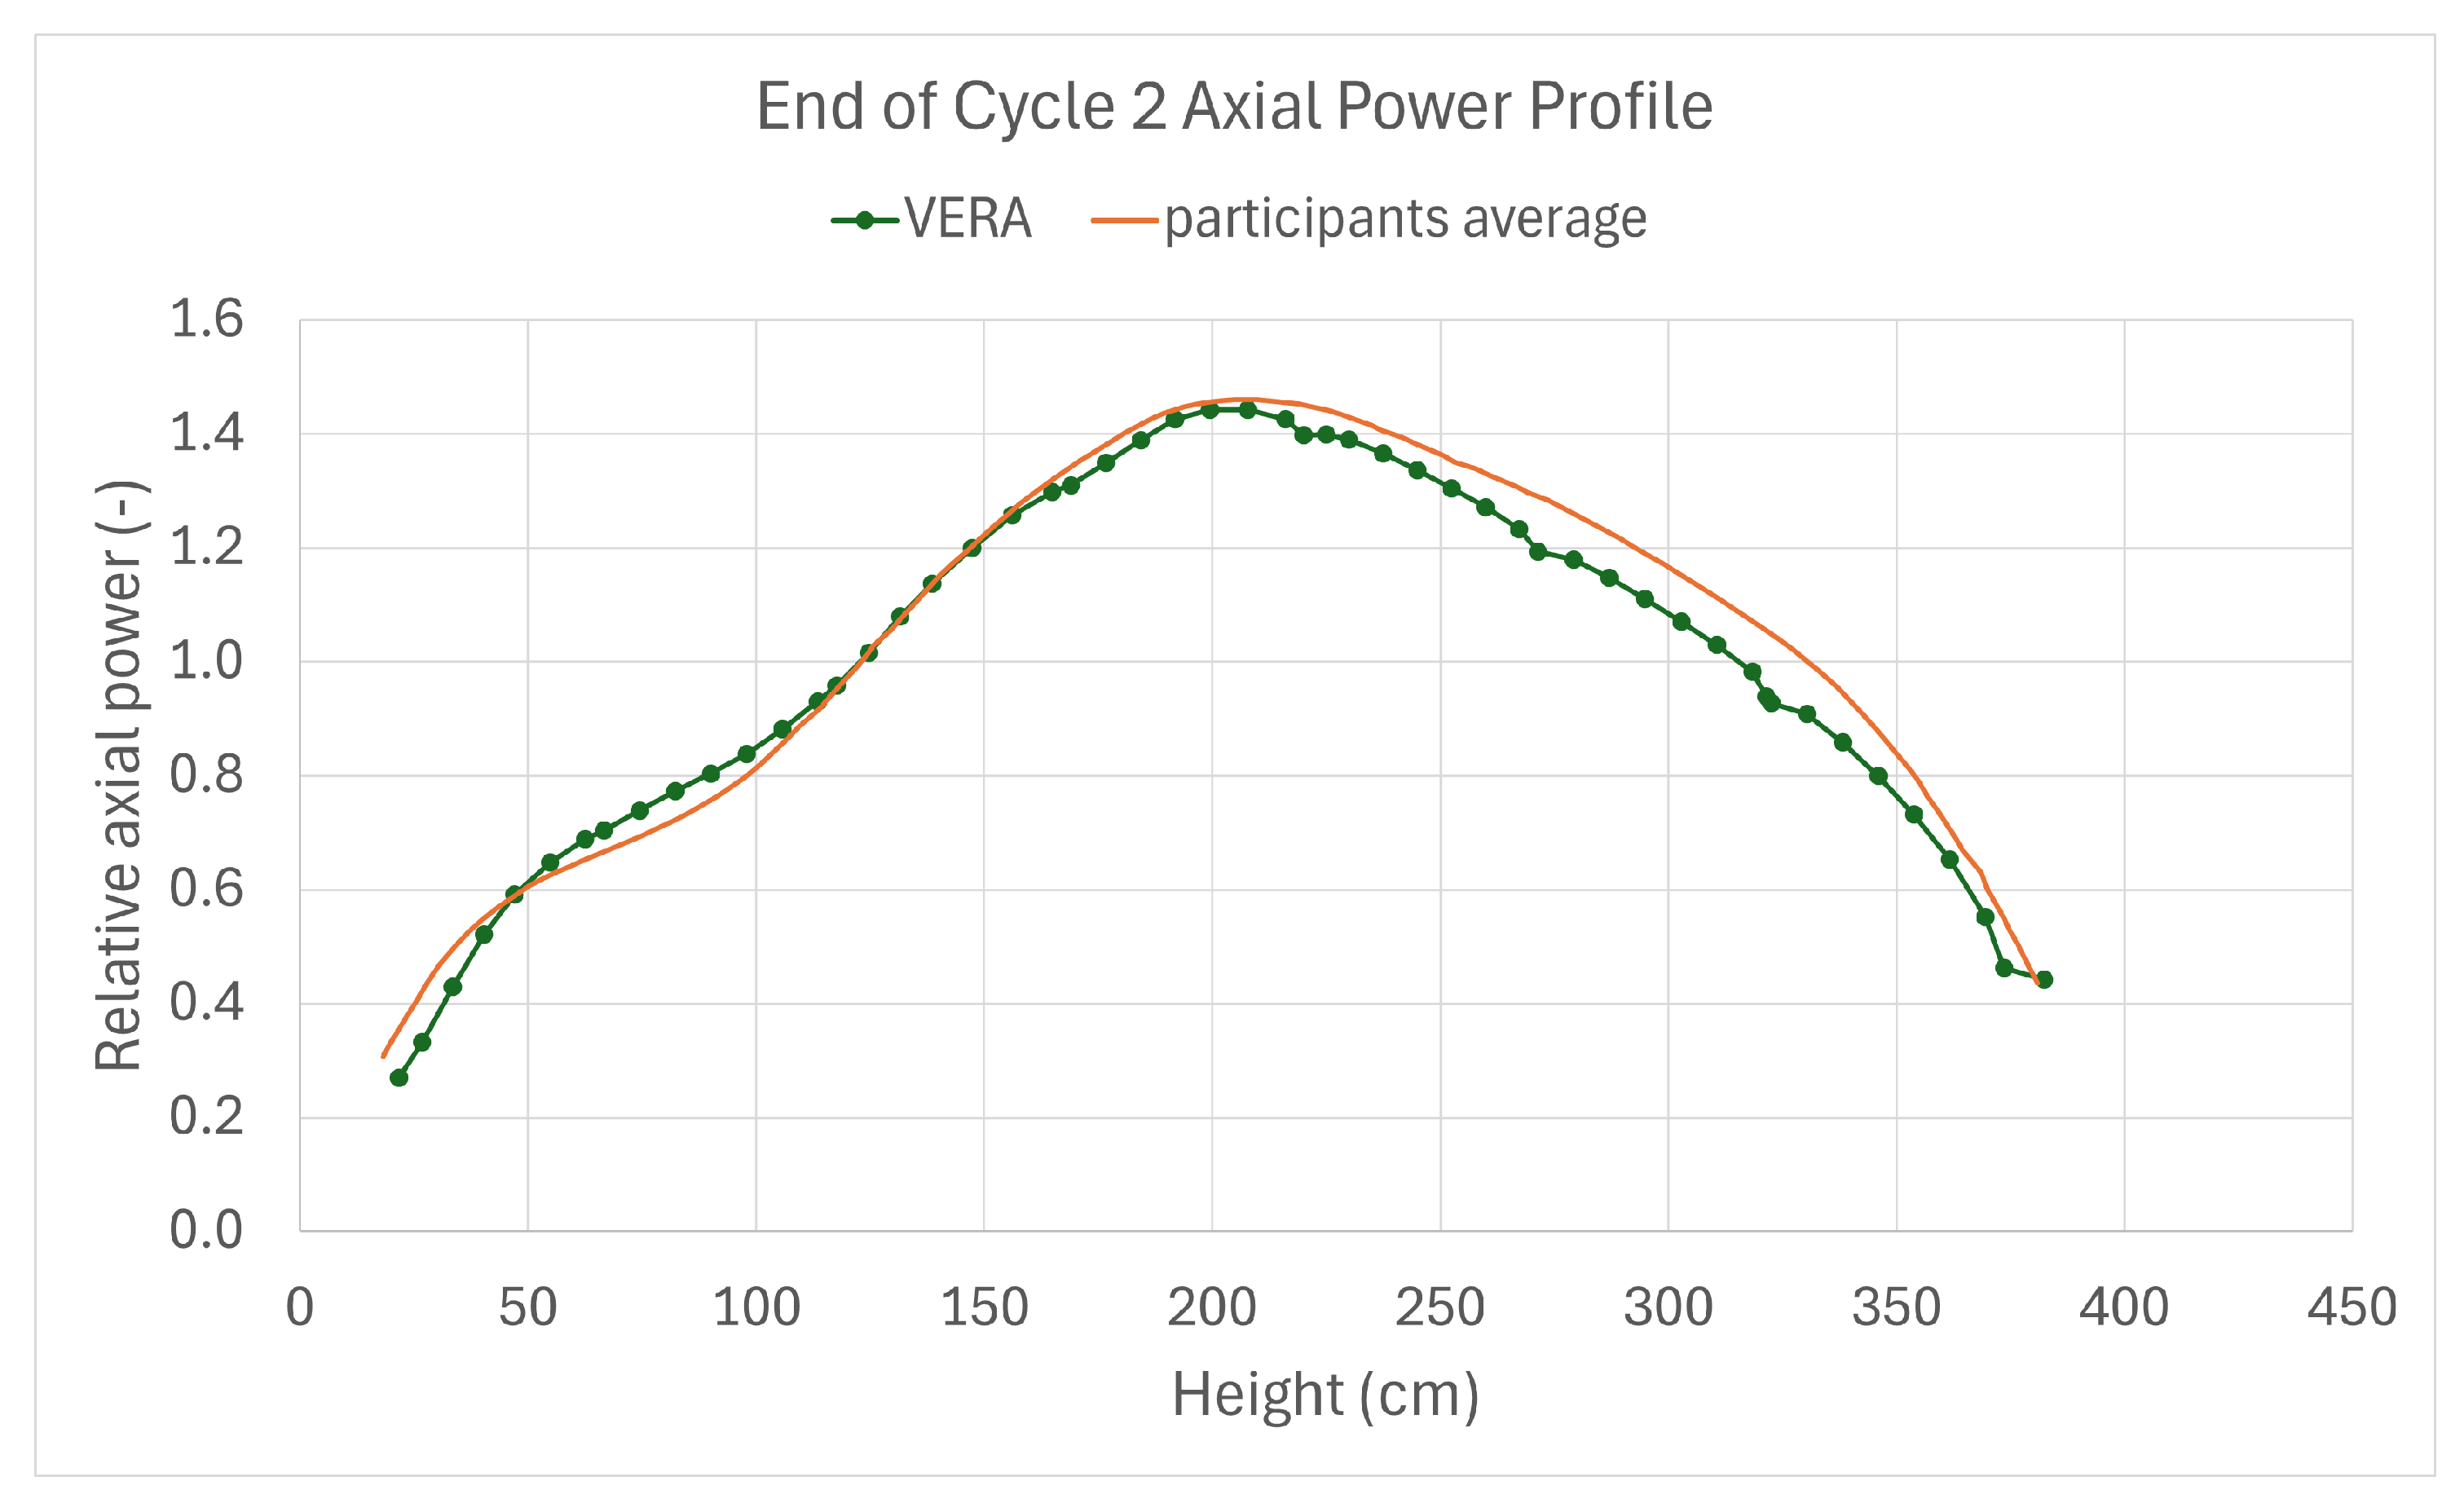
Also consistent with the participant average results for the EOC 2 steady-state calculation are both the axial void profile and axial power profile shown in
Figure 4 and
Figure 5, respectively.
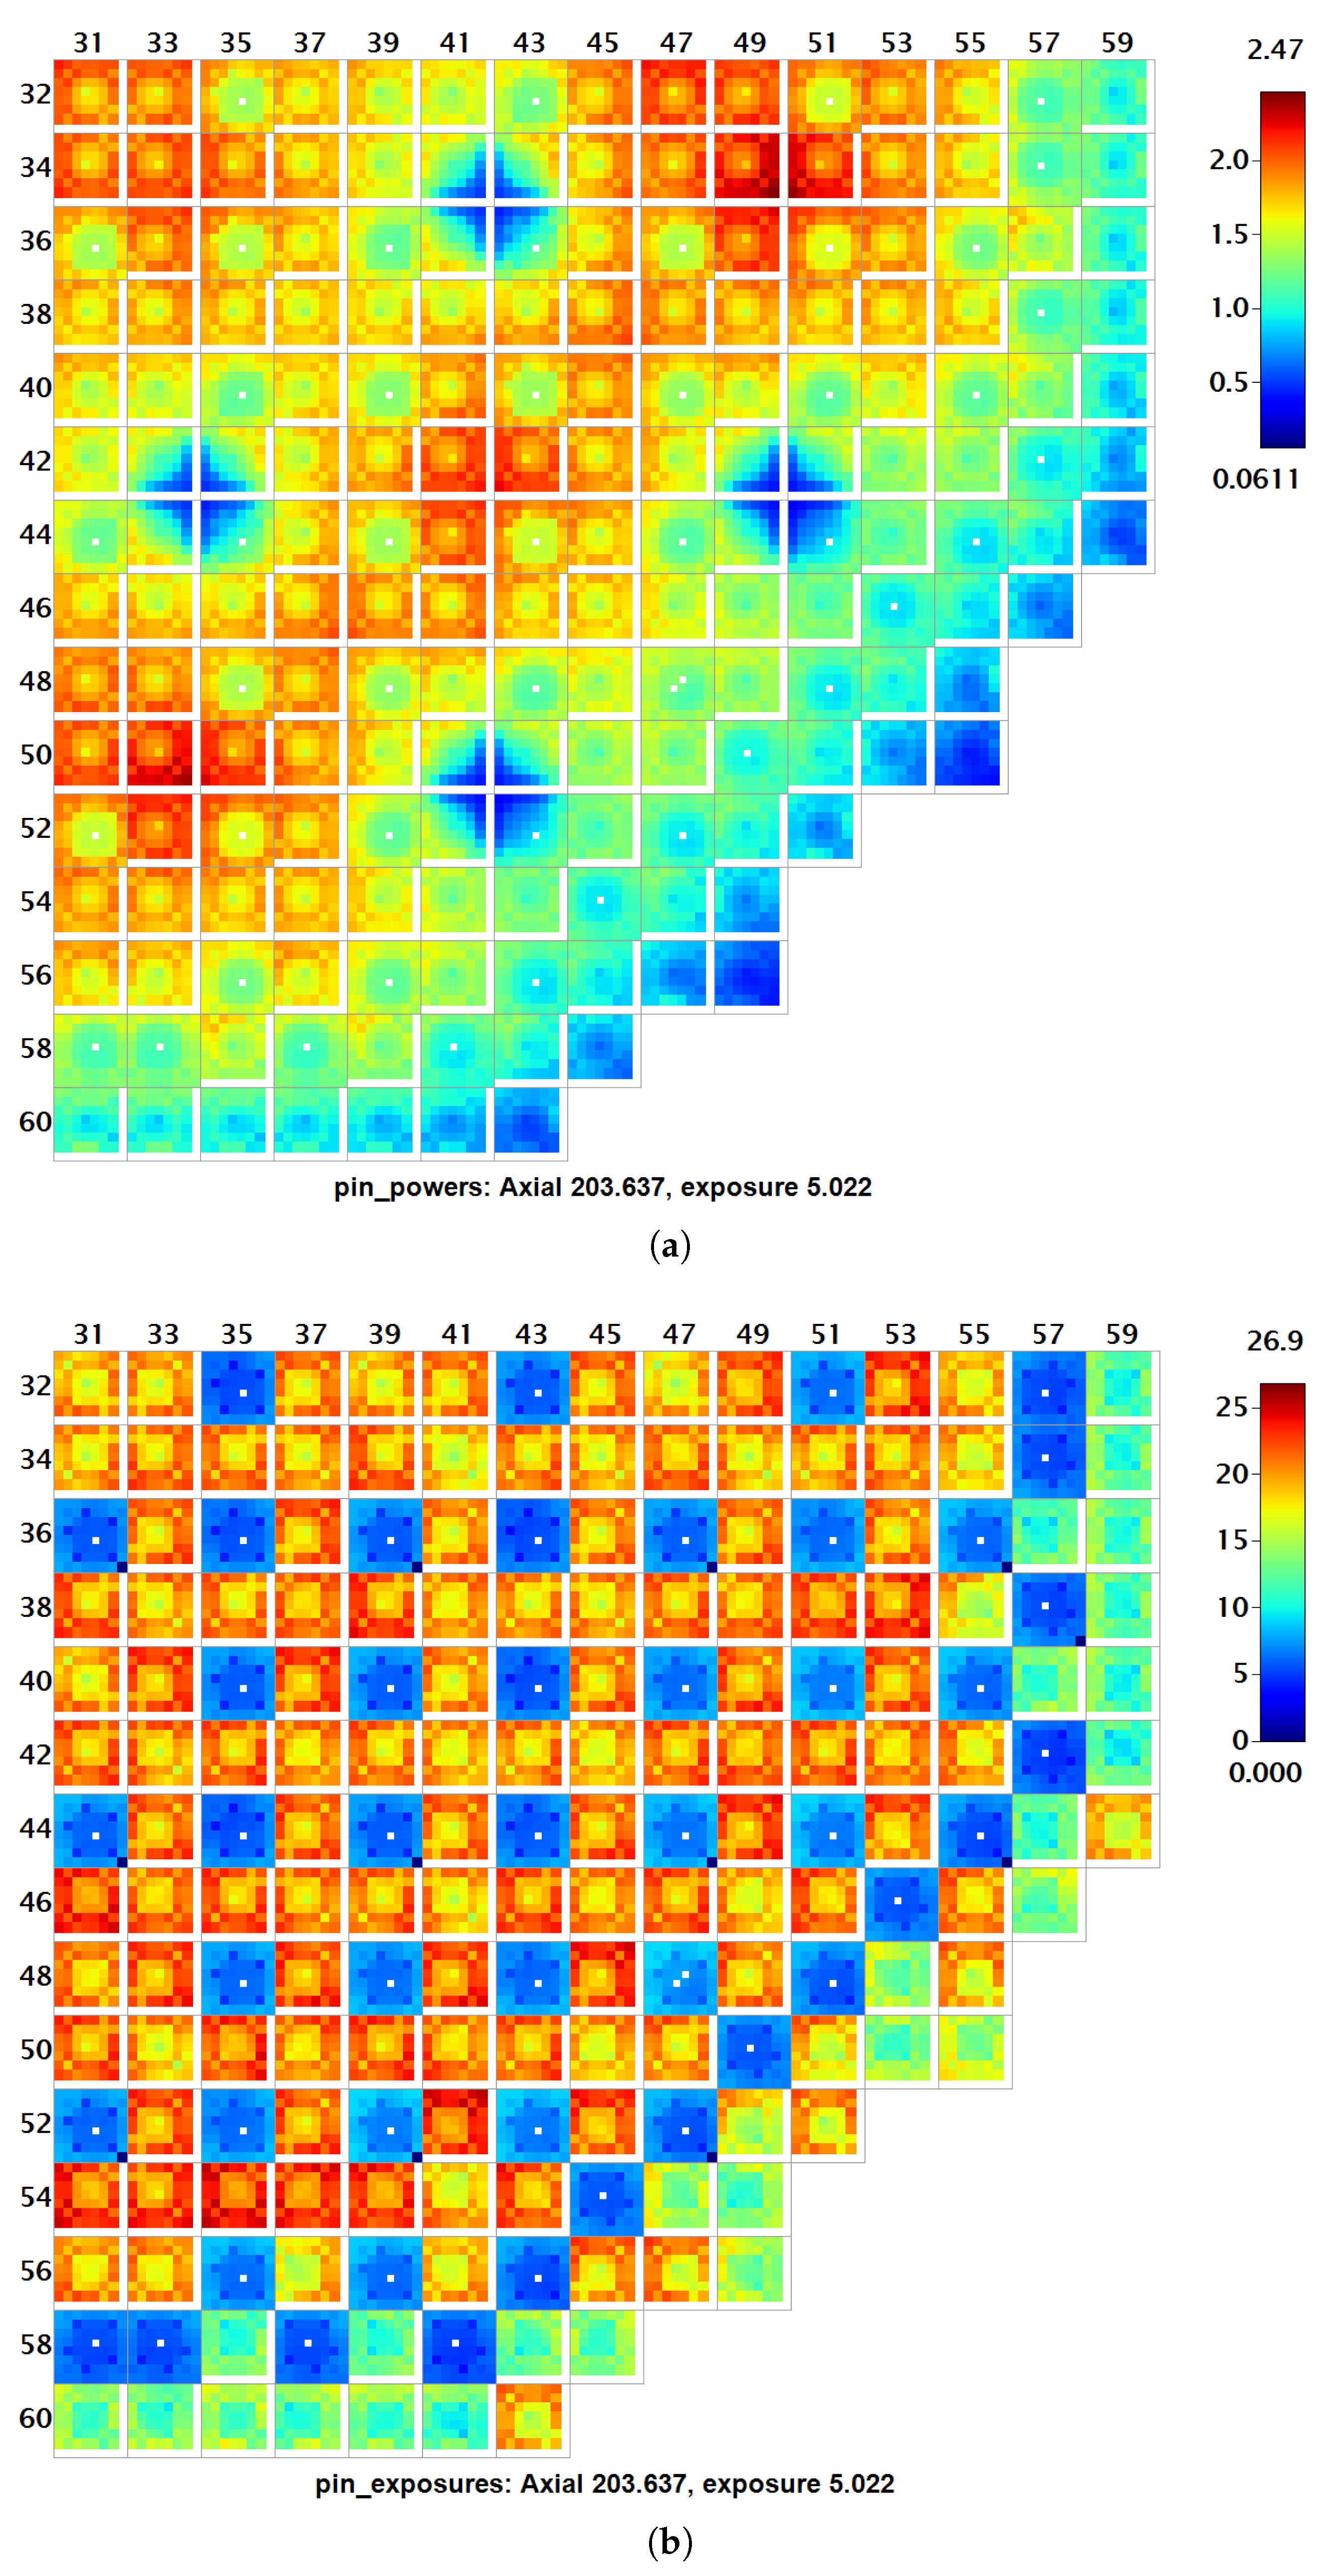
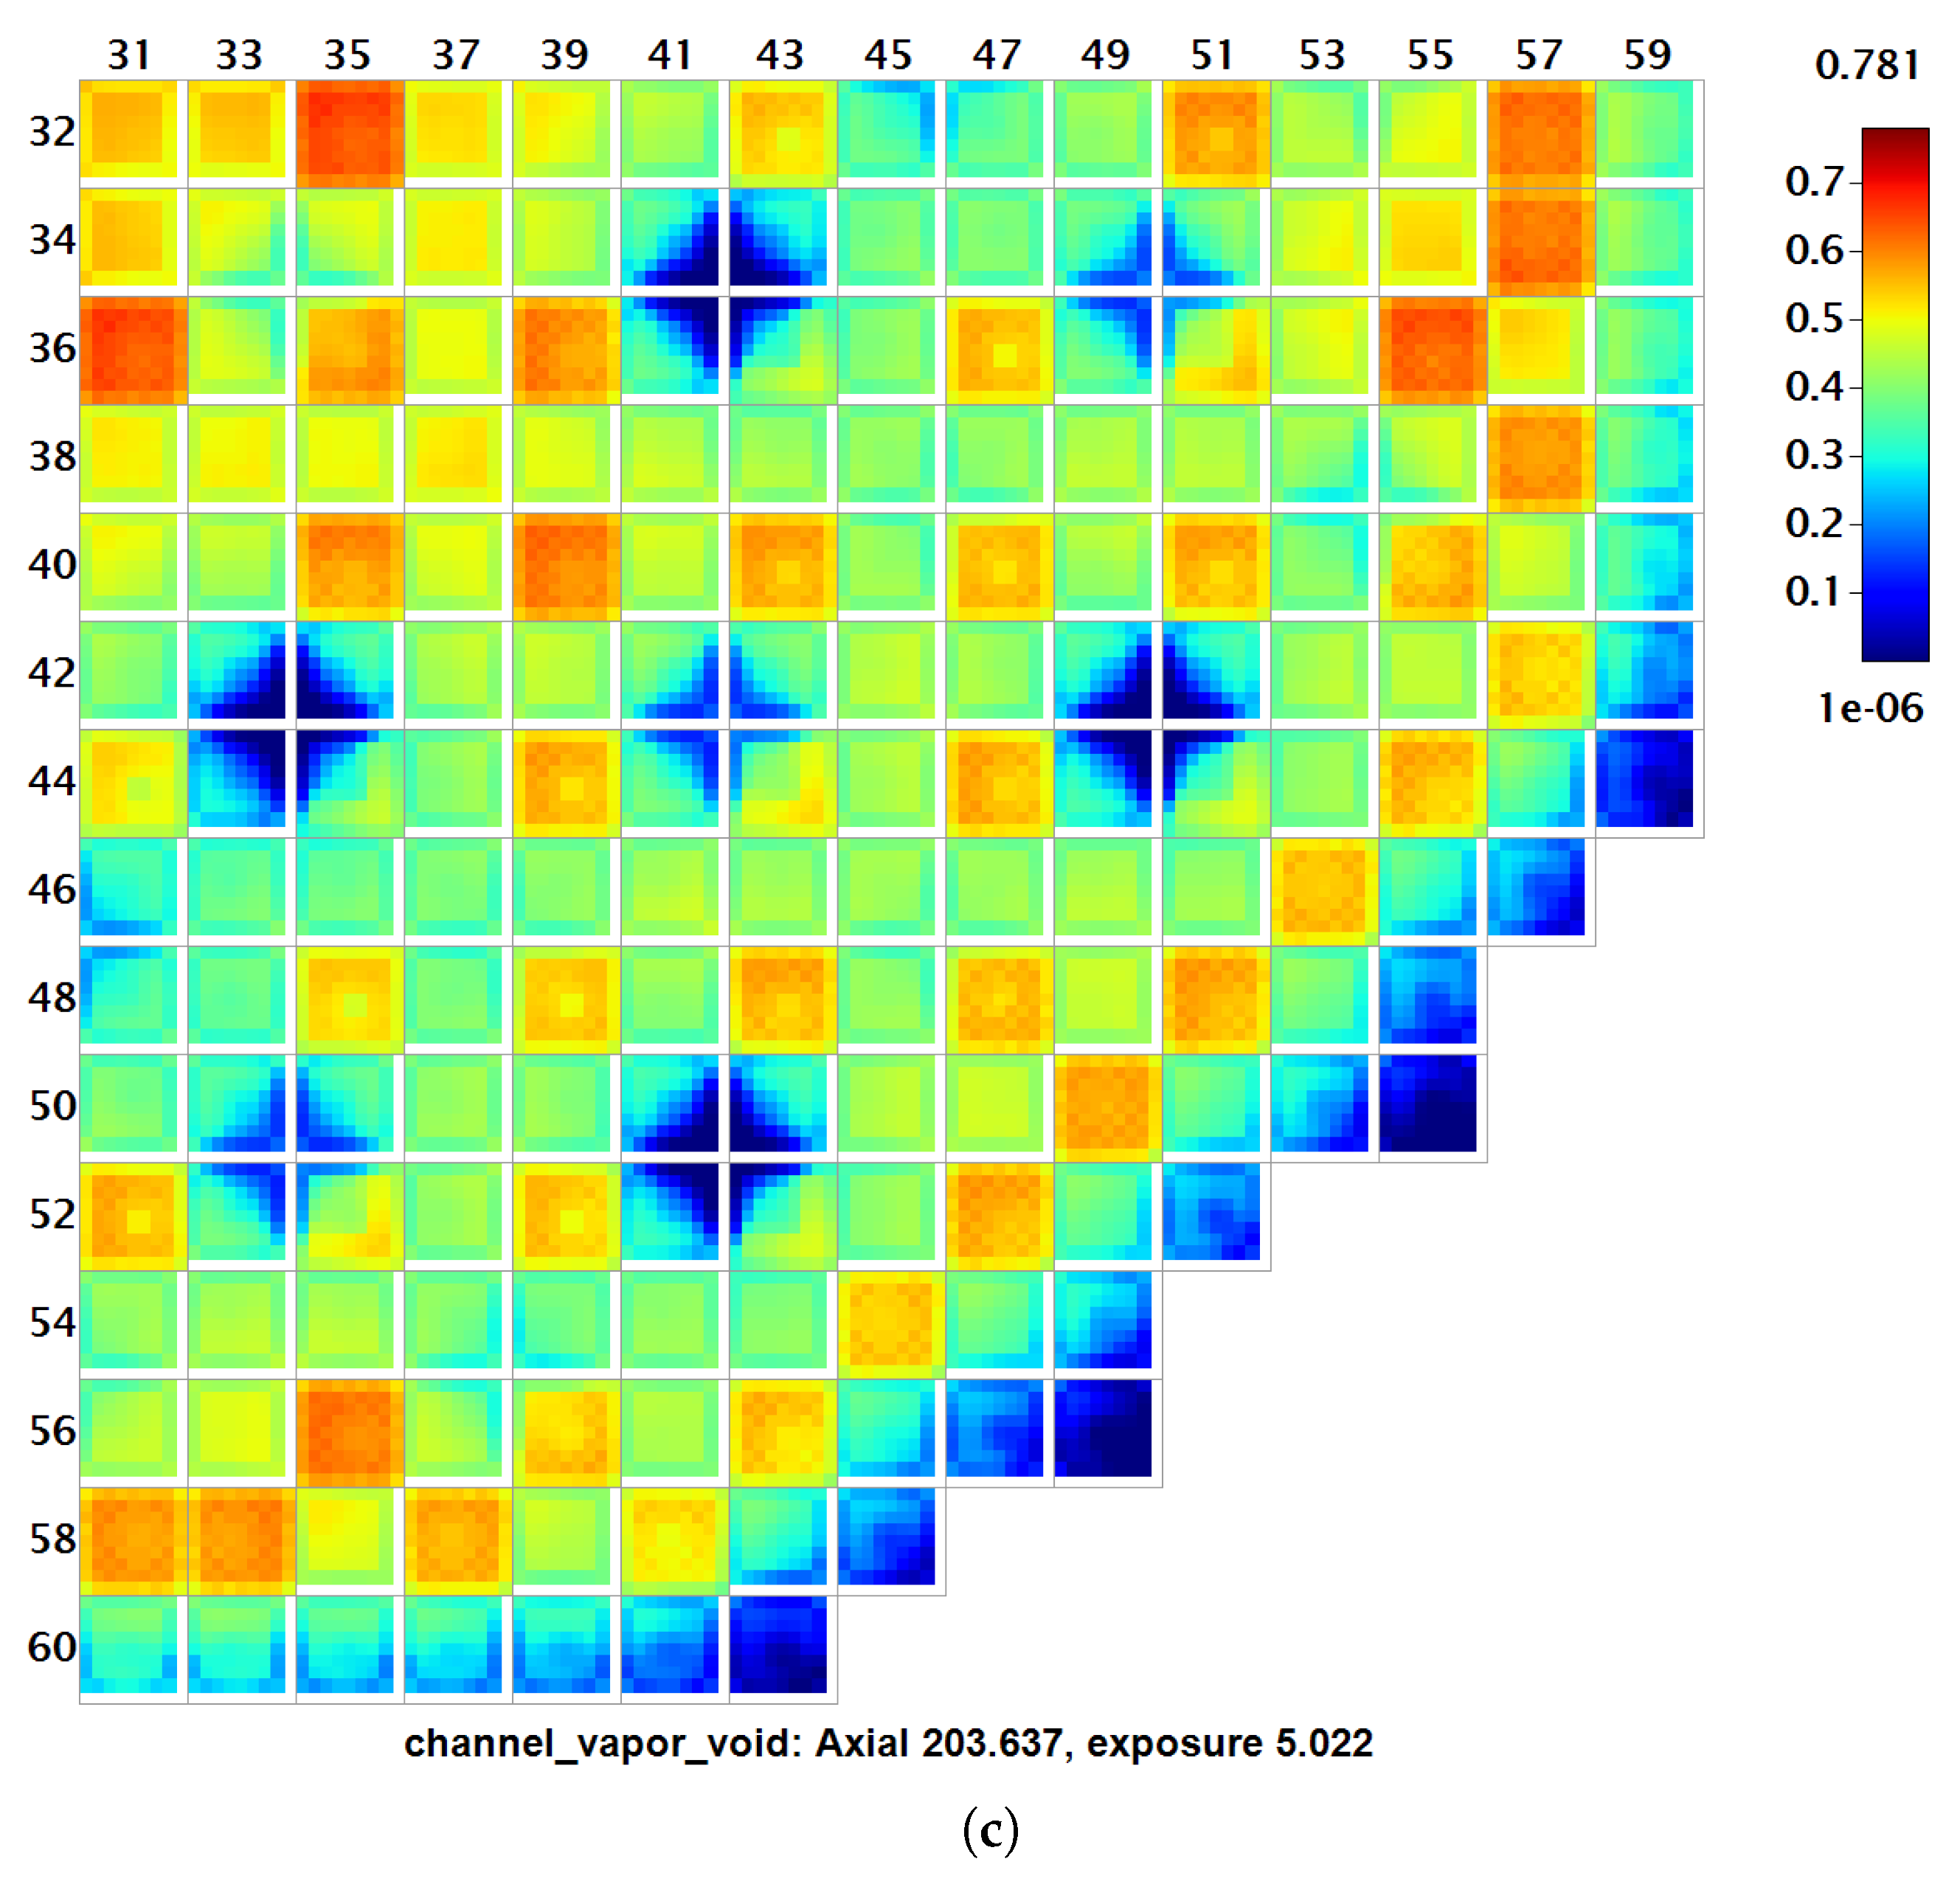
VERA also produced 3D pin-by-pin power and exposure distributions as well as coolant void distributions at the EOC condition. These high-fidelity distributions do not have a reference to compare against, as they were not the subject of the benchmark, but they serve to give more information on the state of the reactor prior to the transient and demonstrate the fidelity of the VERA results. Midplane radial slices of these distributions are shown in
Figure 6.
Notice that these plots are those of a quarter core. The PB2 core has quarter-core symmetry and the PBTT benchmark introduces no additional asymmetry. Therefore, we utilized quarter-core symmetric modeling for VERA.
3.3. Turbine-Trip Transient Simulation
The turbine-trip transient was simulated from the steady-state “hot power” condition. Transient boundary conditions—including time-dependent outlet pressure, inlet mass flow rate, inlet temperature, and bypass fraction—were applied as specified by the benchmark organizers [
3].
3.3.1. Reactivity and Power Response
The most significant feature of the turbine-trip transient is the rapid power excursion caused by reactivity insertion due to void collapse. VERA’s simulated timing and magnitude of the power spike match well with the benchmark participants’ average: the simulated peak occurred at 0.75 s, which matches the reported scram time and closely aligns with the benchmark average of 0.742 s within the timestep value at that point of about 0.01 s. Similarly, VERA’s maximum power spike delta was about 7600 MW, whereas the benchmark participant average maximum spike delta is about 7400 MW. The transient reactivity predicted by VERA also closely tracked the average reactivity trends of participating benchmark simulations, confirming the model’s ability to accurately capture rapid feedback dynamics. The power spike and reactivity from 0.3 to 1.9 s are shown in
Figure 7 and
Figure 8, respectively.
3.3.2. Thermal Hydraulic Behavior
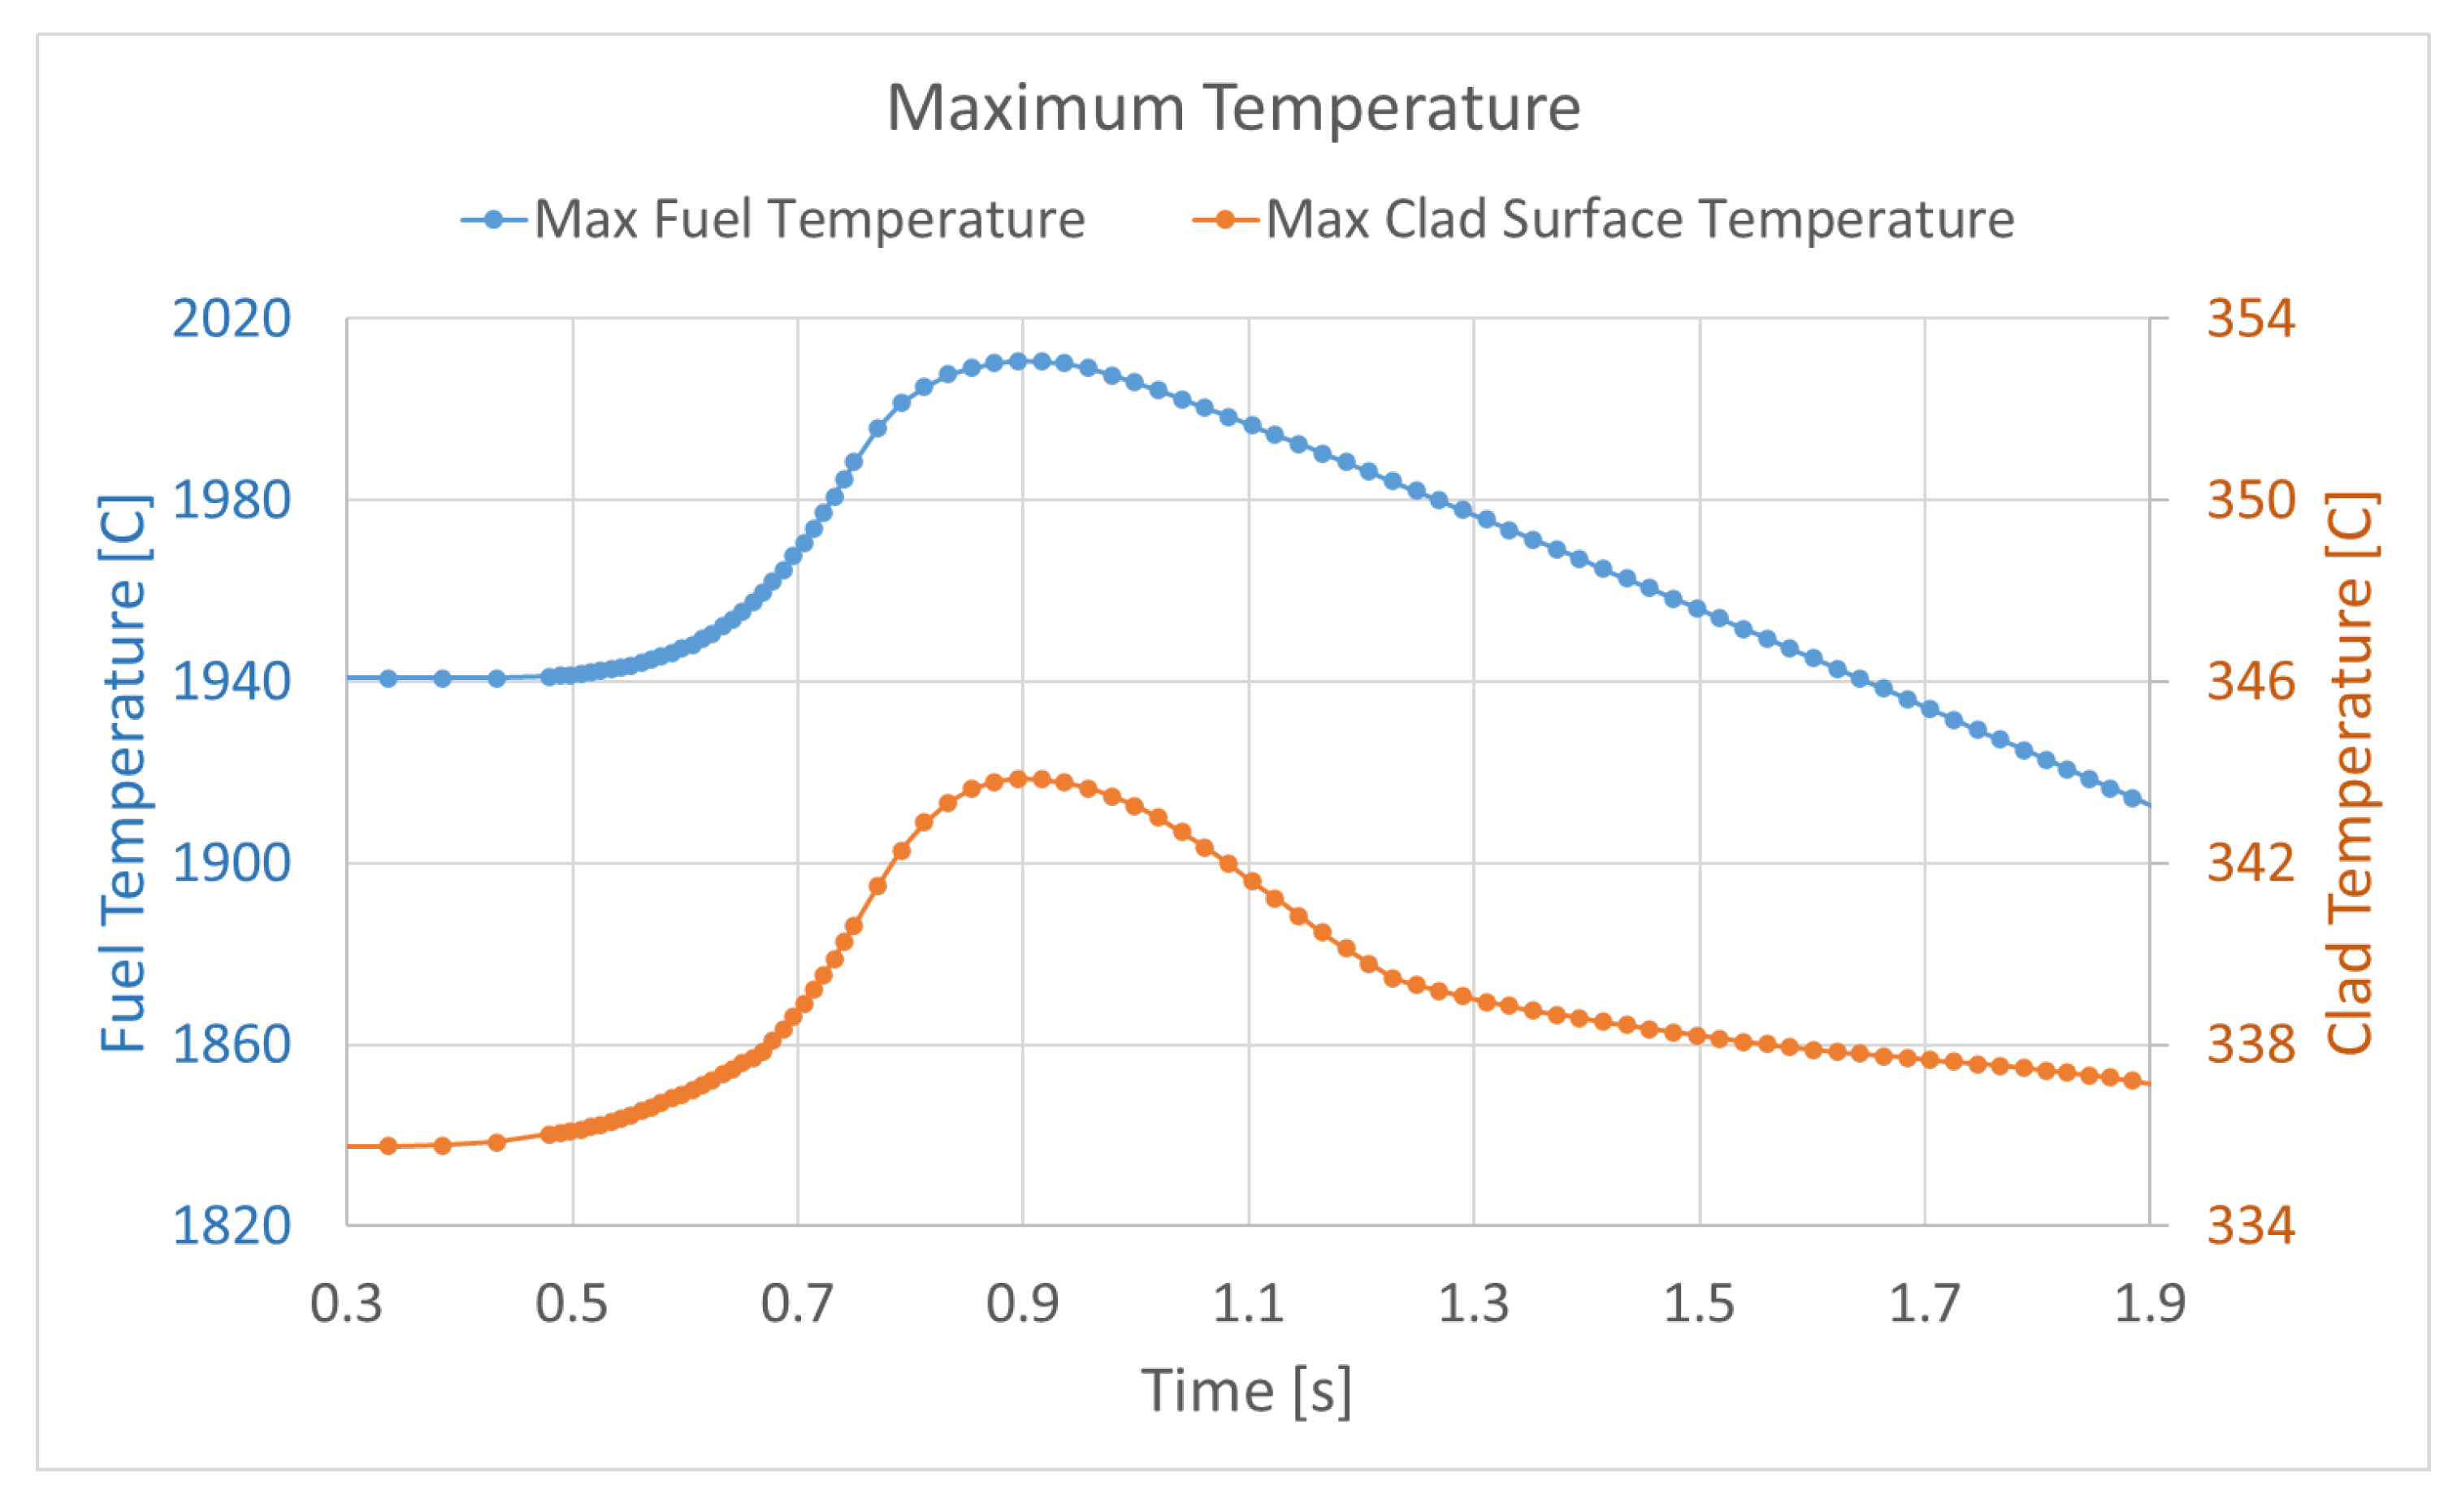
VERA’s coupling of neutron kinetics with subchannel thermal hydraulics provided detailed insight into fuel and clad behavior during the transient. The peak fuel temperatures and clad surface temperatures are shown in
Figure 9 and do not show any signs of dryout.
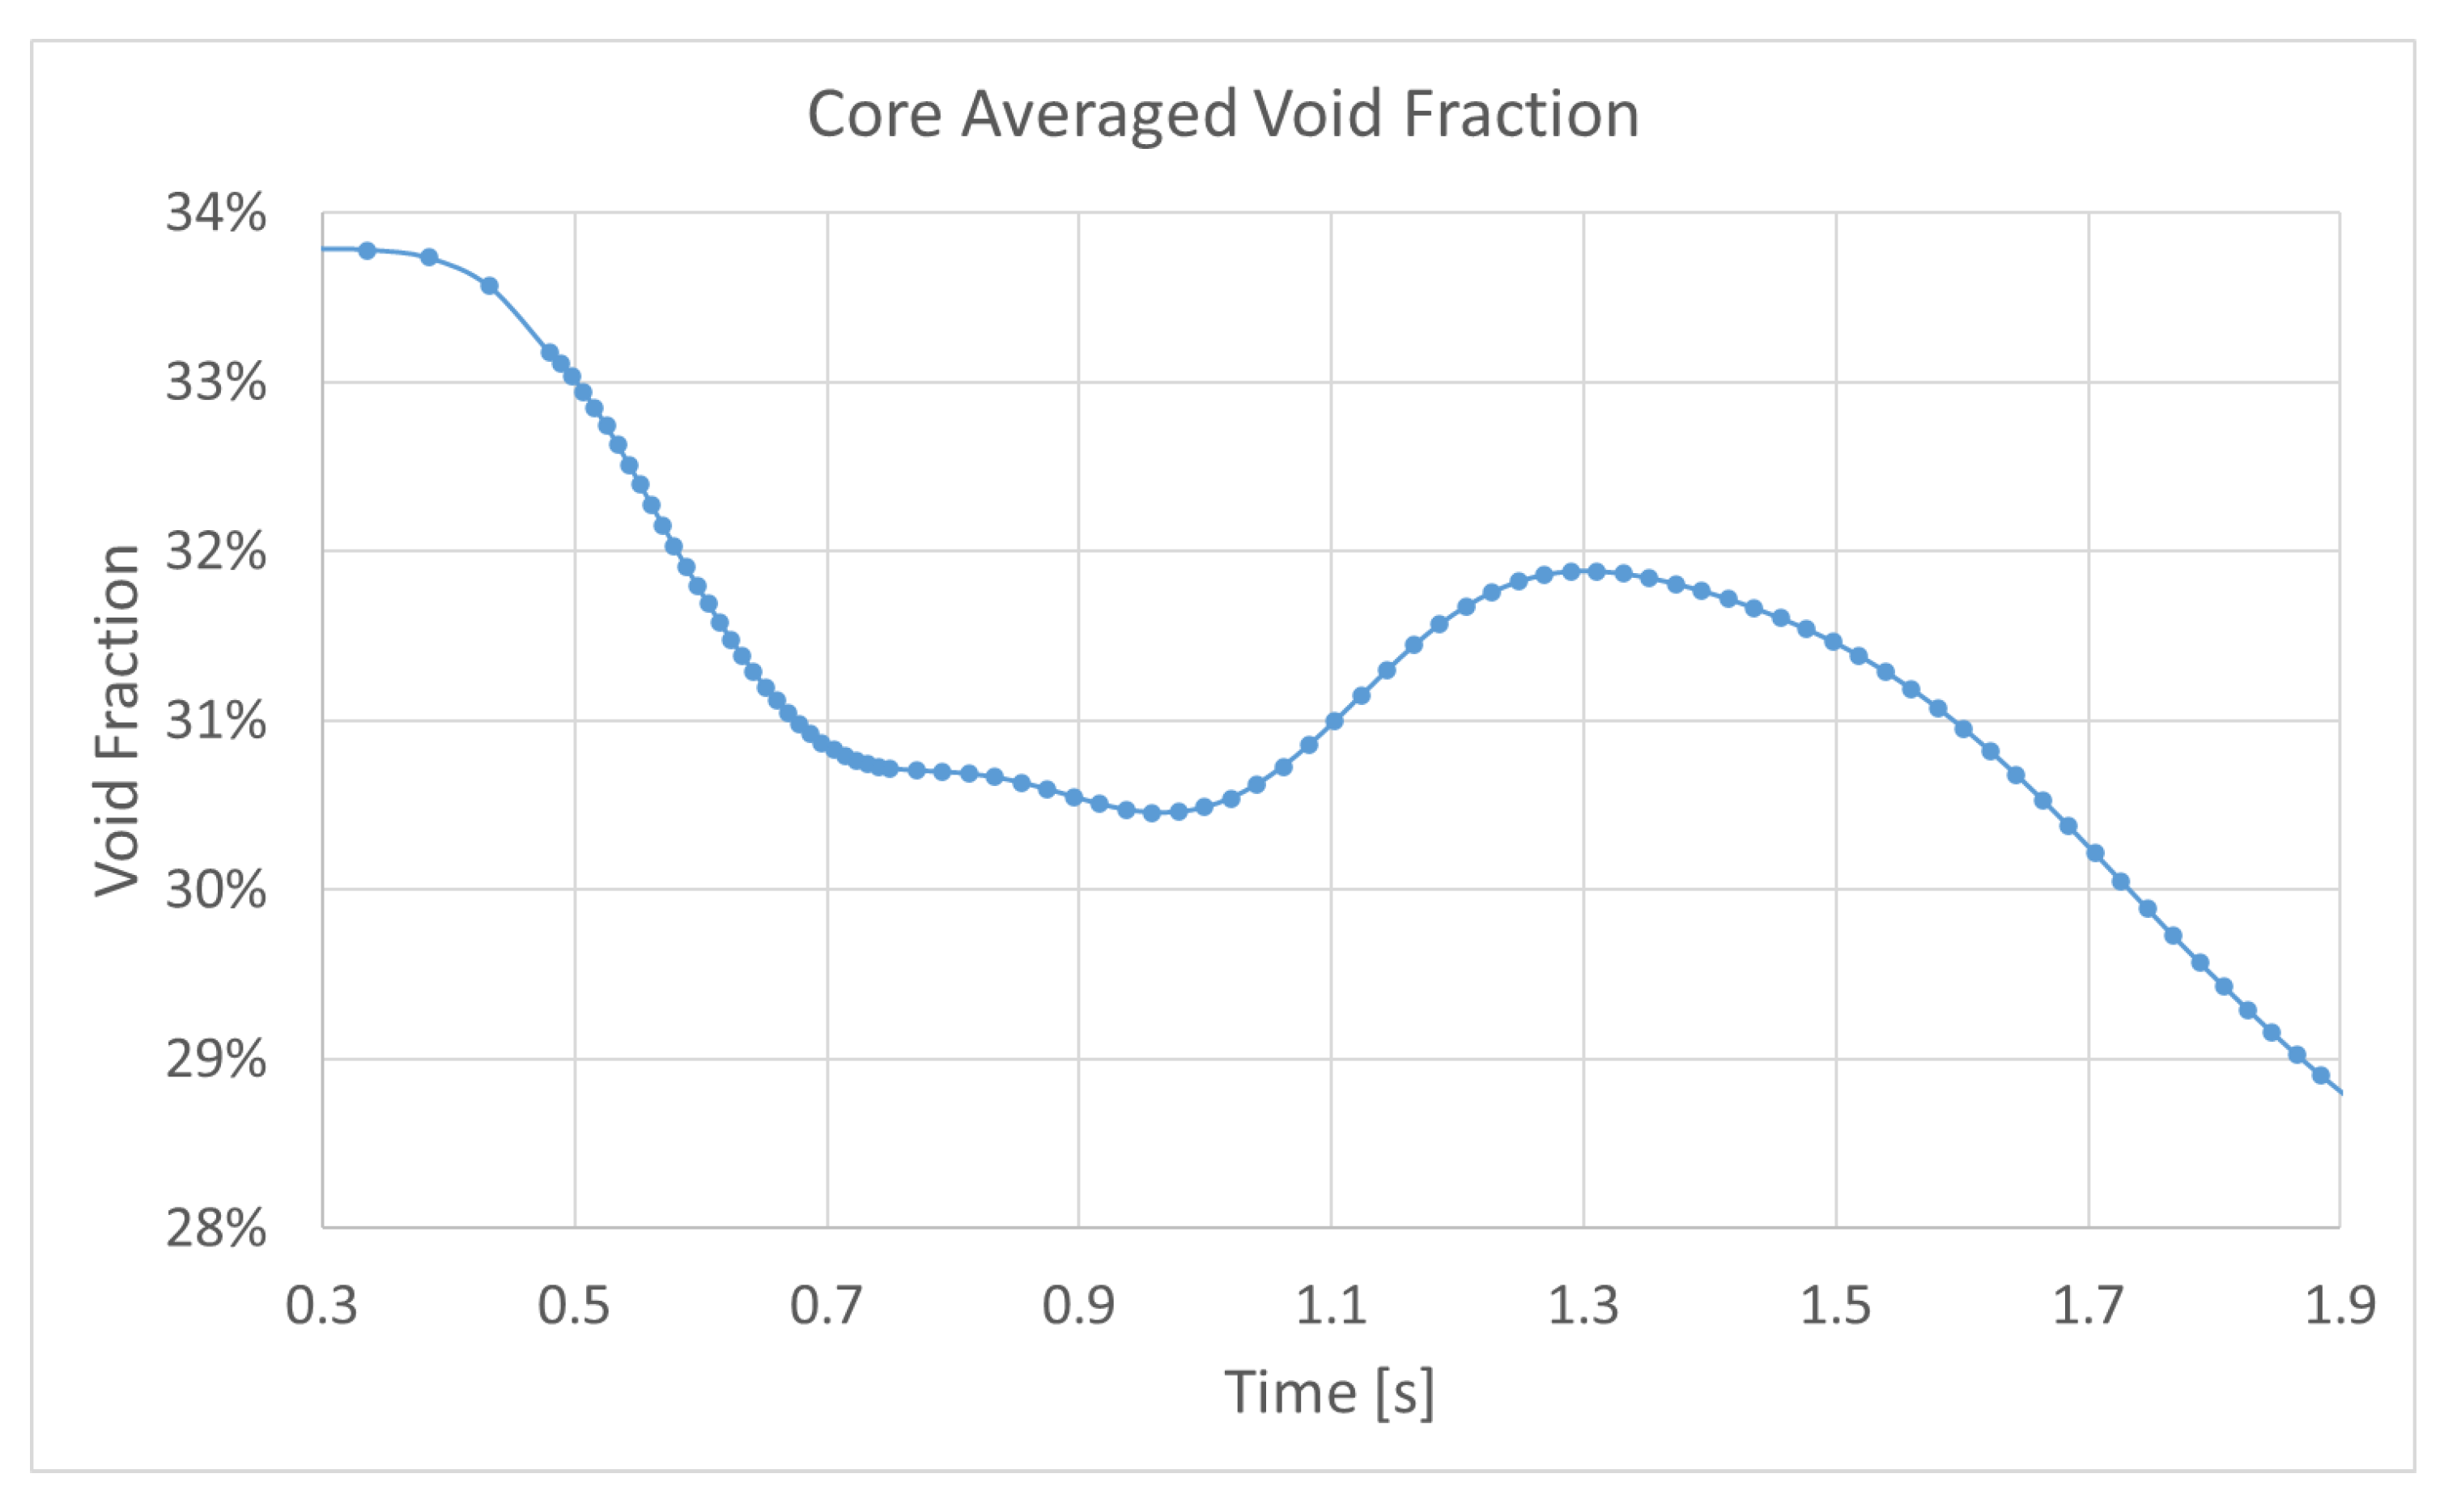
Void fraction collapse was observed in core-averaged results shortly after the pressure rise, shown in
Figure 10, corresponding with the sharp increase in reactivity. This effect was also consistent with the benchmark’s phenomenological description of the event.
4. Discussion
The results demonstrate that VERA is capable of simulating both the steady-state and transient phases of the PBTT benchmark with high fidelity. The tool reproduced the main features of the transient, including rapid reactivity insertion, power excursion, and void collapse, while maintaining consistency with observed reactor behavior and benchmark participant data. These findings show that VERA can model the steady-state and transient behavior of a BWR turbine-trip transient with good agreement with other modeling tools. By replicating the PBTT benchmark with high fidelity, VERA not only confirms its capability in core-level multiphysics simulation but also establishes a strong foundation for future work aimed at performing best-estimate calculations of BWR limiting transients.
4.1. Comparison with Previous Studies
The PBTT benchmark has been used in international code validation efforts for over two decades. Earlier studies have shown broad variability in predicting key transient phenomena, especially in terms of reactivity insertion timing, power excursion magnitude, and void fraction dynamics. The inclusion of detailed intra-pin feedback and explicit 3D geometry in VERA represents a significant step forward in reducing model uncertainty and increasing physical realism.
Compared to published benchmark results [
6], VERA’s simulation of the reactivity insertion, peak power timing, and peak power magnitude showed excellent agreement with participant averages. Moreover, these results build upon recent work [
11], which applied MPACT to simulate cycles 1 and 2 of the PB2 core but did not include full transient modeling. Therefore, this study provides the first end-to-end, multiphysics validation of VERA against a transient benchmark scenario in a BWR context.
4.2. Interpretation and Implications
The ability of VERA to capture rapid feedback effects such as void collapse and associated power excursions underlines its relevance for emerging regulatory frameworks centered on time-at-temperature metrics. Unlike traditional deterministic safety margins, performance-based evaluations demand accurate simulation of local thermal hydraulic and fuel response under dynamic conditions. The agreement between VERA results and benchmark data indicates that it can be used profitably as a simulation tool even in complex BWR geometries with strong coupling between core physics and fluid behavior. The pin-wise results provided by VERA can be used in more limiting transient simulations for high-fidelity fuel and cladding performance analysis that is essential for time-at-temperature metrics but is not achievable using the coarser fidelity of traditional nodal and homogenized methods utilized by the benchmark participants [
6].
These findings suggest that tools like VERA could play a central role in next-generation extended fuel burnup campaigns and accident-tolerant fuel qualification by providing high-fidelity, best-estimate analysis of transients to understand model uncertainties, data needs, and to provide benchmark solutions for industry-scale methods. Simulations that incorporate modeling of pin-level detail and feedback-driven behavior can better predict where and when performance limits are approached or exceeded during transients.
The implications of this work also extend beyond BWRs. The methodology and validation approach demonstrated here can be adapted to pressurized water reactor (PWR) conditions and other transient scenarios. The use of high-fidelity depletion modeling and coupled neutronics and thermal hydraulics for transients provides a framework for code assessment across reactor types.
A quick note on the computational cost of these calculations. The VERA transient simulation was run on 24 nodes at the High-Performance Computing Center at Idaho National Laboratory (Sawtooth machine) making use of 1152 cores and taking around 70 h walltime for 211 discrete transient steps (or about 20 min per step) while using 3.8 TB of memory. While the number of steps could be reduced to save walltime (particularly during periods where the transient change is nonexistent or smooth), the magnitude of the cost will remain similar and these simulations are therefore only viable on large high-performance clusters and not possible on desktop or laptop scale computing.
4.3. Future Research Directions
The following list details several promising avenues for future research highlighted by this work.
Dryout and re-wet modeling: Planned extensions of this work include modifying the PBTT transient to induce fuel cladding dryout and re-wetting phenomena. These conditions will test the limits of thermal hydraulic and fuel performance models under extreme conditions.
Fuel performance coupling with BISON: Integrating VERA results with the BISON fuel performance code will enable detailed assessments of cladding strain and other time-at-temperature–dependent damage mechanisms.
Sensitivity and uncertainty analysis: A comprehensive UQ campaign is planned to identify the dominant contributors to variability in transient behavior and fuel performance. This activity will enhance the credibility of VERA predictions for these transients.
Expansion to other plants and transients: Applying the same modeling approach to other BWRs would allow for broader generalization of the methodology and further validate VERA’s BWR capabilities. Modeling additional limiting transients will also further expand the methodology’s usefulness.
Overall, this study marks a key step in advancing high-fidelity reactor simulation and underscores the critical role of benchmark-driven validation in achieving trustworthy and regulatory-relevant modeling outcomes.
5. Conclusions
This work demonstrates the successful application of VERA to the PBTT benchmark, a historically significant and well-characterized BWR transient scenario. In modeling the depletion through cycles 1 and 2 and the subsequent turbine-trip transient, VERA exhibited strong predictive accuracy across multiple physics domains, including neutronics, thermal hydraulics, and multiphysics feedback effects.
Key conclusions from this work include the following:
High-Fidelity Depletion Modeling: VERA maintained criticality within 400 pcm throughout cycle 2, validating its capability for long-term core evolution modeling in a BWR environment.
Accurate Transient Response: The model closely replicated the key features of the PBTT event, including the timing of the power excursion, the magnitude of reactivity insertion, and the thermal hydraulic response, all of which were consistent with benchmark participant averages.
Multiphysics Integration: The results highlight the effectiveness of VERA’s integrated transport, depletion, and subchannel thermal hydraulics modeling in capturing tightly coupled feedback phenomena during rapid transients.
Benchmark-Based Validation: The study reinforced the utility of international benchmark exercises for validating advanced simulation tools and emphasized the importance of model reproducibility for future regulatory and research applications.
These findings confirm VERA’s suitability for advanced safety analysis and performance-based licensing frameworks, particularly in applications where detailed fuel behavior and time-at-temperature metrics are of critical interest. The validated model developed in this study lays the groundwork for future research on fuel performance under dryout conditions, integration with BISON, and UQ campaigns aimed at supporting cutting-edge reactor safety evaluations.
Author Contributions
Conceptualization, N.H. and R.S.; methodology, N.H., R.S. and M.A.; software, N.H. and R.S.; validation, N.H. and R.S.; formal analysis, N.H.; investigation, N.H. and R.S.; resources, N.H.; data curation, N.H.; writing—original draft preparation, N.H.; writing—review and editing, R.S. and M.A.; visualization, N.H.; supervision, M.A.; project administration, R.S.; funding acquisition, R.S. All authors have read and agreed to the published version of the manuscript.
Funding
This research was funded by the DOE program NEAMS.
Data Availability Statement
Acknowledgments
This work would not have been possible without the creation of the original VERA PB2 reactor model by Choi et al. [
11]. This research made use of the resources of the High-Performance Computing Center at Idaho National Laboratory, which is supported by the Office of Nuclear Energy of the U.S. Department of Energy (DOE) and the Nuclear Science User Facilities (NSUF) under Contract No. DE-AC07-05ID14517.
Conflicts of Interest
The authors declare no conflict of interest.
Abbreviations
The following abbreviations are used in this article:
| DOE | Department of Energy |
| BWR | boiling water reactor |
| PWR | pressurized water reactor |
| CASL | Consortium for Advanced Simulation of Light Water Reactors |
| CHF | critical heat flux |
| EOC | end of cycle |
| EPRI | Electric Power Research Institute |
| GE | General Electric |
| LWR | light water reactor |
| NEAMS | Nuclear Energy Advanced Modeling and Simulation |
| ORIGEN | Oak Ridge Isotope GENeration |
| PB2 | Peach Bottom Unit 2 |
| PBTT | Peach Bottom turbine trip |
| STH | simplified thermal hydraulics |
| UQ | uncertainty quantification |
| VERA | Virtual Environment for Reactor Applications |
| CTF | COBRA-TF |
References
- Ratnayake, R. Time-at-Temperature Operation of Light Water Reactors: Survey of Literature; Electric Power Research Institute (EPRI): Palo Alto, CA, USA, 2021. [Google Scholar]
- Carmichael, L.; Niemi, R. Transient and Stability Tests at Peach Bottom Atomic Power Station Unit 2 at End of Cycle 2; General Electric Company: San Jose, CA, USA, 1978. [Google Scholar]
- Solis, J.; Ivanov, K.; Sarikaya, B.; Olson, A.; Hunt, K. Boiling Water Reactor Turbine Trip (TT) Benchmark Volume I: Final Specifications; Nuclear Energy Agency Organisation for Economic Co-Operation and Development: Paris, France, 2001. [Google Scholar]
- Larsen, N. Core Design and Operating Data for Cycles 1 and 2 of Peach Bottom 2; General Electric Company: San Jose, CA, USA, 1978. [Google Scholar]
- Akdeniz, B.; Ivanov, K.; Olson, A. Boiling Water Reactor Turbine Trip (TT) Benchmark Volume II: Summary Results of Exercise 1; Nuclear Energy Agency Organisation for Economic Co-Operation and Development and Us Nuclear Regulatory Commission: Paris, France, 2005. [Google Scholar]
- Akdeniz, B.; Ivanov, K.; Olson, A. Boiling Water Reactor Turbine Trip (TT) Benchmark Volume III: Summary Results of Exercise 2; Nuclear Energy Agency Organisation for Economic Co-Operation and Development and Us Nuclear Regulatory Commission: Paris, France, 2006. [Google Scholar]
- Shiba, S.; Sakai, T. Core Modeling and Simulation of Peach Bottom 2 Turbine Trip Test 2 Using CASMO5/TRACE/PARCS. Nucl. Technol. 2021, 208, 371–383. [Google Scholar] [CrossRef]
- Henry, C.; Ivanov, B.D.; Grandi, G.M. Simulation of Peach Bottom turbine trip transients TT1, TT2 and TT3 with SIMULATE-3K. In Proceedings of the Physor 2022, Pittsburgh, PA, USA, 15–20 May 2022. [Google Scholar]
- Turner, J.; Clarno, K.; Sieger, M.; Bartlett, R.; Collins, B.; Pawlowski, R.; Schmidt, R.; Summers, R. The Virtual Environment for Reactor Applications (VERA): Design and architecture. J. Comput. Phys. 2016, 326, 544–568. [Google Scholar] [CrossRef]
- Williamson, R.; Hales, J.; Novascone, S.; Pastore, G.; Gamble, K.; Spencer, B.; Jiang, W.; Pitts, S.; Casagranda, A.; Schwen, D.; et al. BISON: A Flexible Code for Advanced Simulation of the Performance of Multiple Nuclear Fuel Forms. Nucl. Technol. 2021, 207, 954–980. [Google Scholar] [CrossRef]
- Choi, S.; Ward, A.; Graham, A.; Collins, B.; Kochunas, B.; Asgari, M. Preliminary Simulation Results of Peach Bottom Unit 2 Cycles 1 and 2 with MPACT. In Proceedings of the Physor 2022, Pittsburgh, PA, USA, 15–20 May 2022. [Google Scholar]
- Kim, K.; Williams, M.; Wiarda, D.; Clarno, K. Development of the multigroup cross section library for the CASL neutronics simulator MPACT: Method and procedure. Ann. Nucl. Energy 2019, 133, 46–58. [Google Scholar] [CrossRef]
- Collins, B.; Stimpson, S.; Kelley, B.; Young, M.; Kochunas, B.; Graham, A.; Larsen, E.; Downar, T.; Godfrey, A. Stability and accuracy of 3D neutron transport simulations using the 2D/1D method in MPACT. J. Comput. Phys. 2016, 326, 612–628. [Google Scholar] [CrossRef]
- Wieselquist, W.; Lefebvre, R.; Jessee, M. SCALE Code System; Oak Ridge National Lab: Oak Ridge, TN, USA, 2020. [Google Scholar]
- Graham, A.; Collins, B.; Salko, B.; Asgari, M. Multiscale thermal hydraulic coupling methods for boiling water reactor simulation. In Proceedings of the Physor 2022, Pittsburgh, PA, USA, 15–20 May 2022. [Google Scholar]
- Salko, R.; Avramova, M.; Wysocki, A.; Hizoum, B.; Toptan, A.; Hu, J.; Porter, N.; Blyth, T.; Dances, C.; Gomez, A.; et al. CTF Theory Manual: Version 4.3; Oak Ridge National Lab: Oak Ridge, TN, USA, 2022. [Google Scholar]
| Disclaimer/Publisher’s Note: The statements, opinions and data contained in all publications are solely those of the individual author(s) and contributor(s) and not of MDPI and/or the editor(s). MDPI and/or the editor(s) disclaim responsibility for any injury to people or property resulting from any ideas, methods, instructions or products referred to in the content. |
© 2025 by the authors. Licensee MDPI, Basel, Switzerland. This article is an open access article distributed under the terms and conditions of the Creative Commons Attribution (CC BY) license (https://creativecommons.org/licenses/by/4.0/).


