Abstract
The diagnosis of obesity is conventionally determined by the Body Mass Index (BMI), with a threshold of 30 being extensively accepted. However, the validity of this cutoff point is subject to variation due to ethnic differences, and its accuracy in the Mexican population remains unvalidated. This cross-sectional, observational, and analytical study endeavored to assess the diagnostic performance of BMIs ≥ 30 in comparison to body fat determination using bioimpedance. A total of 715 Mexican adults, aged over 18 years were analyzed. Anthropometric measurements, including weight, height, and BMI, were recorded, and body fat percentage was assessed. The results showed that BMIs ≥ 30 had a sensitivity of 62.4%, a specificity of 93.9%, a positive predictive value (PPV) of 95.5%, and a negative predictive value (NPV) of 54%. In contrast, a BMI cut-off of ≥27 demonstrated superior diagnostic performance, with a sensitivity of 81.3%, specificity of 82.5%, PPV of 90.8%, and NPV of 67.3%. The chi-square test revealed a significant difference in obesity diagnosis between bioimpedance and BMIs ≥ 30 (p < 0.05). These findings suggest that the current BMI cutoff of ≥30 underestimates obesity diagnosis, while a cutoff of ≥27 may provide a more accurate diagnostic threshold, emphasizing the necessity for population-specific adjustments.
1. Introduction
Obesity and overweight are recognized as complex, chronic, and multi-metabolic diseases characterized by excessive body fat and associated with numerous comorbidities [1]. In 2023, the World Obesity Federation (WOF) reported that no country has met international targets for reducing obesity prevalence, with a rising incidence observed, particularly in developing nations like Mexico. According to the 2023 National Health and Nutrition Survey (ENSANUT), 37.1% of Mexican adults aged 20 and older were classified as obese, based on a Body Mass Index (BMI) cutoff of ≥30 [2].
Projections suggest that global obesity levels will increase by more than 50% by 2035, underscoring the urgent need for effective prevention and early detection strategies [3,4]. This emphasizes the necessity for the development and implementation of effective primary prevention and early detection strategies. These efforts must prioritize the patient, incorporating individualized diagnostic criteria, with particular attention to ethnic variations, to enhance prevention and treatment outcomes [5]. The World Health Organization (WHO) has established the BMI as a standard metric for diagnosing obesity in adults, with cutoffs of ≥25 for overweight and ≥30 for obesity [6]. This approach is endorsed by prominent organizations such as the American College of Cardiology, the American Heart Association, and the American Association of Clinical Endocrinologists (AACE) [1]. Nevertheless, controversy persists regarding the applicability of these cutoffs to non-Caucasian populations. For instance, studies conducted in Asian populations have identified a lower BMI threshold (≥27) for diagnosing obesity [7]. Concurrently, research in Latin America, including studies by Herrera et al., suggests that BMI cutoffs should be adapted based on ethnic and demographic factors [8]. In India, Dudeja et al. demonstrated that conventional BMI cutoffs show low sensitivity and a poor negative predictive value (NPV), highlighting their limitations in certain populations [9].
In Mexico, the traditional BMI threshold of ≥30 may not accurately reflect obesity prevalence, as body composition may vary according to ethnicity and other demographic factors [10]. Misclassification due to discrepancies in fat and lean mass distribution is a concern, and this highlights the need to reassess BMI-based diagnostic criteria. With the high prevalence of obesity-related conditions like type 2 diabetes, hypertension, and cardiovascular diseases, developing more accurate, population-specific diagnostic measures is crucial for ensuring better health outcomes.
There are various methods for assessing body composition, each with its own accuracy and feasibility. While dual-energy X-ray absorptiometry (DEXA) is considered the gold standard, bioelectrical impedance analysis (BIA) offers a more accessible and practical alternative, particularly in resource-constrained settings. Studies show a strong correlation between BIA and DEXA (r = 0.89, 95% CI: 0.74–0.95), suggesting that BIA can be a valid reference when DEXA is unavailable [9,10,11].
The reliability of the BMI remains controversial, as it fails to differentiate between fat mass and lean mass, potentially leading to misclassification. This has led to the concept of “normal-weight obesity”, where individuals with a normal BMI may still have excess fat and increased health risks [10,12,13]. Studies have shown a strong link between excess body fat and increased cardiovascular morbidity and mortality, further emphasizing the need for more precise assessment methods [14].
The WOF estimates that the economic burden of overweight and obesity in Mexico is USD 23.17 billion, considering both direct and indirect costs [15]. Projections suggest that by 2050, Mexico’s gross domestic product could decrease by 5.3%, and health expenditures may increase by 8.9% due to the impact of obesity and related diseases [16]. Additionally, life expectancy in Mexico is expected to decrease by up to 4.2 years by 2050 [17].
The present study aims to evaluate the diagnostic performance of the BMI in the Mexican population, comparing it with BIA, which was used as the reference method due to its accessibility and feasibility in clinical practice. By doing so, this study can provide critical insights to optimize obesity diagnostic methods, ultimately contributing to improved prevention and treatment strategies in public health.
2. Materials and Methods
2.1. Study Design
An observational, cross-sectional, analytical study was conducted to evaluate the diagnostic performance of the BMI for obesity classification in comparison with BIA, which served as the reference method. The study was carried out in a clinical setting in Mexico City, targeting adult individuals attending routine medical evaluations. This design allowed for the simultaneous measurement of the BMI and body composition parameters, facilitating the comparison between both methods at a single point in time.
2.2. Participants
A convenience sampling method was employed to recruit participants from two primary sources: the Obesity and Overweight Clinic and employees from the Spanish Hospital. The clinic was specifically chosen due to its focus on obesity management.
A total of 715 Mexican adults were included in the study, recruited between 1 July 2022 and 30 July 2022. Of these, 398 participants were personnel working at the Spanish Hospital of Mexico, and 317 were patients from the Obesity Clinic.
Inclusion criteria included the following: adults aged 18 years or older, Mexicans, voluntary consent to participate in the study, and willingness to undergo body composition measurements.
Exclusion criteria included the following: presence of pacemakers, orthoses, prostheses, metallic implants, or any other devices that might interfere with BIA measurements, history of amputation, dehydration, edema, tumors, and pregnant or breastfeeding women.
2.3. Data Collection
After consenting to participate, the following data were collected from the participants: identification, sex, age, habitual medication, personal medical history, weight in kilograms, height in meters, percentage of body fat, percentage of muscle mass, kilograms of lean mass, total body water, and abdominal and hip circumference. Subsequently, BMIs were calculated using the formula:
BMI = weight/height2
For the BIA measurement with InBody230 equipment (InBody USA, Cerritos, CA, USA), participants were asked to maintain a normal standing posture with arms and legs extended, removing heavy clothing and accessories when possible, to reduce study biases. A separation of approximately 15 degrees between the arms and body was maintained, ensuring full electrode contact with the participant’s body.
According to standards established by the WHO, the term “overweight” is characterized as a body fat percentage ranging from 30% to 34.9% in women and from 21% to 24.9% in men. The term “obesity” is defined as a body fat percentage of 35% or more in women and 30% or more in men, evaluated with bioimpedance as the reference test. The participants were classified according to BMIs, in accordance with WHO criteria, as follows: normal with a value of 18 to 24.9, overweight with a value of 25 to 29.9, grade 1 obesity with 30 to 34.9, grade 2 obesity with 35 to 39.9, and grade 3 obesity with a value of 40 or higher.
2.4. Ethical Considerations
The study was approved by the scientific committee of the Spanish Hospital following the Helsinki declaration, and all participants provided informed consent prior to inclusion. Confidentiality of personal data and results was ensured in accordance with established ethical guidelines.
2.5. Statistical Methods
Primary objective: To determine the diagnostic performance of BMIs ≥ 30 compared to bioimpedance as the reference test.
Secondary objective: To determine a cut-off point with the highest sensitivity and specificity compared to the reference test. To evaluate the difference between prevalences according to the methods used, in addition to comparison with the reported national prevalence.
An analysis of the proportion of diagnoses between the BMI and BIA was conducted using the chi-squared test. Diagnostic parameters, including sensitivity (Se), specificity (Sp), positive predictive value (PPV), negative predictive value (NPV), positive likelihood ratio (LR+), and negative likelihood ratio (LR-), were calculated using the following formulas:
- Se = true positives (TP)/true positives + false negatives (FN).
- Sp = true negatives (TN)/true negatives + false positives (FP).
- PPV = TP/TP + FP.
- NPV = FN/FN + TN.
- LR+ = Se/1 − Sp.
- LR− = 1 − Se/Sp.
- Accuracy= TP + TN/TP + TN + FP + FN.
In addition, a Receptor Operating Characteristic (ROC) curve was used to identify the optimal BMI cut-off point. This cut-off point was determined using the Youden index, both for the general group and for the subpopulations stratified by sex. After determining the optimal cut-off point, the parameters of the corresponding diagnostic tests were recalculated to evaluate their performance in relation to the new diagnosis cut-off point of obesity.
The predictive values obtained in our study were corrected to the prevalence of the disease in Mexico, which is 37.1%, using the following formulas:
Adjusted PPV = Se × prevalence/[(Se × prevalence + (1 − Sp) × (1 − prevalence)]
Adjusted NPV = Sp × (1 − prevalence)/[(1 − Se) × prevalence + Sp × (1 − prevalence)]
For the description of the results of diagnostic tests, confidence intervals were calculated for proportions with a z-value of 0.05 using the following formula:
CI = p ± Z ⋅ √(p(1 − p)/n)
Cohen’s kappa coefficient was used to evaluate the concordance between the results obtained with the BMI and the bioimpedance, using the following formula:
where Po = observed concordance and Pe = concordance expected by chance. This index measures the agreement between two tests, adjusting the observed coincidence for that which could occur by chance. The kappa values were interpreted as follows:
k = Po − Pe/1 − Pe
- 0.01 to 0.20: Very low agreement;
- 0.21 to 0.40: Low agreement;
- 0.41 to 0.60: Moderate agreement;
- 0.61 to 0.80: Good agreement;
- 0.81 to 1.00: Almost perfect agreement.
A kappa value close to 1.00 would indicate an excellent concordance between the two tests, while lower values would suggest limited agreement. This measure made it possible to evaluate whether the BMI is a reliable test for diagnosing obesity in comparison with BIA.
The main aim of this study was to ensure that the BMI does not falsely diagnose obese people as non-obese (FN). This is a crucial aspect in the early diagnosis of obesity, as obesity is associated with a number of serious health complications. To avoid this type of error, we carefully selected a BMI cut-off point that would provide a high Se, NPV, accuracy, and concordance and a lower LR-, ensuring that the majority of people with obesity would be correctly identified, even if this might mean an increase in FPs. This approach aims to prioritize the early detection of obesity over the exclusion of non-obese individuals, as the consequences of missing an obese individual are far more serious than the risks associated with misdiagnosing obesity in a healthy individual. This principle guided the choice of test parameters and their comparison with the reference test.
To compare the different prevalences of obesity diagnosis, the z-test for proportions was used for the ENSANUT and BIA, BMI ≥ 30, and BMI ≥ 27 data.
Statistical analysis was carried out using SPSS version 23 software.
3. Results
3.1. Patient Characteristics
The study variables were percentage of body fat (PGC), BMI, weight, age and height. The sociodemographic characteristics were: mean age 41 ± 12.7 years, mean height 1.65 m (SD 0.09), mean weight 82 kg, mean BMI 29.8 and mean PGC 35%. The sex distribution was 411 women (57.5%) and 304 men (42.5%) p < 0.001. Table 1.

Table 1.
Descriptive statistics.
3.2. Primary Outcome: The Performance of the BMI ≥ 30
The reference test (BIA) diagnosed obesity in 487 (68.1%) of the 715 individuals. While a BMI ≥ 30 diagnosed obesity in 304 (42.5%) of the 715 individuals. The comparison of proportions of obesity diagnosis with these two methods yielded a p-value of 0.004 using the chi-square test.
The BMI ≥ 30 obtained the following data: TP—304, FP—14, FN—183, and TN—214, with the following diagnostic parameters: Se—62.4%, Sp—93.9%, PPV—95.5%, NPV—54.0%, LR+—10.16, and LR−—0.40, accuracy—72.5%, and Kappa coefficient—k = 0.574.
3.3. Secondary Outcomes
3.3.1. New BMI Cut-Off Point
A ROC curve was performed for the entire sample, showing that the point of highest performance is at a BMI ≥ 27.05 and an area under the curve of 0.898 (Figure 1). With the new cut-off point, the following parameters were obtained: TP—396, FN—91, FP—40, and TN—188. The application of the revised cutoffs yielded a patient diagnosis of obesity rate of 60.97%, contrasting with the 68.1% rate determined by BIA. This discrepancy was found to be statistically significant, as indicated by a p-value of 0.03 in the chi-square test. In addition, the Cohen’s kappa concordance was k = 0.687, with a Se of 81.3%, Sp of 82.5%, PPV of 90.8%, of NPV 67.3%, and accuracy of 81%. The positive and negative likelihood ratios were 4.63 and 0.22, respectively (Table 2).
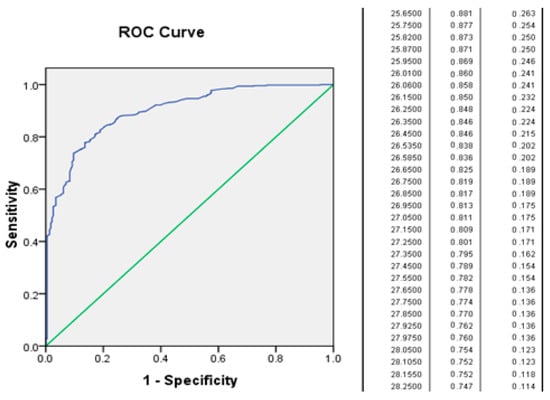
Figure 1.
Diagnosis of obesity according to BMI.
Table 2.
Comparison of diagnostic parameters between BMI ≥ 30, BMI ≥ 27, and bioimpedance in the identification of obesity.
In the analysis according to sex, the following was documented: in females, the maximum performance point in BMI was ≥27, with a Se of 0.829 and 1 − Sp of 0.169 (Sp: 83%). In the male sex, the maximum performance point was 26.6, with a Se of 0.807 and 1 − Sp of 0.209 (Sp: 79%).
3.3.2. Comparison of Prevalences According to the Methods Used
According to the results of the ENSANUT, the prevalence of obesity (BMI ≥ 30) in the Mexican population is 37.1%. The following prevalences were obtained in our study: the BMI ≥ 30 category had a prevalence of 42.5%, the BIA category had a prevalence of 68.1%, and the BMI ≥ 27 category had a prevalence of 60.9%. The Z-test for the difference in proportions yielded the following result:
- ENSANUT vs. IMC30 from our study: Z = 2.96, p = 0.0031;
- ENSANUT vs. BIA: Z ≈ 16.92, p < 0.0001;
- IMC30 vs. BIA: Z= −9.74, p < 0.0001;
- IMC27 vs. IMC30: Z = −6.96, p < 0.0001;
- IMC27 vs. BIA: Z= −2.84, p = 0.0044.
3.3.3. Correction of Predictive Values to Prevalence According to ENSANUT
When correcting the predictive values for prevalence in Mexico, the following values were obtained: BMI ≥ 30 PPV—85.7% [95% CI 81.5, 88.9] and NPV—80.9% [95% CI 78.0, 82.9]; BMI ≥ 27 PPV—73.4% [95% CI 70.2, 76.2] and NPV—88.2% [95% CI 85.3, 90.5].
4. Discussion
The present study found a prevalence of obesity in the sample of 42.5%, which is remarkably similar to the 37.1% reported by the ENSANUT using the same cut-off point (BMI ≥ 30 kg/m2) [2]. However, a significant statistical difference was observed. While the discrepancy with the reference method (BIA) is more pronounced, with a difference of 68%, indicating that a BMI ≥ 30 underestimates the prevalence of obesity, particularly in populations such as the Mexican one, it is important to note that the new BMI cutoff point of ≥27 has been demonstrated to effectively rectify this underestimation, thereby offering more precise identification of obesity and demonstrating greater Se and NPV. Moreover, this threshold exhibited enhanced precision and concordance (κ) in comparison to BMIs ≥ 30, further substantiating its aptitude for the identification of obesity within this demographic group. The findings emphasize the necessity to re-evaluate the existing BMI cutoffs to enhance diagnostic precision and refine the methodology of population studies. The observed discrepancy between BMI-based methods and BIA suggests the need to explore alternative diagnostic approaches for more effective identification and management of obesity.
The applicability of the BMI varies across different populations. For example, Fernandez et al. conducted a study with the Spanish population, which suggested an optimal BMI of 27.5 [10]. Meanwhile, Herrera et al. conducted a study with the Latin American population, which identified 27 as the optimal cut-off point [5]. The findings of this study are consistent with these observations, identifying a BMI of 27 as the optimal diagnostic threshold for Mexican individuals.
The present study aligns with the findings of Reyes et al. who observed that the measurement of body fat diagnosed overweight and obesity more accurately than BMI in breast cancer patients [18]. This observation suggests that the BMI cutoff point of 30 may not adequately capture the body fat composition of Mexican individuals. This discrepancy can be attributed to the imperfect correlation between BMI and body fat, as evidenced by Llamosas et al.’s study, which demonstrated a correlation coefficient of 0.71 [19]. The observed discrepancy could also be attributed to other factors, such as the population’s height, which has been shown to influence the PGC relative to the BMI [5].
The variability in the diagnostic performance of the BMI has been evidenced in multiple clinical care guidelines, which specify different cut-off points for the diagnosis of obesity in different populations. For instance, in the Asian population, obesity is defined as a BMI ≥ 27.5, as indicated by the National Institute of Health and Clinical Excellence of Canada and AACE guidelines, or alternatively, a BMI ≥ 25 in the Korean population [1,7,15]. However, international guidelines do not explicitly address the Latino or Mexican population. Another salient aspect pertains to the distribution of body fat, which exhibits variation between sexes, a dimension that the BMI, in general, fails to consider.
In our study, we observed that the cutoff point varied between men and women; however, the values were highly comparable. Consequently, we hypothesized that a BMI of ≥27 could be extrapolated to facilitate the implementation of the new cutoff point without substantially compromising its diagnostic efficacy.
According to studies on health policy conducted by the Organization for Economic Cooperation and Development (OECD), the prevalence of overweight, obesity, and related diseases is projected to result in a decline in life expectancy by an average of 2.7 years over the ensuing 25-year period within the member countries of the OECD. For instance, in Mexico, the anticipated reduction in life expectancy is estimated to be 4.2 years [3,4]. This underscores the pressing need for the timely and precise diagnosis of these conditions, underscoring the imperative for the adoption of a primary prevention model. One potential solution to this problem is to lower the BMI threshold to ≥27, which has been shown to improve the detection of obesity and allow more timely interventions for at-risk individuals, without the need to implement other techniques in mass screening tests.
The implementation of such a strategy would facilitate the development of more effective preventive measures, thereby contributing to a reduction in the economic burden of obesity in Mexico. This burden is currently estimated at USD 23.17 billion, encompassing both direct and indirect healthcare expenditures, including years of life lost and premature mortality from associated diseases [16]. While this adjustment increases the number of patients classified as obese, in the long term, it could generate significant savings. A primary prevention approach, centered on the timely detection and management of obesity in its nascent stages, holds considerable potential in averting chronic diseases such as type 2 diabetes and cardiovascular disease. This, in turn, would contribute to a reduction in healthcare expenditures and a corresponding alleviation of the healthcare system’s burden.
The present study is not without its limitations. First, the sample was heterogeneous in terms of age, which prevented a detailed analysis of BMI cut-off points in different age groups. Additionally, the absence of an evaluation of pertinent comorbidities, including but not limited to diabetes and hypertension, hinders a comprehensive understanding of the risks associated with excess adiposity. The absence of adjustments for factors such as socioeconomic status and physical activity also reduces the generalizability of the results, emphasizing the need to validate the BMI ≥ 27 threshold in more representative samples.
The prevalence of the disease, utilizing the same cut-off point reported in the ENSANUT, was higher in our sample. This phenomenon is hypothesized to be a consequence of the selection of patients in a concentration center, specifically in an obesity care clinic. However, when the data were corrected by Bayesian analysis towards the population prevalence in Mexico, the predictive values maintained a favorable trend with the new cutoff point, especially in terms of the NPV, which supports the internal validity of the results. However, it is imperative to note that these findings require validation in a homogeneous population to ensure their generalizability. Additionally, a discrepancy in diagnostic accuracy between male and female subjects was identified, indicating the possible need to adapt BMI thresholds according to gender. This observation necessitates further validation through population-based epidemiological studies. Despite its accessibility and usefulness, the accuracy of BIA is susceptible to factors such as hydration. However, its strong correlation with the DEXA method (r = 0.89) supports its validity as a diagnostic tool, particularly in settings with limited resources [20].
The proposal entails the utilization of a BMI with a cut-off point of ≥27 kg/m2, a threshold that has been demonstrated to enhance Se and augment the NPV. This approach is expected to achieve better discrimination of sick patients by reducing FNs by 75%. Consequently, a BMI of ≥30 fails to identify patients who have been designated as “normal weight obese”. The initial treatment approach, which involves diet and exercise, is characterized by its simplicity, cost-effectiveness, accessibility, and minimal adverse effect profile. This treatment strategy is particularly well suited for a large-scale implementation, as it can be applied to a substantial number of individuals, in contrast to the alternative of leaving some patients untreated.
The study’s notable strength derives from its considerable sample size, which enhances the robustness of the results. Despite the fact that the prevalence of obesity in the study population exceeded that of the general population, this did not affect the sensitivity, specificity, or likelihood ratios of the study. Consequently, the findings can be adapted to regional prevalences, allowing the use of predictive values that are beneficial in clinical practice. Another point of strength was the evaluation of the BMI by sex, although a slight discrepancy was observed. To ensure epidemiological and pragmatic convenience, the BMI for both sexes was equated to 27.
It is recommended that future studies include a more detailed evaluation of comorbidities in the populations analyzed. This will facilitate the enhancement of diagnostic methodologies and the customization of preventive and therapeutic approaches, particularly in contexts characterized by high obesity prevalence. It is imperative to validate the BMI threshold of ≥27 in more diverse and representative samples of the Mexican population, considering variations in age, ethnicity, socioeconomic status, and lifestyle habits to ensure its applicability. Furthermore, analysis models must be adjusted to account for confounding factors, such as physical activity and age distribution, which could have influenced the results and the accuracy of the diagnosis.
5. Conclusions
Adopting a BMI cutoff of ≥27 kg/m2 improves sensitivity, reduces false negatives, and better reflects obesity prevalence in the Mexican population. Given the simplicity, scalability, and affordability of interventions like diet and exercise, implementing this change could enhance obesity prevention and improve health outcomes on a national scale. Future studies should validate these findings in more representative and diverse populations, incorporating comorbidities, socioeconomic variables, and lifestyle factors to refine diagnostic tools and guide public health strategies.
Author Contributions
Conceptualization, J.A.A.S.P., D.R.A.S., L.M.M.B., and E.C.M.; methodology, J.A.A.S.P. and D.R.A.S.; software, J.A.A.S.P.; validation, L.M.M.B. and J.A.A.S.P.; formal analysis, J.A.A.S.P. and D.R.A.S.; investigation, J.A.A.S.P. and E.C.M.; resources, L.M.M.B.; data curation, E.C.M.; writing—original draft preparation, J.A.A.S.P., D.R.A.S., and E.C.M.; writing—review and editing, J.A.A.S.P. and D.R.A.S.; visualization, J.A.A.S.P.; supervision J.A.A.S.P. and L.M.M.B.; project administration, J.A.A.S.P. and L.M.M.B.; funding acquisition, L.M.M.B. All authors have read and agreed to the published version of the manuscript.
Funding
This study was funded by the Sociedad de Beneficencia Española I.A.P., associated with the Spanish Hospital of Mexico. No specific grant number was assigned.
Institutional Review Board Statement
The study protocol was approved by the Scientific Committee of the Spanish Hospital of Mexico, México, Mexico City (No. ENS-2022-T014), and complied with the ethical guidelines of the 2000 Helsinki Declaration.
Informed Consent Statement
Informed consent was obtained from all subjects involved in the study.
Data Availability Statement
Data availability statements are available upon request, through the corresponding author.
Acknowledgments
The authors would like to express their gratitude to all participants who underwent the voluntary health check-up, as well as to the data collection staff at the Obesity and Overweight Clinic at the Spanish Hospital of Mexico.
Conflicts of Interest
The authors declare no conflicts of interest.
Abbreviations
The following abbreviations are used in this manuscript:
| AACE | American Association of Clinical Endocrinology |
| AMA | American Medical Association |
| BIA | Bioelectrical impedance analysis |
| BMI | Body Mass Index |
| DEXA | Dual-energy X-ray absorptiometry |
| ENSANUT | National Health and Nutrition Survey |
| FNs | False negatives |
| FPs | False positives |
| LR- | Negative likelihood ratio |
| LR+ | Positive likelihood ratio |
| NPV | Negative Predictive Value |
| OECD | Organization for Economic Cooperation and Development |
| PGC | Percentage of body fat |
| PPV | Positive Predictive Value |
| ROC | Receiver Operating Characteristic |
| Se | Sensitivity |
| Sp | Specificity |
| TNs | True negatives |
| TPs | True positives |
| WHO | World Health Organization |
| WOF | The World Obesity Federation |
References
- Garvey, W.T.; Mechanick, J.I.; Brett, E.M.; Garber, A.J.; Hurley, D.L.; Jastreboff, A.M.; Nadolsky, K.; Pessah-Pollack, R.; Plodkowski, R.; Reviewers of the AACE/ACE Obesity Clinical Practice Guidelines. AACE/ACE obesity clinical practice guidelines: Comprehensive clinical practice guidelines for medical care of patients with obesity. Endocr. Pract. 2016, 22 (Suppl. 3), 1–203. [Google Scholar] [CrossRef] [PubMed]
- Barquera, S.; Hernández-Barrera, L.; Oviedo-Solís, C.; Rodríguez-Ramírez, S.; Monterrubio-Flores, E.; Trejo-Valdivia, B.; Martínez-Tapia, B.; Aguilar-Salinas, C.; Galván-Valencia, O.; Chávez-Manzanera, E.; et al. Obesidad en adultos. Salud Publica Mex. 2024, 66, 414–424. [Google Scholar] [CrossRef] [PubMed]
- Mahase, E. Global cost of overweight and obesity will hit $4.32 trillion a year by 2035, report warns. BMJ 2023, 380, p523. [Google Scholar] [CrossRef] [PubMed]
- Blüher, M. Obesity: Global epidemiology and pathogenesis. Nat. Rev. Endocrinol. 2019, 15, 288–298. [Google Scholar] [CrossRef] [PubMed]
- López-Alvarenga, J.C.; A Montesinos-Cabrera, R.; Velázquez-Alva, C.; González-Barranco, J. Short stature is related to high body fat composition despite body mass index in a Mexican population. Arch. Med. Res. 2003, 34, 137–140. [Google Scholar] [CrossRef] [PubMed]
- Komaroff, M. Historical review of developing body weight indices: Meaning and purpose. Adv. Obes. Weight Manag. Control 2017, 6, 184–192. [Google Scholar] [CrossRef]
- Kim, K.-K.; Haam, J.-H.; Kim, B.T.; Kim, E.M.; Park, J.H.; Rhee, S.Y.; Jeon, E.; Kang, E.; Nam, G.E.; Koo, H.Y.; et al. Evaluation and treatment of obesity and its comorbidities: 2022 update of clinical practice guidelines for obesity by the Korean Society for the Study of Obesity. J. Obes. Metab. Syndr. 2023, 32, 1–24. [Google Scholar] [CrossRef] [PubMed]
- Herrera, V.M.; Casas, J.P.; Miranda, J.J.; Perel, P.; Pichardo, R.; González, A.; Sánchez, J.R.; Ferreccio, C.; Aguilera, X.; Silva, E.; et al. Interethnic differences in the accuracy of anthropometric indicators of obesity in screening for high risk of coronary heart disease. Int. J. Obes. 2009, 33, 568–576. [Google Scholar] [CrossRef] [PubMed]
- Dudeja, V.; Misra, A.; Pandey, R.; Devina, G.; Kumar, G.; Vikram, N. BMI does not accurately predict overweight in Asian Indians in northern India. Br. J. Nutr. 2001, 86, 105–112. [Google Scholar] [CrossRef] [PubMed]
- Fernández-Real, J.M.; Vayreda, M.; Casamitjana, R.; Ricart, W.; Saez, M. Body mass index (BMI) and fat mass percentage: BMI greater than 27.5 kg/m² could imply obesity in the Spanish population. Med. Clin. 2001, 117, 681–684. [Google Scholar] [CrossRef]
- Velázquez-Alva, M.C.; Irigoyen-Camacho, M.E.; Zepeda-Zepeda, M.A.; Rangel-Castillo, I.; Arrieta-Cruz, I.; Mendoza-Garcés, L.; Castaño-Seiquer, A.; Flores-Fraile, J.; Gutiérrez-Juárez, R. Comparison of body fat percentage assessments by bioelectrical impedance analysis, anthropometrical prediction equations, and dual-energy X-ray absorptiometry in older women. Front. Nutr. 2022, 9, 978971. [Google Scholar] [CrossRef] [PubMed] [PubMed Central]
- Vos, A. Obesity and the heart: The impact of obesity beyond the body mass index. Eur. J. Prev. Cardiol. 2020, 27, 2004–2005. [Google Scholar] [CrossRef] [PubMed]
- Zhu, Q.; Huang, B.; Li, Q.; Huang, L.; Shu, W.; Xu, L.; Deng, Q.; Ye, Z.; Li, C.; Liu, P. Body mass index and waist-to-hip ratio misclassification of overweight and obesity in Chinese military personnel. J. Physiol. Anthr. 2020, 39, 24. [Google Scholar] [CrossRef] [PubMed]
- Tapking, C.; Benner, L.; Hackbusch, M.; Schüler, S.; Tran, D.; Ottawa, G.B.; Krug, K.; Müller-Stich, B.P.; Fischer, L.; Nickel, F. Influence of body mass index and gender on stigmatization of obesity. Obes. Surg. 2020, 30, 4926–4934. [Google Scholar] [CrossRef] [PubMed]
- World Obesity Federation. World Obesity Atlas 2024. World Obesity Federation. 2024. Available online: https://data.worldobesity.org/publications/?cat=22 (accessed on 20 March 2025).
- OECD/The World Bank. Health at a Glance: Latin America and the Caribbean 2020; OECD Publishing: Paris, France, 2020. [Google Scholar] [CrossRef]
- OECD. The Heavy Burden of Obesity: The Economics of Prevention, OECD Health Policy Studies; OECD Publishing: Paris, France, 2019. [Google Scholar] [CrossRef]
- Reyes Barretero, D.Y.; Cruz Castillo, A.B.; Jaimes Alpízar, E.; Carmona Vilchis, J.; Cabrera Galeana, P.A.; Sánchez Flores, D.P.; Barrera Franco, J.L. Prevalence overweight and obesity to the Body Mass Index and percentage of fat in patients with breast cancer. Nutr. Clín. Diet. Hosp. 2016, 36, 10–13. [Google Scholar] [CrossRef]
- Regina, L.-S.; Livia, M.B.; Alejandro, A.S.P.J. Concordance between body fat percentage established by bioimpedance and estimation formulas based on anthropometric measurements. Adv. Obes. Weight. Manag. Control 2021, 11, 159–166. [Google Scholar] [CrossRef]
- Gupta, N.; Balasekaran, G.; Govindaswamy, V.V.; Hwa, C.Y.; Shun, L.M. Comparison of body composition with bioelectric impedance (BIA) and dual energy X-ray absorptiometry (DEXA) among Singapore Chinese. J. Sci. Med. Sport 2011, 14, 33–35. [Google Scholar] [CrossRef] [PubMed]
Disclaimer/Publisher’s Note: The statements, opinions and data contained in all publications are solely those of the individual author(s) and contributor(s) and not of MDPI and/or the editor(s). MDPI and/or the editor(s) disclaim responsibility for any injury to people or property resulting from any ideas, methods, instructions or products referred to in the content. |
© 2025 by the authors. Licensee MDPI, Basel, Switzerland. This article is an open access article distributed under the terms and conditions of the Creative Commons Attribution (CC BY) license (https://creativecommons.org/licenses/by/4.0/).