Article

Spatial Analysis of Metabolic Equivalents of Task Among Females in Urban and Rural Ghana

by
Sally Sonia Simmons
Department of Social Policy, London School of Economics and Political Science, London, WC2A 2AE, UK
Obesities 2025, 5(2), 33; https://doi.org/10.3390/obesities5020033
Submission received: 24 April 2025 / Revised: 1 May 2025 / Accepted: 2 May 2025 / Published: 3 May 2025

Abstract

:
(1) Background: Spatial energy expenditure patterns, driven by physical activity, particularly among females, remain underexplored in Ghana. This study, therefore, investigates spatial energy expenditure clustering or dispersion patterns using metabolic equivalents of task (METs) values among Ghanaian females across rural and urban areas. (2) Methods: Using 13,799 data from the 2022 Ghana Demographic and Health Survey, METs values were assigned to self-reported occupation categories as proxies for physical activity. Global and local spatial autocorrelation metrics (Queen contiguity and Moran’s I) were employed to assess spatial clustering or dispersion of METs values across the 16 administrative regions. (3) Results: Rural females reported higher METs (mean = 3.35 ± 1.627) and lower BMI (23.476 ± 3.888) than urban females (METs: mean = 2.42 ± 1.208, BMI: 25.313 ± 4.854). There was a significant but weak global spatial autocorrelation (Moran’s I = 0.003, p-value = 0.001), with stronger clustering observed in rural (Moran’s I = 0.004, p-value = 0.001) than in urban areas (Moran’s I = 0.002, p-value = 0.002). Also, High–High clusters were prevalent in the Northern, Savannah and Northeast regions particularly due to the lingering labour-intensive occupations as compared to Low–Low clusters in the Eastern and Greater Accra regions where jobs are often desk-based and sedentary. (4) Conclusions: Given the revealed geographic heterogeneity (High–High and Low–Low clustering) of female energy expenditure in Ghana, there is a need for regionally tailored health policies targeting physical inactivity and its associated risks.

1. Introduction

Energy expenditure is a critical determinant of health, especially in countries such as Ghana, where the burden of obesity and non-communicable diseases (NCDs) continues to increase. Notably, energy expenditure is associated with physical activity, which serves as both a salient driver of health and a measurable indicator of physiological exertion [1]. On the one hand, physical activity is a conventional determinant of health outcomes, including known NCD associations, mental well-being and quality of life, in general [2]. For instance, a Lee et al. [3] study on the impact of physical activity on major NCDs revealed that increasing physical activity among the inactive in Ghana will increase the nation’s life expectancy by about 0.49 years. Also, the inverse association between self-reported physical activity and type 2 diabetes incidence is well reported [4]. On the other hand, physical activity manifests as an important quantifiable energy expenditure indicator [4]. Metabolic equivalent (METS), the standardised unit for quantifying energy expenditure, measures the energy cost (expenditure) level associated with specific activities. Moderate physical activities yield 3.0–5.9 METS, whereas vigorous activities may generate about 6.0+ METS, unlike physical inactivity, which yields ≤ 1.5 METS. Physical activities such as running or jogging, swimming, cycling and brisk walking yield about 7 or more, 5, 4.5 and 4 METS values, respectively, while prolonged sitting or sleeping generates about ~1.5 or less METS [5,6,7]. The former group shows moderate to vigorous energy expenditure, whereas the latter shows low energy expenditure, correlating with central obesity and an increased risk of cardiometabolic diseases and NCDs, in general [8].
The application of METS for quantifying energy expenditure per physical activity provides a framework for comparability between populations and geographical areas. First, males and females exhibit varying levels of physical activity and energy expenditure, with males showing higher levels of physical activity than females [9]. This disparity corresponds with the perilous health implications, including risk or incidence of cardiometabolic disease, and cancer, associated with occupational, leisure or household activities in females than in males [6,10,11]. Second, specific regions of Ghana exhibit shared similarities in activities, especially occupational activities associated with energy expenditure. For instance, labour-intensive agricultural activities are predominant in all regions of Ghana, with the forest and Northern belts, comprising Ashanti, Ahafo, Western North, Eastern, Bono, Oti, Bono East, Northern, and Savannah regions, showing the most significant prevalence [12]. On the contrary, most services and professional activities are widely distributed in the forest and coastal belts, especially in Greater Accra and Ashanti, compared to the Northern and Savannah belts, which include the Savannah, Northeast, Upper East and Upper West regions. Additionally, urban and rural differences augment the intensity and concentration of occupational activities [13]. Thus, by applying standard METS values, these activities can be measured to compare energy expenditures among females in urban and rural areas across different regions of Ghana. Such data will inform policy formulation, support further energy expenditure research and enhance the comprehension of disease epidemiology.
Comprehending the spatial variations in METS can provide insights into population-level physical activity dynamics to inform targeted interventions further. However, the quantification of the METS in countries like Ghana has been underexplored because of inherent challenges in acquiring data. Self-reported activity data are usually plagued by inconsistencies, recall bias and cultural differentials in activity perception, and are, therefore, unreliable. In addition, surrogate measures, such as occupational activities, have been overlooked as proxies for leisure or household or physical activities in general, leading to incomplete or inaccurate energy expenditure (EE) quantification. There is also a limited understanding of how METS vary across geographic regions in Ghana, even though sedentary lifestyles and low energy expenditure behaviours are implicated in the emergence of numerous health challenges in the country [14,15]. These gaps impede the mapping of spatial convergence or divergence in METS estimates, particularly whether METS values or physical activity levels in one location correlate with those in neighbouring locations to reveal clustering or dispersion patterns. Accordingly, the present study investigates spatial patterns of METS among females in rural and urban Ghana, aiming to uncover regional trends and spatial dependencies that may inform national health policy and regional planning. Specifically, the study answers the following questions: 1. What are the spatial patterns and regional variations in METS among females across different regions? 2. How do these regional patterns of METS among females differ between urban and rural areas across different regions?

2. Materials and Methods

2.1. Context

Ghana is a West African country undergoing rapid urbanisation and socioeconomic transitions. The country also has sixteen (16) administrative regions (see Figure 1). Across these regions, there exists a varying prevalence of occupation types [12,13] and associated levels of physical activity. Occupational statistics in Ghana show that about 75 to 79% of all residents’ employment in the Oti, Savannah and North East regions stems from the agrarian sector. In contrast, industrial sector jobs, manufacturing and processing industries, range from 4.1% in the Northeast to 23.7% in Western regions. The Greater Accra (22.5%) and Western (23.7%) regions also have more industrial occupations than the Oti (5.5%) and Northern (6%) regions. The service sector is most prominent in the Greater Accra (71%) and Ashanti (53.5%) regions, whereas North East (16.2%) and Savannah (16.3%) have the lowest service sector engagement [13]. Also, there are disparities in urbanisation and socioeconomic transitions at the regional level [13,16]. The lingering disparities present a distinct context for investigating the spatial characteristics of occupations translated into METS values. By integrating a geospatial analysis with socioeconomic and health information, this research contributes to the growing body of literature on the spatial epidemiology of physical activity in Ghana and Africa.

2.2. Data and Data Source

The study sourced the Ghana Standard Demographic and Health Survey Programme (DHS) (individual recode [IR]) 2022 data (see Figure 2) [18]. The DHS programme is a United States Agency for International Development (USAID)-funded programme that provides large-scale health and population survey data for many low- and middle-income countries (LMICs) [19]. The sourced data were collected in collaboration with the host country (Ghana) government and other partners and conformed to the legal standards for population-based studies in Ghana [20,21]. Also, the sourced data were the most recent GDHS and accounted for recent developments, including societal health shifts and activity patterns. Specifically, the 2022 GDHS is the eighth repeated cross-sectional standard DHS conducted since the maiden survey in 1988. The GDHS data collection process utilised structured questionnaires, a cross-sectional design and a multistage sample approach. A total of 15,014 Ghanaian females became the respondents of the GHDS. This study followed the guidelines of the Strengthening the Reporting of Observational Studies in Epidemiology (STROBE) checklist.

2.3. Variables, Covariates, Inclusion and Exclusion Criteria

2.3.1. Variables and Covariates

Variables were selected from geographic, sociodemographic and health domains (e.g., age, wealth, education, occupation, residence, regions, geocoordinates and BMI). Age, education, wealth and BMI were the controls. These covariates were employed to ensure that the observed differences in the dependent variable were not solely due to differences in these characteristics between the study participants [22,23]. The study included BMI as a control because of its association with METS [24]. Occupation became the proxy variable for physical activity because of the limited GDHS information on physical activities, and more importantly, because engagement in occupational activities results in some level of energy expenditure [6,10,11]. Thus, different jobs were assigned specific METS values based on similarity with the activities specified by the National Cancer Institute, USA [7,25]. The newly assigned METS values for the type of occupation became the metabolic equivalent of task (METs) values (see Table 1). The study included residence, urban and rural and region variables to allow for the spatial analytics of the METs.

2.3.2. Inclusion and Exclusion Criteria
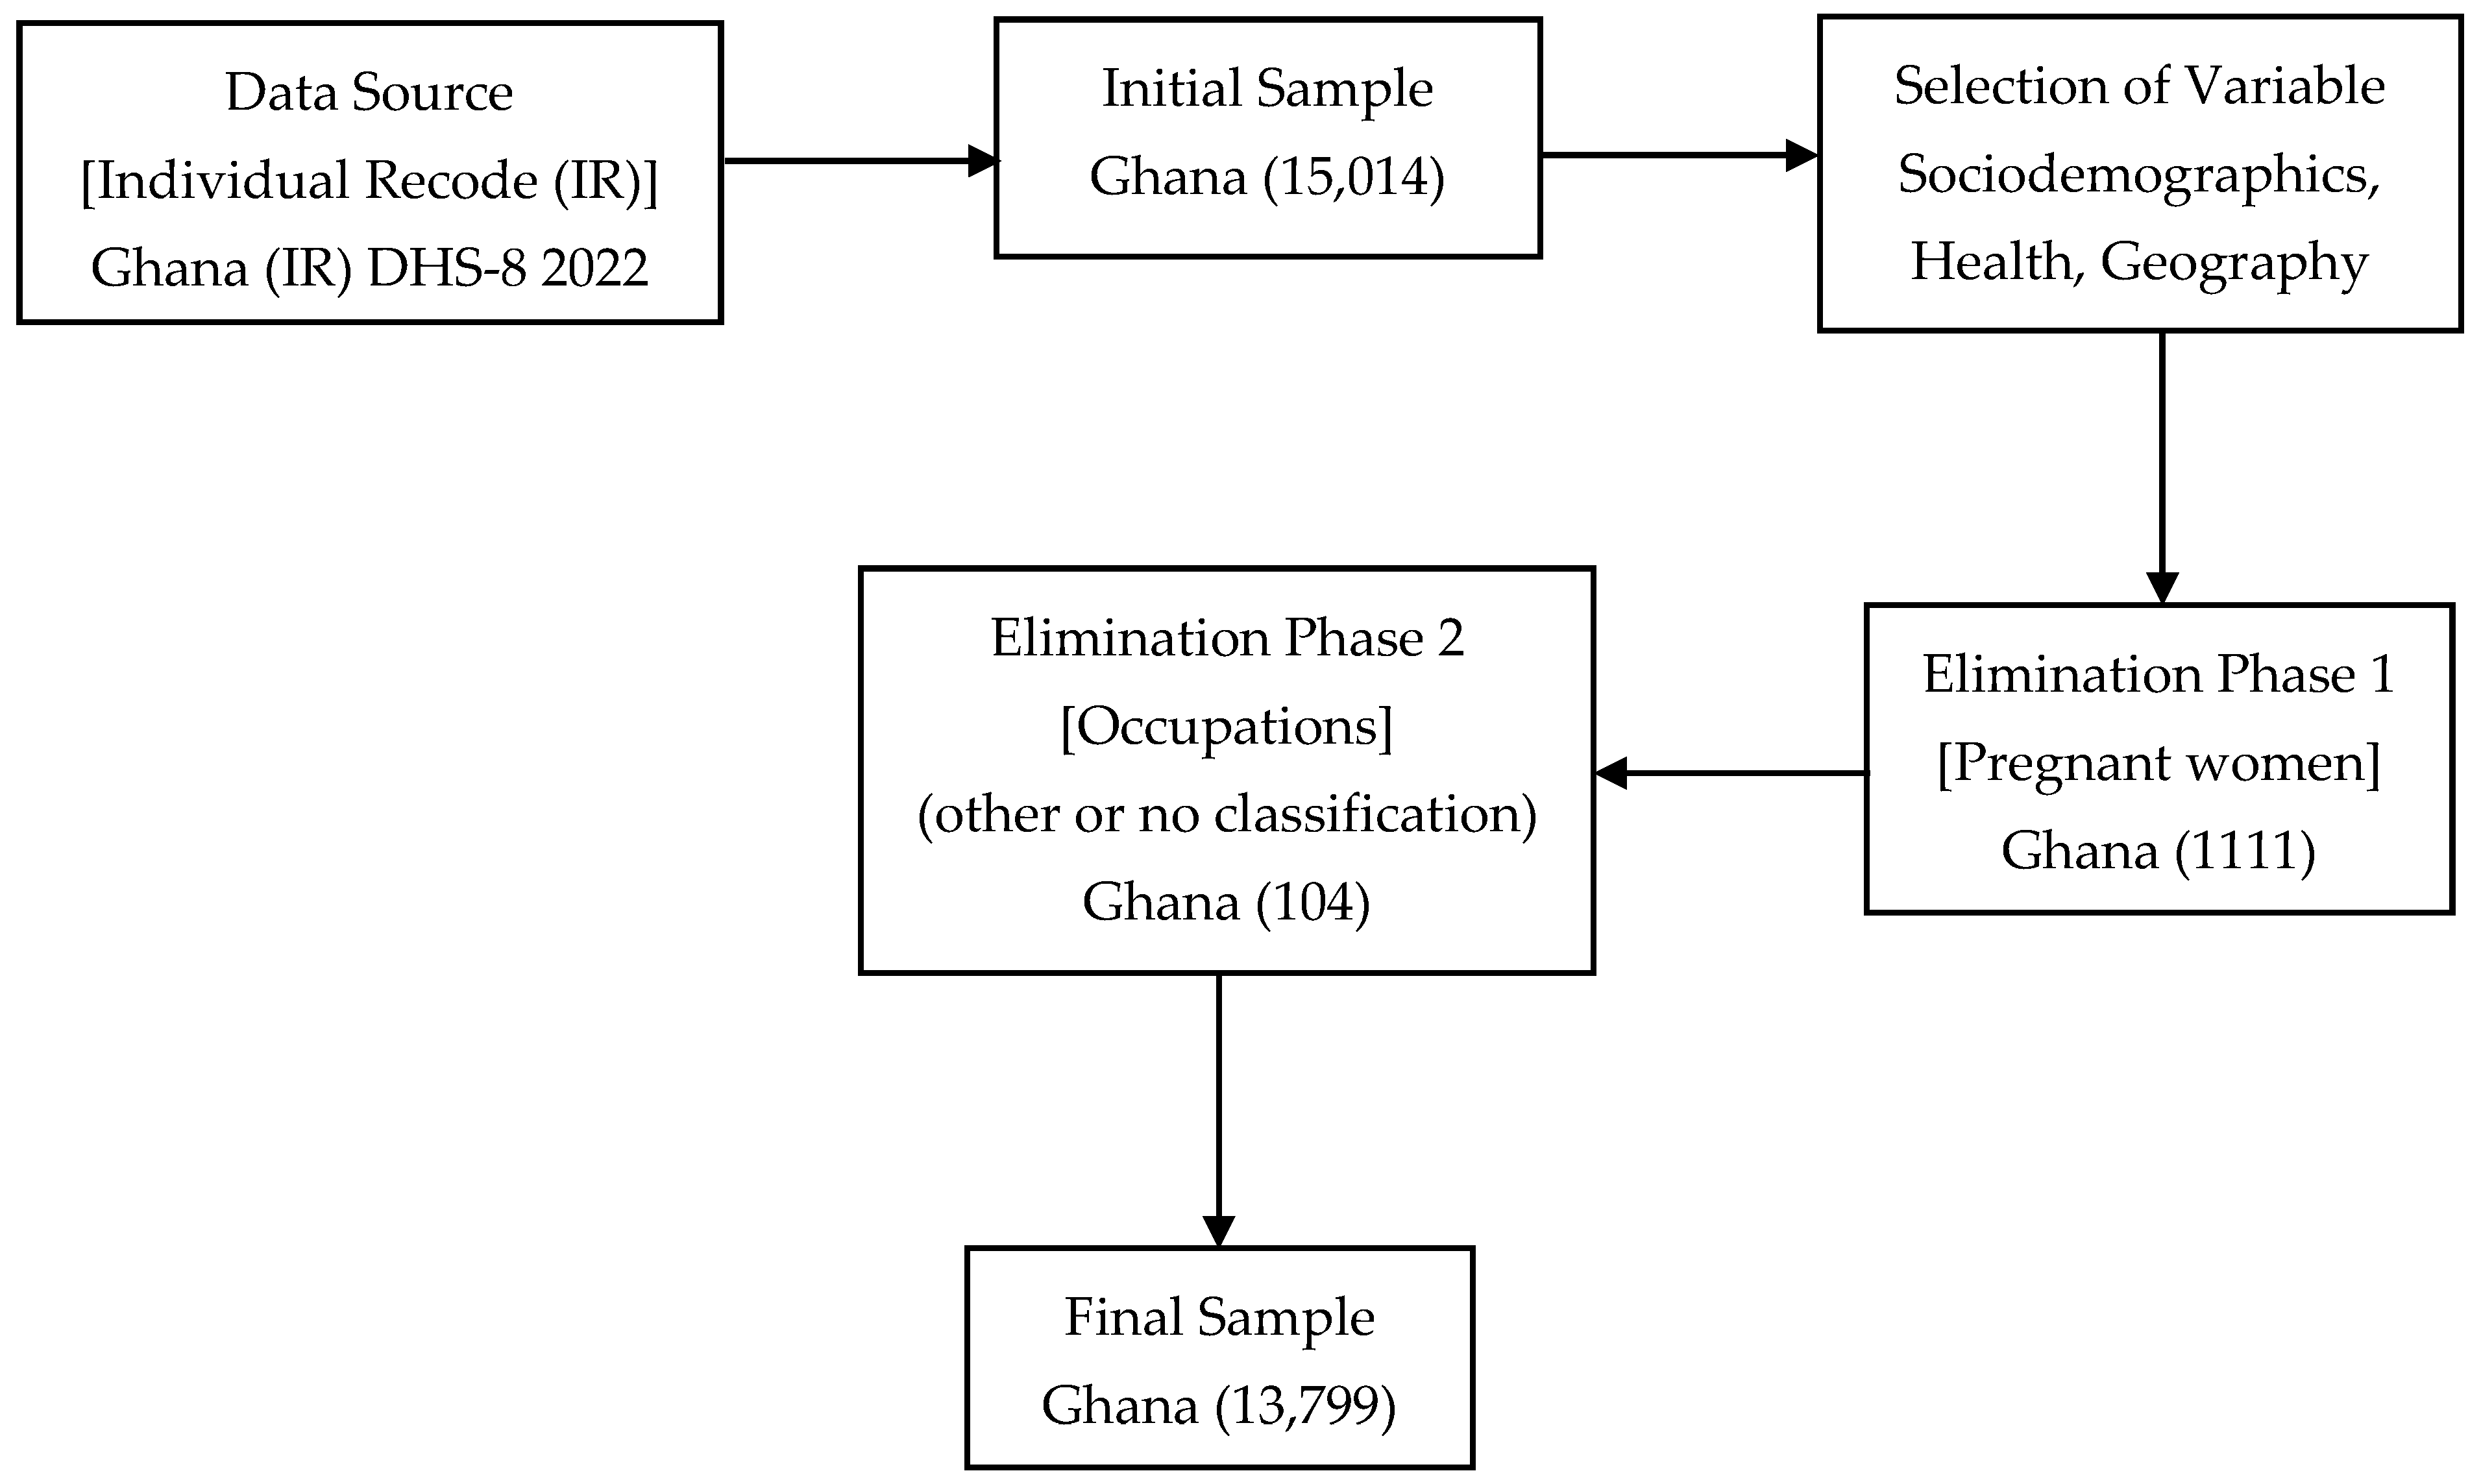
Pregnancy status and occupation became the main variables for elimination. Pregnancy status was measured as a binary variable, with a value of “1” indicating that the respondent was pregnant and “2” indicating that the respondent was not pregnant. Responses from 1111 pregnant Ghanaian females (see Figure 2) were excluded. Pregnant females usually experience rapid changes in their morphology due to their medical condition. Hence, including pregnant females in the sample may result in biased estimates [26]. The study also excluded 104 occupation categories labelled ”other or no classification” due to the inability to assign specific METS values. Thus, the final sample for Ghana became 13,799 (refer to Figure 2). All BMI values greater than 60 kg/m2 or less than 14 kg/m2 were set to N/A and imputed using iterative imputations based on random forest regressors.
Figure 2. Flowchart Summarising the Inclusion and Exclusion Criteria for the GDHS Data. Source: Author’s creation based on GDHS data from The DHS Program [18].
Obesities 05 00033 g002

2.4. Statistical Analysis

2.4.1. Descriptive Analysis

The study conducted descriptive statistics to inform the urban–rural distribution of the indicators [23]. Categorical variables (e.g., residence, regions, wealth, education) were presented as percentages (%), whereas numerical variables (age, BMI, BMI Imputed) were presented as means and standard deviations (SD).

2.4.2. Inferential Analysis

The study employed spatial analysis to examine the clustering or dispersion of metabolic equivalent task (METs) values, focusing on global and local spatial autocorrelation. Global spatial autocorrelation was used to assess overall spatial clustering. Based on this approach, a global Moran’s I was computed using ”Queen” contiguity to define neighbourhood structures, where regions sharing any boundary point are considered neighbours. The analysis was based on weighted METs values, capturing occupational physical activity levels across the 16 regions. Moran’s I values ranged from +1 (strong clustering) to −1 (dispersion), with 0 indicating spatial randomness. Statistical significance was determined using z-scores and corresponding p-values, where a significant result (p < 0.05) suggested non-random spatial patterns. The local spatial autocorrelation (LISA) was used to detect localised (regional) patterns. LISA decomposed global Moran’s I to identify specific areas with significant clustering or spatial outliers. The same Queen-based spatial weights matrix was used, with 999 Monte Carlo permutations, to test significance. Regions were categorised into High–High (HH): areas with high METs values surrounded by other regions with high METs values (positive LISA); Low–Low (LL): regions with low METs values surrounded by other areas with low METs score (positive LISA); High–Low (HL) and Low–High (LH): became outliers where a region differed from its neighbours; and Not Significant: no spatial pattern detected. All analyses were weighted and performed with Python 3.125.

3. Results

The summary of the indicators of the study is presented in Table 2. From the table (Table 2), seven (7) indicators—age, BMI, METs values, education, wealth and regions—in urban and rural areas, with a total sample of 6829 (49.5%) urban and 6970 (50.5%) rural females, are presented. Generally, there are variations in the outcomes across rural and urban areas. The average age is relatively similar in both groups: 29.66 years (urban) and 29.56 years (rural). Also, on average, urban female residents have a higher BMI (25.3 kg/m2) than their counterparts in rural areas (23.7 kg/m2). Rural residents report higher (3.35) METs values (occupational physical activity) than urban residents (2.42). The proportion of females with secondary and tertiary education is higher in urban areas, while more females with no or primary education are in rural areas. Many rural female residents are in the poorest (43.1%) wealth quintile, while urban female residents are more evenly distributed across wealth groups, particularly in the middle and rich categories. There are many rural residents in regions like the Northeast, Oti, Savannah and Upper East.
Table 3 shows the outcomes of global spatial autocorrelation statistics in the general, rural and urban populations. From the table (Table 3), a subtle but statistically significant spatial variation in the METs values is revealed. Specifically, Moran’s I statistic for the general population is weak but shows a statistically significant clustering pattern (0.003 [z = 15.880, p = 0.001]). In urban areas, Moran’s I statistics are lower (0.002 [z = 4.927, p = 0.002], but higher, though weak (0.004 [z = 14.514, p = 0.001]), in rural areas.
Figure 3 shows the outcomes of the local indicators of spatial association (LISA) analysis of METs values among females across Ghana’s 16 administrative regions. The LISA outcomes are illustrated in four panels, including local Moran’s I statistics, scatterplot quadrants, statistical significance and a Moran’s cluster map to identify clustering and dispersion patterns in energy expenditure per occupational activity. There is High–High (HH) clustering in the northern belts (e.g., Northern, Savannah), indicating high METs values among females (local Moran’s I: 0.002–0.56, p ≤ 0.05). Conversely, a Low–Low (LL) cluster in the southeast (e.g., Eastern) highlights a concentration of low MET values (p ≤ 0.05). Outliers include the High–Low (HL) regions in the Central, Greater Accra and Volta, and Low–High (LH) regions in the Western and Northeast regions. Non-statistically significant autocorrelation is observed in coastal urban areas like Bono and Oti, indicating heterogeneous activity patterns.
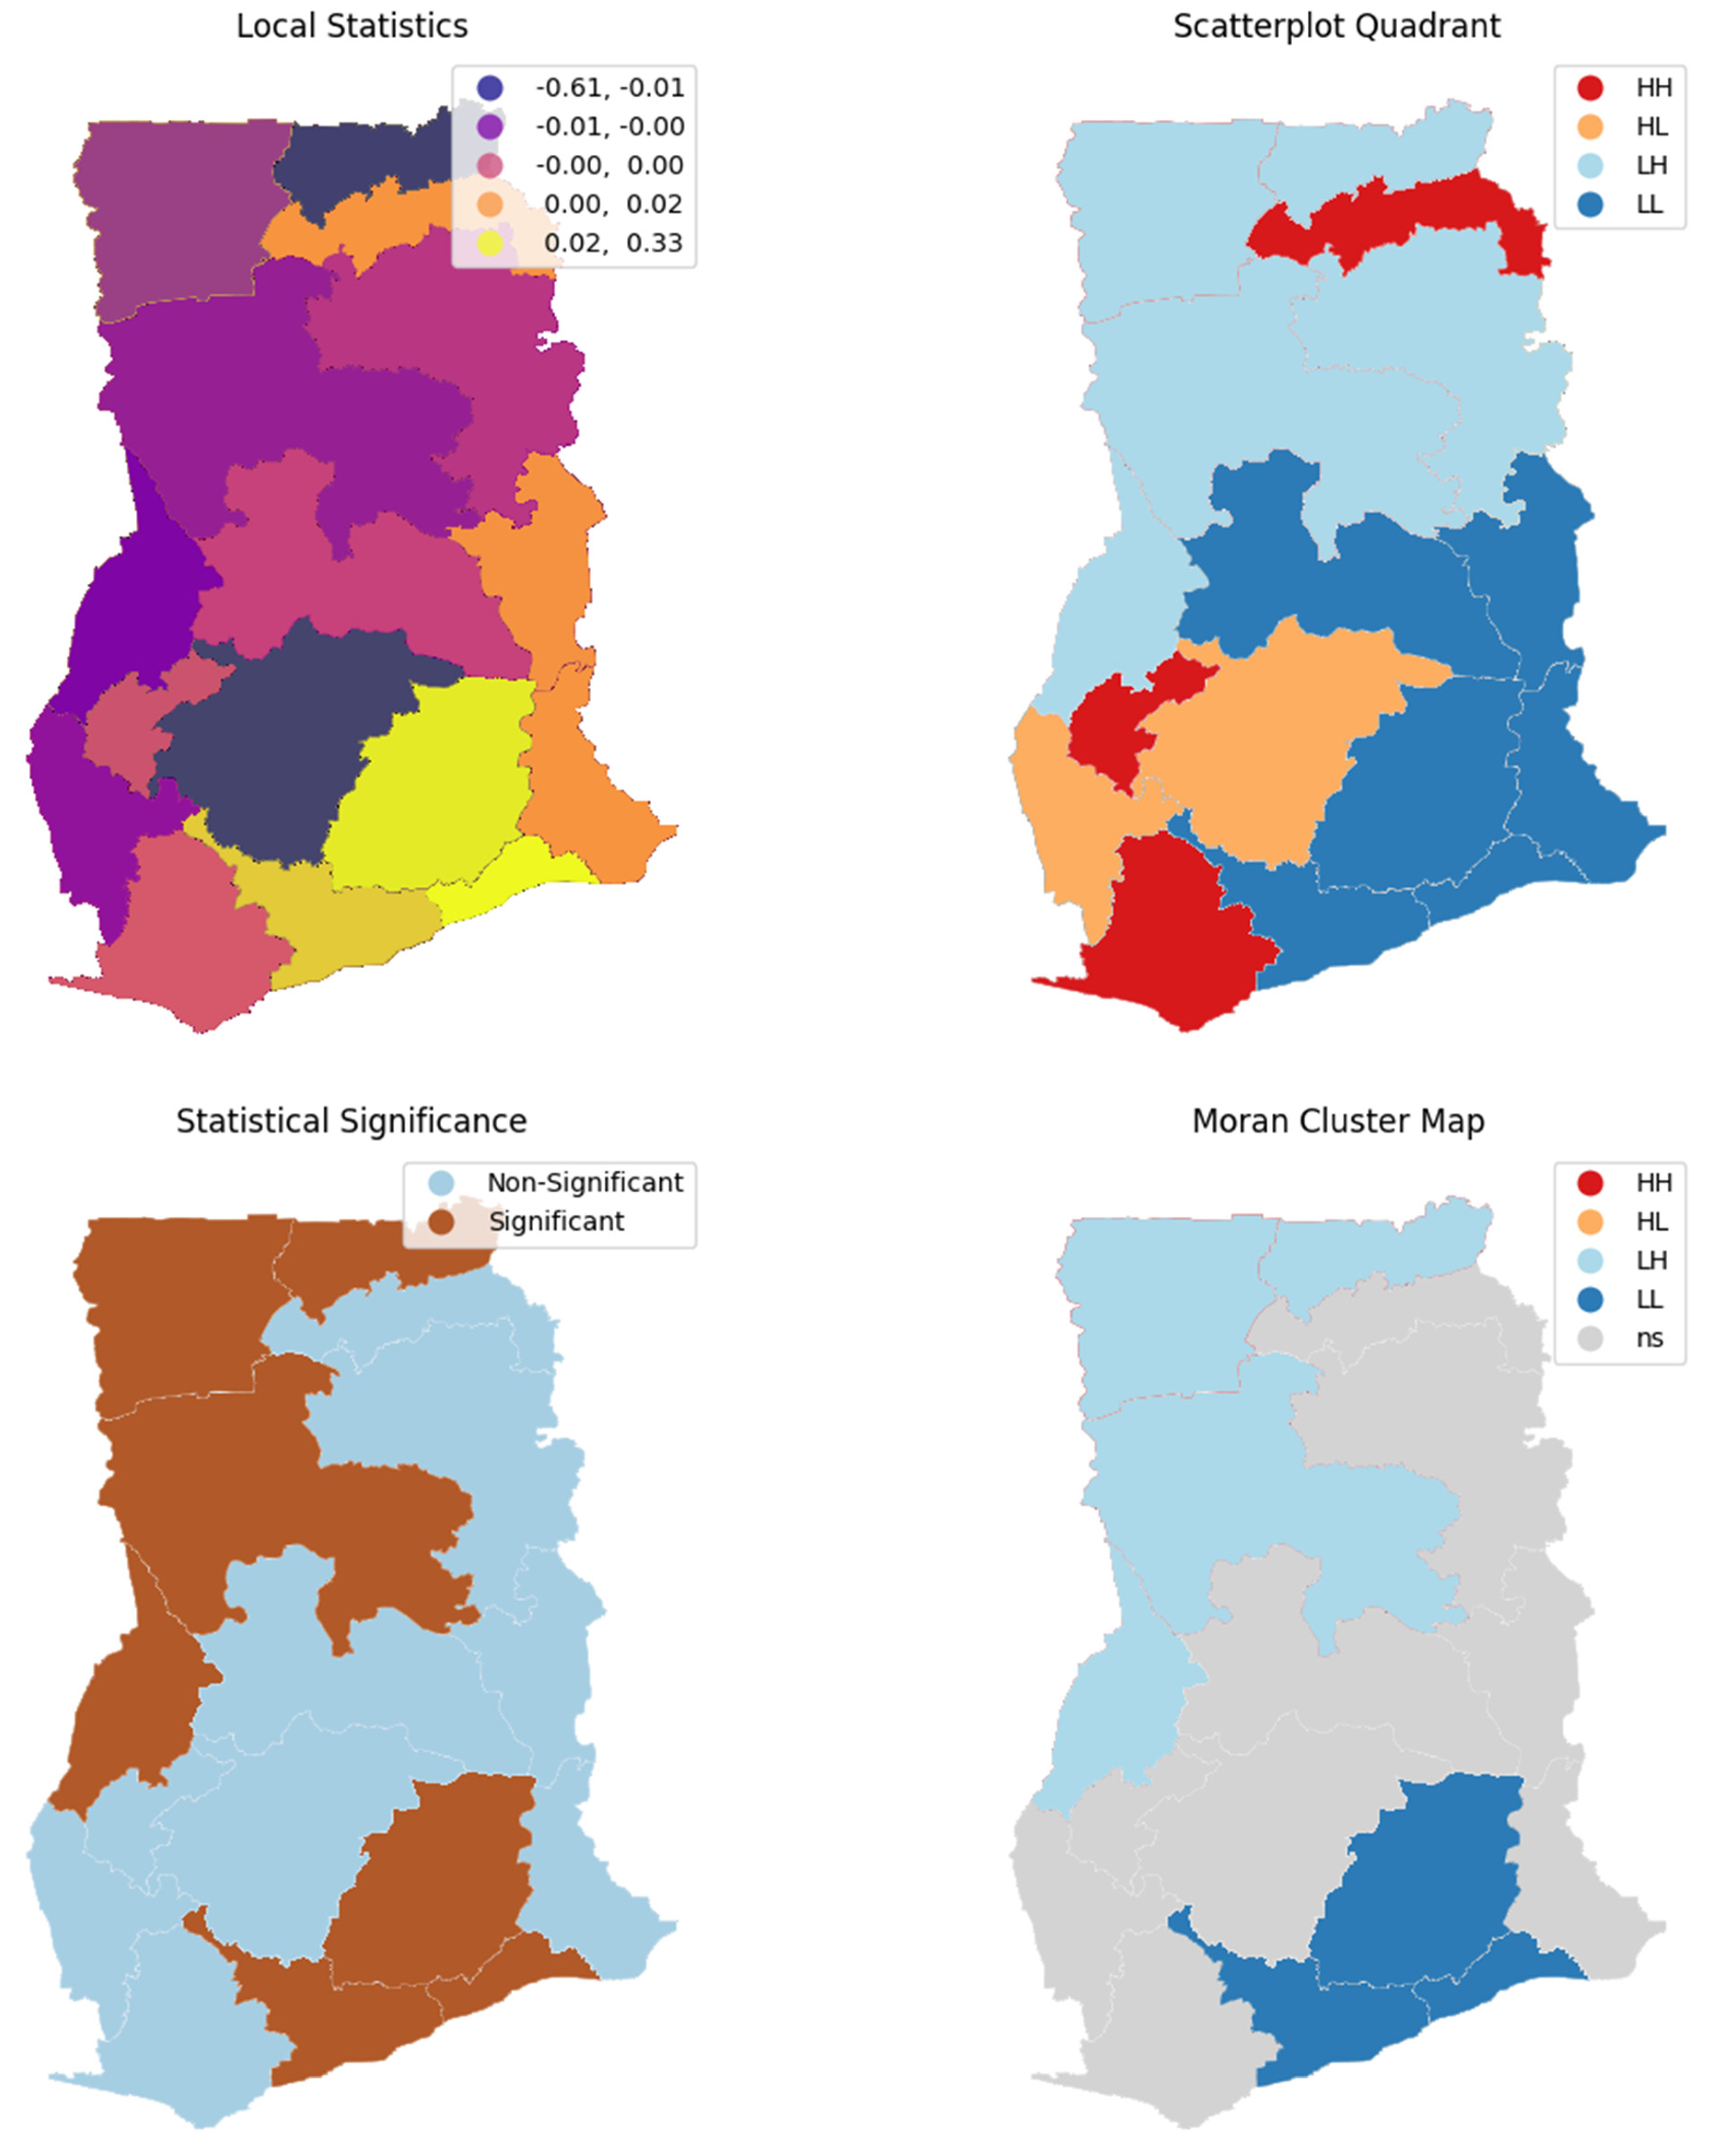
Figure 4 illustrates the outcomes of a local indicators of spatial association (LISA) analysis of METs values among urban female residents across Ghana’s 16 administrative regions. The LISA outcomes are illustrated in four panels, including local Moran’s I statistics, scatterplot quadrants, statistical significance and a Moran’s cluster map to identify clustering and dispersion patterns in energy expenditure per occupational activity. There is a significant spatial autocorrelation in METs values. Though no High−High (HH) clustering is recorded, there are records of Low–Low (LL) clusters in Greater Accra, Eastern and Central regions (local Moran’s I: 0.02–0.33, p ≤ 0.05); Low–High (LH) (Savannah, Upper West and Upper East (local Moran’s I: −0.01–−0.61, p ≤ 0.05)); and non-significant (ns) (i.e., Northern, Ashanti and Volta) clustering.
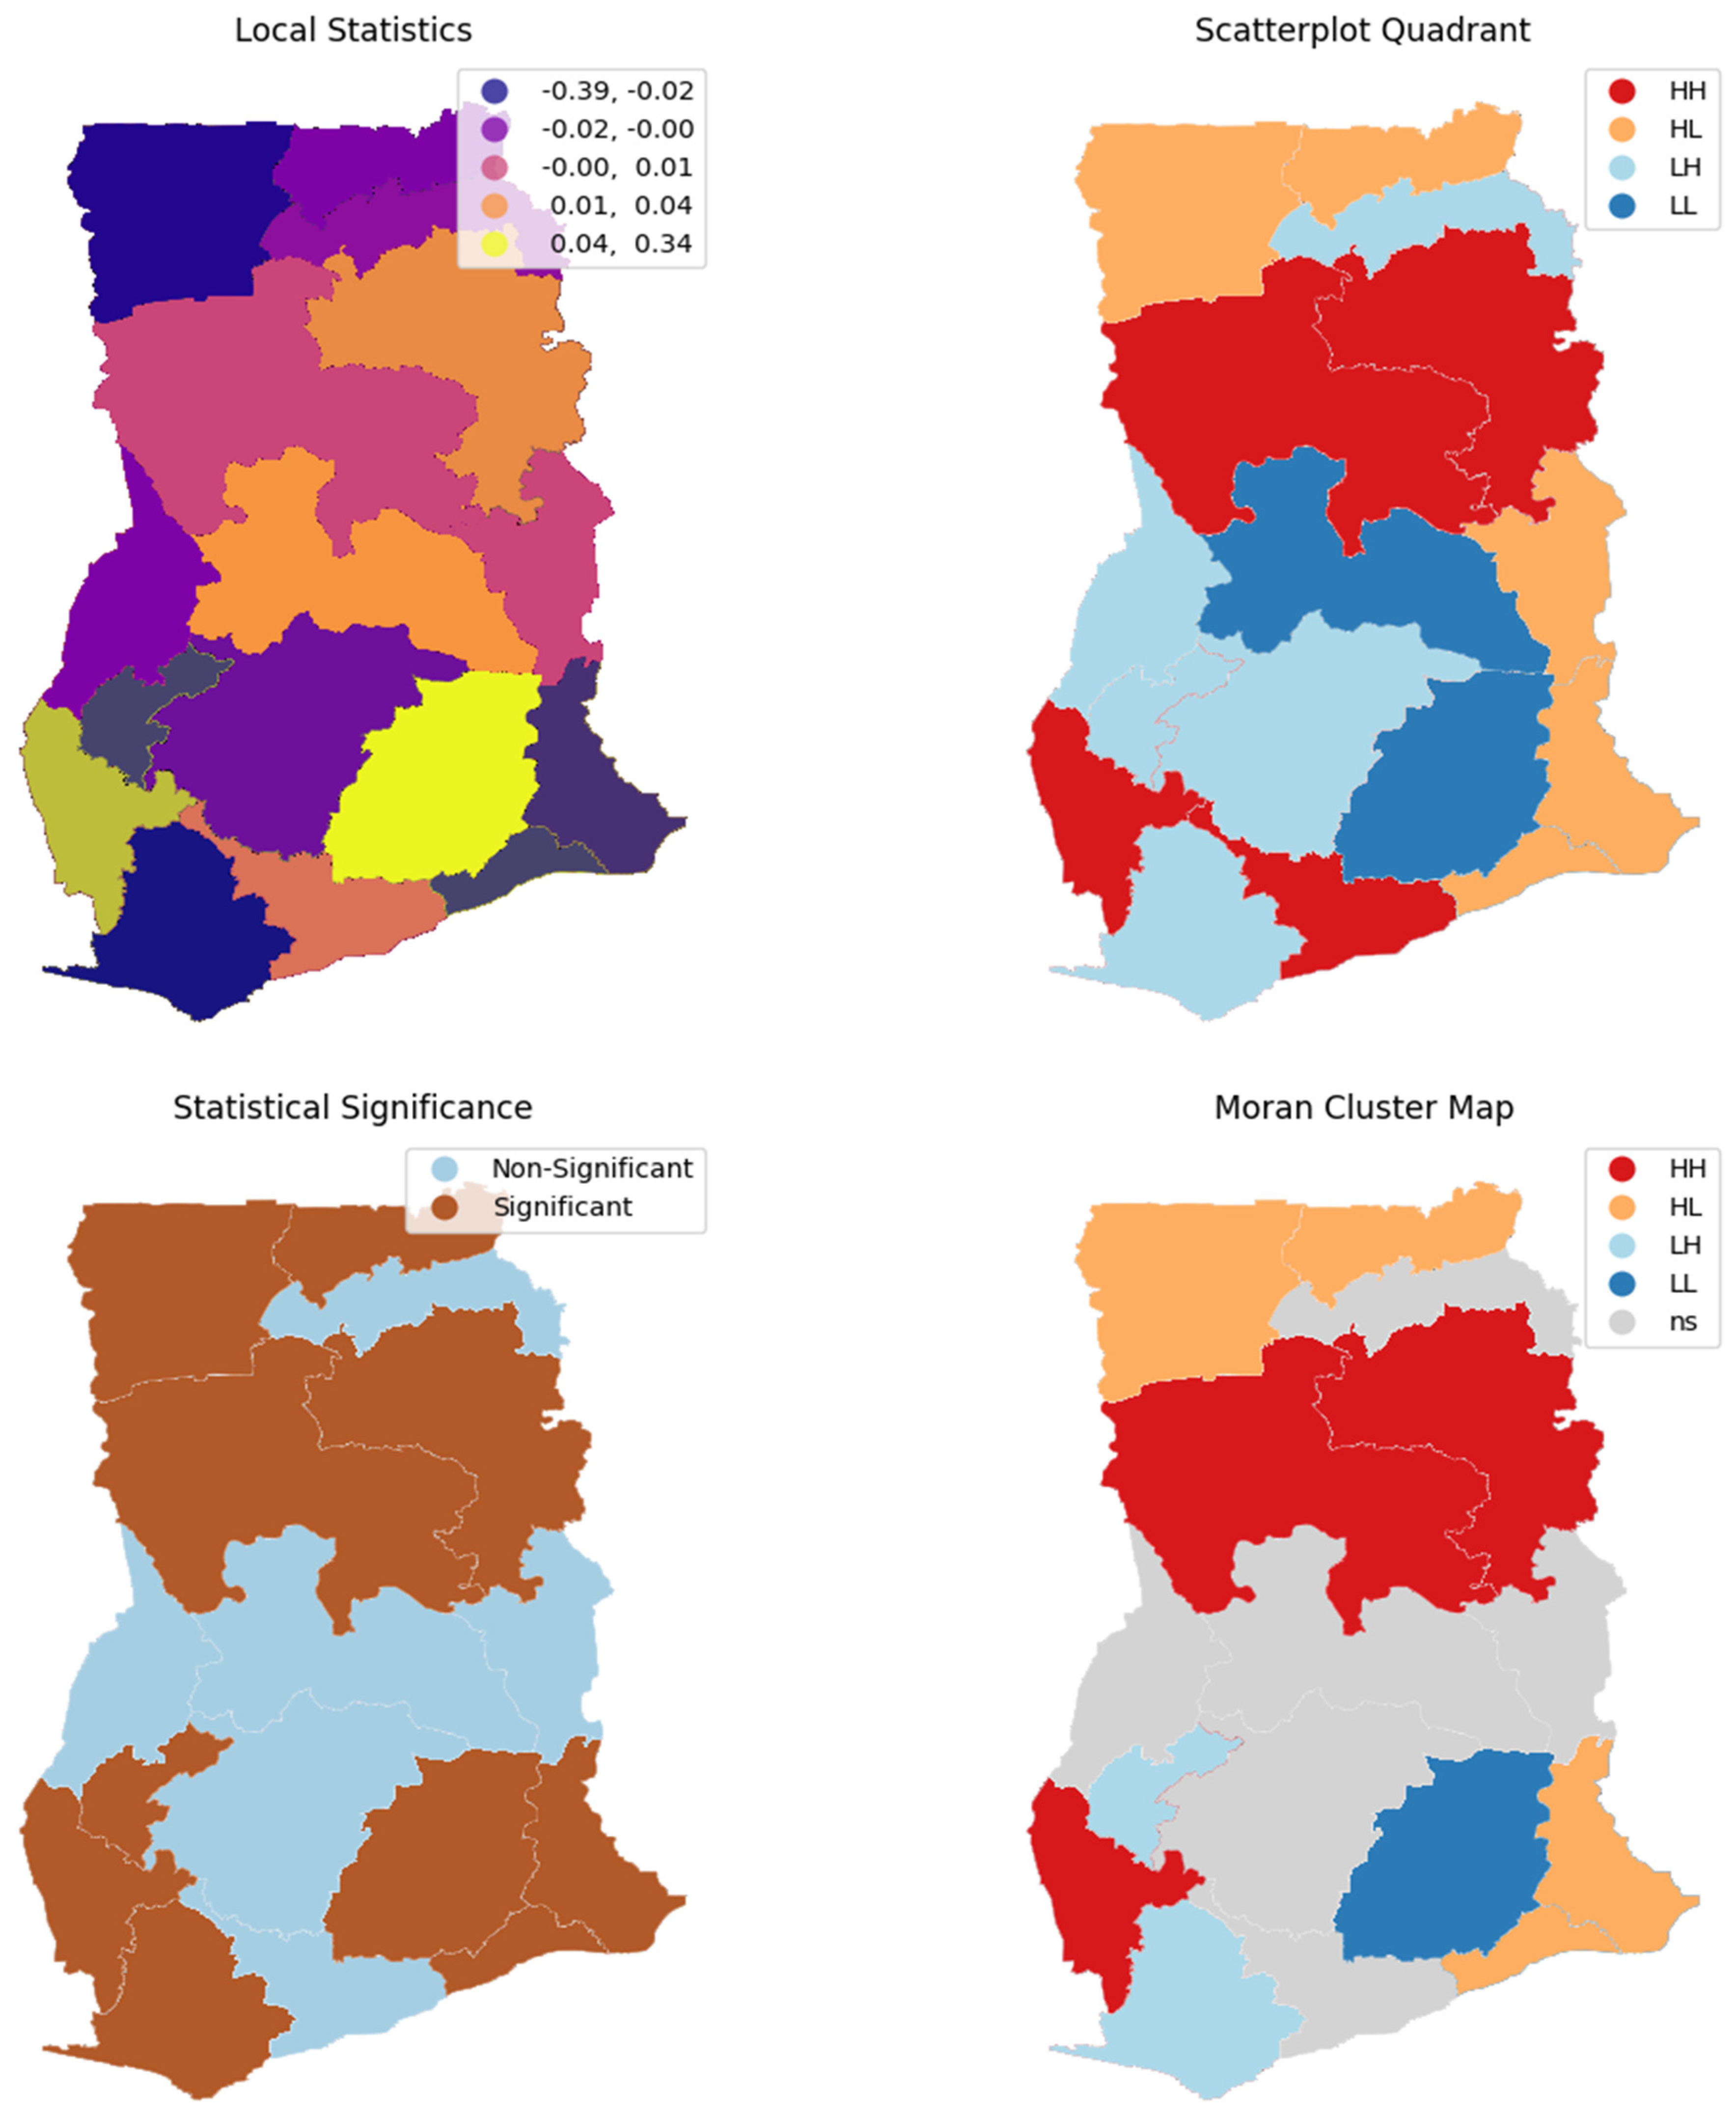
Figure 5 illustrates the outcomes of a local indicators of spatial association (LISA) analysis of METs values among rural female residents across Ghana’s 16 administrative regions. The LISA outcomes are illustrated in four panels, including local Moran’s I statistics, scatterplot quadrants, statistical significance and a Moran’s cluster map to identify clustering and dispersion patterns in energy expenditure per occupational activity. There is a significant spatial autocorrelation in METs values. A High–High (HH) clustering is recorded in Savannah, Northern and Western North (local Moran’s I: 0.04–−0.001, p ≤ 0.05) regions. Also, there are records of Low–Low (LL) clustering in the Eastern region (local Moran’s I: 0.04–0.34, p ≤ 0.05), Low–High (LH) (Western and Ahafo regions), and non-significant (ns) (Central, Ashanti and Bono East regions) clustering.

4. Discussion

The study investigated the spatial patterns of metabolic equivalents of task (METs) among females in urban and rural areas in Ghana, uncovering significant urban–rural disparities and spatial dependencies in METs levels (energy expenditure). Using a sample of 13,799 Ghanaian females (49.5% urban and 50.5% rural), it was noted that rural females exhibited higher METs compared to urban females. There was a stronger clustering of METs in rural areas than urban areas, with High–High (HH) clusters observed in the Northern regions and Low–Low (LL) clusters along the coastal regions for rural and urban areas. The key differences in demographic, socioeconomic and activity-related indicators across urban and rural settings, as well as regional variations in METs, are elucidated to inform public health policy.
The revealed differences in METs values between urban and rural female residents affirm prior research [12,27,28] findings of the dominance of labour-intensive activities, associated with high energy expenditure and therefore METs values, in rural areas in Africa, Latin America and Asia, and reports of the higher prevalence of sedentary service and professional jobs in urban areas in Ghana [13]. The higher METs values in rural compared to urban female residents may present valuable protective effects against NCDs. Therefore, the intense labour work might be, among other factors, the reason for the observed lower NCD risk in most rural populations in low- and middle-income countries with commensurate health profiles like those in Ghana [29]. In addition, these variations align with socioeconomic status levels, as many urban females were wealthier and more educated than their counterparts in the rural areas. These findings highlight the influence of socioeconomic and environmental measures on occupational physical activity and all other forms of physical activity.
Energy expenditure was spatially dependent in rural and urban areas, with a more pronounced dependency in rural settings. Multiple reasons could drive the observed outcomes. In Ghanaian rural settings, shared occupational activities are predominant, with occupations in the agriculture sector being the most common [13]. Moreover, the rural population are exposed to agricultural production knowledge and skills at an early stage. Consequently, this population grows with the knowledge and skills to produce agricultural goods and agrarian culture as the main way of life [30]. Furthermore, rural areas lack the modern infrastructure and mechanisms for agriculture. Therefore, agricultural practices are still traditional, and often labour rather than capital-intensive [7,31,32]. Also, more rural than urban females in Ghana are within the poorest wealth quintiles (43.1% in the poorest category) and have limited access to education and resources. This socioeconomic disadvantage in rural areas compared to urban areas drives the reliance on manual or labour-intensive activities for survival, resulting in higher METS values.
Regional clustering and dispersion in METs values among rural and urban females were observed. In the general population, High–High (HH) clusters in the northern belts (e.g., Northern, Savannah) reflects the intensity of occupations with higher energy expenditure, inluding agricultural activities, as the main occupational pathway in these regions [13,31], where agrarian practices remain labour-intensive due to inadequate finance to support access to contemporary infrastructure [33]. Conversely, the absence of HH in urban areas depicts low levels of physical activity, possibly due to increasing sedentary occupations, mainly because of the high prevalence of white collar jobs, which are characterised by long periods of sitting, as reported by Atorkey et al. [15]. For instance, the concentration of major financial institutions in the urban areas provides opportunities for employment in such spaces, but the workers (tellers and customer service personnel) of those institutions (say, banks) serving in the banking hall and back office spend the greater part of the day sitting due to the nature of their tasks and urban lifestyle constraints, as reported by Addo et al. [34]. Subsequently, low energy expenditure levels are recorded, further driving lower METs values for such engagements. The Low–Low (LL) cluster in the Eastern region for both rural and urban areas reflects a concentration of low energy expenditure, potentially corroborating the growing sedentary lifestyles due to the rapid urbanisation of the area and its proximity to the capital city, the Greater Accra region [35,36,37]. Outliers, such as High–Low (HL) clusters in Central, Greater Accra and Volta, and Low–High (LH) clusters in the Western and Northeast regions, point to local anomalies, possibly driven by rural–urban transitions, and unique socioeconomic, developmental or cultural factors [13,31,35,38]. The findings underscore the need to implement context-specific physical activity and health promotion interventions, particularly in urban areas where low METs values are predominant, while sustaining and providing guidance on improving beneficial activity levels in rural areas within the regions.

4.1. Implications of the Study

The observed spatial patterns have significant implications for public health in Ghana. The HH clusters in rural northern regions suggest that sustaining high physical activity levels as part of one’s occupation can protect against poor health. However, interventions should be implemented to address the potential health risks associated with overexertion, such as immune system suppression and musculoskeletal issues, by promoting ergonomic practices and providing supportive occupational infrastructure and tools. Conversely, the LL clusters in urban areas like the Greater Accra and Eastern regions highlight the need for interventions to increase physical activity as part of occupational activities among females. These may include promoting workplace physical activity programmes and addressing cultural barriers to female participation in leisure-time physical activity.

4.2. Limitations and Future Research

The study has public health merits but also several limitations. First, relying on self-reported data from the GDHS may introduce unreliable responses, which could affect METs estimates. However, categorising the occupation types reduces the potential influence of individual response errors on the estimate. Second, including only regional data and not an estimation at the community or district levels may omit the acquisition of the METs values’ dispersion or clustering at a granular level. Third, while the study introduced control variables, it did not include confounders such as cultural norms, which may influence occupation and associated METs values and spatial patterns. Despite these, the regional-level analysis masks a finer representation of the spatial clustering and dispersion of METs values in Ghana. Fourth, the METs values were derivatives of the reported occupational status rather than a direct measurement of physical activity, but renowned institutions, including the National Cancer Institute, have proven that engagement in specific types of occupations results in energy expenditure, which further corresponds with the outcomes of physical activities. Given the timing of the data collection for the study, the study may be limited by the negative impact of COVID-19 on occupations and associated physical activity levels among females, which may have influenced the METs values observed. Consequently, the findings may differ under alternative circumstances where such restrictions or disruptions are absent. Nevertheless, the reported results affirm the current research on the growing prevalence of sedentary life and urban–rural variation in energy expenditure due to occupational variations. Future research should incorporate objective measures of physical activity (e.g., accelerometers) to support the estimation of METs values and the role of cultural and environmental factors for this purpose. In addition, a longitudinal study of the impact of urbanisation and socioeconomic transitions on METs values will help to understand the spatial clustering and dispersion in Eastern and Greater Accra at the granular level.

5. Conclusions

The study offers insights into the epidemiology of physical activity, derived from occupation, among rural and urban female residents in the 16 administrative regions of Ghana, while illustrating the variance and dependencies in METs values. Of the 13,799 Ghanaian females studied, more rural than urban residents were recorded. Higher METs values were recorded among females in rural areas compared to urban areas. High–High (HH) clusters in Northern regions (e.g., Savannah) reflect labour-intensive occupations, predominantly agriculture. In contrast, Low–Low (LL) clusters in Eastern and Greater Accra indicate urbanisation-driven sedentary occupations, translating into the effects of growth, service sector jobs like banking and other desk-based jobs. Outliers in Central and Western regions highlight socioeconomic transitions. By integrating this epidemiological analysis with geographic, demographic and socioeconomic information, the study contributes to scholarship comprehending physical activity patterns in Ghana, offering a path for context-specific evidence-based policy to reduce the health risks associated with physical inactivity among females.

Funding

This research received no external funding.

Institutional Review Board Statement

Not applicable.

Informed Consent Statement

Not applicable.

Data Availability Statement

The data used for the study are available at: https://dhsprogram.com/Data/ (accessed on 21 April 2025).

Acknowledgments

The author expresses her gratitude for the insightful comments provided by Tiziana Leone and Grace Lordon.

Conflicts of Interest

The author declares no conflicts of interest.

Abbreviations

The following abbreviations are used in this manuscript:
BMIBody Mass Index
DHSDemographic and Health Survey
GDHSGhana Demographic and Health Survey
HHHigh–High
HLHigh–Low
LHLow–High
LISALocal Indicators of Spatial Association
LLLow–Low
LMICsLow- and Middle-Income Countries
METSMetabolic Equivalent

References

  1. Hölzel, C.; Weidhase, L.; Petros, S. The Effect of Age and Body Mass Index on Energy Expenditure of Critically Ill Medical Patients. Eur. J. Clin. Nutr. 2021, 75, 464–472. [Google Scholar] [CrossRef] [PubMed]
  2. Dhuli, K.; Naureen, Z.; Medori, M.C.; Fioretti, F.; Caruso, P.; Perrone, M.A.; Nodari, S.; Manganotti, P.; Xhufi, S.; Bushati, M.; et al. Physical Activity for Health. J. Prev. Med. Hyg. 2022, 63, E150–E159. [Google Scholar] [CrossRef]
  3. Lee, I.-M.; Shiroma, E.J.; Lobelo, F.; Puska, P.; Blair, S.N.; Katzmarzyk, P.T. Impact of Physical Inactivity on the World’s Major Non-Communicable Diseases. Lancet 2012, 380, 219–229. [Google Scholar] [CrossRef] [PubMed]
  4. Strain, T.; Dempsey, P.C.; Wijndaele, K.; Sharp, S.J.; Kerrison, N.; Gonzales, T.I.; Li, C.; Wheeler, E.; Langenberg, C.; Brage, S.; et al. Quantifying the Relationship Between Physical Activity Energy Expenditure and Incident Type 2 Diabetes: A Prospective Cohort Study of Device-Measured Activity in 90,096 Adults. Diabetes Care 2023, 46, 1145–1155. [Google Scholar] [CrossRef] [PubMed]
  5. Haskell, W.L.; Lee, I.-M.; Pate, R.R.; Powell, K.E.; Blair, S.N.; Franklin, B.A.; Macera, C.A.; Heath, G.W.; Thompson, P.D.; Bauman, A. Physical Activity and Public Health: Updated Recommendation for Adults from the American College of Sports Medicine and the American Heart Association. Med. Sci. Sports Exerc. 2007, 39, 1423–1434. [Google Scholar] [CrossRef]
  6. Jetté, M.; Sidney, K.; Blümchen, G. Metabolic Equivalents (METS) in Exercise Testing, Exercise Prescription, and Evaluation of Functional Capacity. Clin. Cardiol. 1990, 13, 555–565. [Google Scholar] [CrossRef]
  7. National Cancer Institute, Division of Cancer Control and Population Sciences. Metabolic Equivalent of Task Values for Activities in American Time Use Survey and 2002 Census Occupational Classification System. Available online: https://epi.grants.cancer.gov/physical/met/ocs-met.php (accessed on 22 April 2025).
  8. Silva, T.O.; Norde, M.M.; Vasques, A.C.; Zambom, M.P.; Antonio, M.A.R.d.G.M.; Rodrigues, A.M.D.B.; BRAMS Group; Geloneze, B.; Brazilian Metabolic Syndrome Study Investigators. Association of Physical Activity and Sitting with Metabolic Syndrome and Hyperglycemic Clamp Parameters in Adolescents—BRAMS Pediatric Study. Front. Endocrinol. 2023, 14, 1191935. [Google Scholar] [CrossRef]
  9. del-Cuerpo, I.; Jerez-Mayorga, D.; Chirosa-Ríos, L.J.; Morenas-Aguilar, M.D.; Mariscal-Arcas, M.; López-Moro, A.; Delgado-Floody, P. Males Have a Higher Energy Expenditure than Females during Squat Training. Nutrients 2023, 15, 3455. [Google Scholar] [CrossRef]
  10. Edwards, E.S.; Sackett, S.C. Psychosocial Variables Related to Why Women Are Less Active than Men and Related Health Implications. Clin. Med. Insights Womens Health 2016, 9, 47–56. [Google Scholar] [CrossRef]
  11. Yu, X.; Hao, L.; Crainiceanu, C.; Leroux, A. Occupational Determinants of Physical Activity at Work: Evidence from Wearable Accelerometer in 2005–2006 NHANES. SSM—Popul. Health 2021, 17, 100989. [Google Scholar] [CrossRef]
  12. Nin-Pratt, A.; McBride, L. Agricultural Intensification in Ghana: Evaluating the Optimist’s Case for a Green Revolution. Food Policy 2014, 48, 153–167. [Google Scholar] [CrossRef]
  13. Ghana Statistical Service Third Quarter Labour Force Report. Available online: https://statsghana.gov.gh/gssmain/fileUpload/pressrelease/AHIES%20QUARTER%203%202022%20LABOUR_STATISTICS_REPORT.pdf (accessed on 22 April 2025).
  14. Abane, A.M.; Mariwah, S.; Owusu, S.A.; Kasim, A.; Robson, E.; Hampshire, K. Mobile Phone Use and the Welfare of Community Health Nurses in Ghana: An Analysis of Unintended Costs. World Dev. Perspect. 2021, 23, 100317. [Google Scholar] [CrossRef] [PubMed]
  15. Atorkey, P.; Owiredua, C.; Mohammed, Z.; Gyimah, F.T. Physical Activity and Sedentary Behaviour Research in Ghana: A Systematic Review Protocol. Glob. Epidemiol. 2019, 1, 100010. [Google Scholar] [CrossRef]
  16. Radoine, H.; Bajja, S.; Dakyaga, F.; Çelik, A.; Kamana, A.; Yakubu, H.; Chenal, J. Modelling the Dynamics of Urbanization for Urban Sustainability in West Africa. J. Urban Manag. 2024, 13, 580–595. [Google Scholar] [CrossRef]
  17. The DHS Program The DHS Program—Datasets Account Home. Available online: https://dhsprogram.com/data/dataset_admin/index.cfm (accessed on 22 April 2025).
  18. USAID The DHS Program—Available Datasets. Available online: https://dhsprogram.com/data/available-datasets.cfm (accessed on 5 September 2024).
  19. Nolan, L.B.; Lucas, R.; Choi, Y.; Fabic, M.S.; Adetunji, J.A. The Contribution of Demographic and Health Survey Data to Population and Health Policymaking: Evidence from Three Developing Countries. Afr. Popul. Stud. 2017, 31, 3395–3407. [Google Scholar] [CrossRef]
  20. Short Fabic, M.; Choi, Y.; Bird, S. A Systematic Review of Demographic and Health Surveys: Data Availability and Utilization for Research. Bull. World Health Organ. 2012, 90, 604–612. [Google Scholar] [CrossRef]
  21. SimpleMaps Free GIS Maps of Ghana—Resources | Simplemaps.Com. Available online: https://simplemaps.com/gis/country/gh#admin1 (accessed on 22 April 2025).
  22. Berghoff, A.S.; Schur, S.; Füreder, L.M.; Gatterbauer, B.; Dieckmann, K.; Widhalm, G.; Hainfellner, J.; Zielinski, C.C.; Birner, P.; Bartsch, R.; et al. Descriptive Statistical Analysis of a Real Life Cohort of 2419 Patients with Brain Metastases of Solid Cancers. ESMO Open 2016, 1, e000024. [Google Scholar] [CrossRef]
  23. Vetter, T.R. Descriptive Statistics: Reporting the Answers to the 5 Basic Questions of Who, What, Why, When, Where, and a Sixth, So What? Anesth. Analg. 2017, 125, 1797–1802. [Google Scholar] [CrossRef]
  24. Tuan, S.; Su, H.; Chen, Y.; Li, M.; Tsai, Y.; Yang, C.; Lin, K. Fat Mass Index and Body Mass Index Affect Peak Metabolic Equivalent Negatively during Exercise Test among Children and Adolescents in Taiwan. Int. J. Environ. Res. Public Health 2018, 15, 263. [Google Scholar] [CrossRef]
  25. Tudor-Locke, C.; Ainsworth, B.E.; Washington, T.L.; Troiano, R. Assigning Metabolic Equivalent Values to the 2002 Census Occupational Classification System. J. Phys. Act. Health 2011, 8, 581–586. [Google Scholar] [CrossRef]
  26. Simmons, S.S. Strikes and Gutters: Biomarkers and Anthropometric Measures for Predicting Diagnosed Diabetes Mellitus in Adults in Low- and Middle-Income Countries. Heliyon 2023, 9, e19494. [Google Scholar] [CrossRef]
  27. Bjornlund, V.; Bjornlund, H.; Van Rooyen, A.F. Why Agricultural Production in Sub-Saharan Africa Remains Low Compared to the Rest of the World—A Historical Perspective. Int. J. Water Resour. Dev. 2020, 36, S20–S53. [Google Scholar] [CrossRef]
  28. Teklu, T.; Asefa, S. Who Participates in Labor-Intensive Public Works in Sub-Saharan Africa? Evidence from Rural Botswana and Kenya. World Dev. 1999, 27, 431–438. [Google Scholar] [CrossRef]
  29. Flood, D.; Geldsetzer, P.; Agoudavi, K.; Aryal, K.K.; Brant, L.C.C.; Brian, G.; Dorobantu, M.; Farzadfar, F.; Gheorghe-Fronea, O.; Gurung, M.S.; et al. Rural-Urban Differences in Diabetes Care and Control in 42 Low- and Middle-Income Countries: A Cross-Sectional Study of Nationally Representative Individual-Level Data. Diabetes Care 2022, 45, 1961–1970. [Google Scholar] [CrossRef]
  30. Oruç, E.; Çağlar, İ. The Relationship between Tendency of Rural Population to Work in Non-Agricultural Jobs and Some Socio-Economic Factors (Example of Tokat Kazova Great Plain Conservation Area). J. Rural Stud. 2022, 92, 50–55. [Google Scholar] [CrossRef]
  31. File, D.J.M.-B.; Nhamo, G. Farmers’ Choice for Indigenous Practices and Implications for Climate-Smart Agriculture in Northern Ghana. Heliyon 2023, 9, e22162. [Google Scholar] [CrossRef] [PubMed]
  32. Racine, E.F.; Laditka, S.B.; Dmochowski, J.; Alavanja, M.; Lee, D.; Hoppin, J.A. Farming Activities and Carrying and Lifting: The Agricultural Health Study. J. Phys. Act. Health 2012, 9, 39–47. [Google Scholar] [CrossRef]
  33. Ferreira, V.; Almazán-Gómez, M.Á.; Nechifor, V.; Ferrari, E. The Role of the Agricultural Sector in Ghanaian Development: A Multiregional SAM-Based Analysis. J. Econ. Struct. 2022, 11, 6. [Google Scholar] [CrossRef]
  34. Addo, P.N.O.; Nyarko, K.M.; Sackey, S.O.; Akweongo, P.; Sarfo, B. Prevalence of Obesity and Overweight and Associated Factors among Financial Institution Workers in Accra Metropolis, Ghana: A Cross Sectional Study. BMC Res. Notes 2015, 8, 599. [Google Scholar] [CrossRef]
  35. Asosega, K.A.; Adebanji, A.O.; Abdul, I.W. Spatial Analysis of the Prevalence of Obesity and Overweight among Women in Ghana. BMJ Open 2021, 11, e041659. [Google Scholar] [CrossRef]
  36. Kwasi Ofosu, D. Assessing the Spatial Distribution of Health Facilities in the Eastern Region of Ghana. Doctoral Dissertation, Kwame Nkrumah University of Science and Technology, Kumasi, Ghana, 2012. [Google Scholar]
  37. Songsore, J. The Urban Transition in Ghana: Urbanization, National Development and Poverty Reduction. Ghana Soc. Sci. J. 2020, 17, 57. [Google Scholar]
  38. Aboagye, P.Y.; Bolt, J. Long-Term Trends in Income Inequality: Winners and Losers of Economic Change in Ghana, 1891–1960. Explor. Econ. Hist. 2021, 82, 101405. [Google Scholar] [CrossRef]
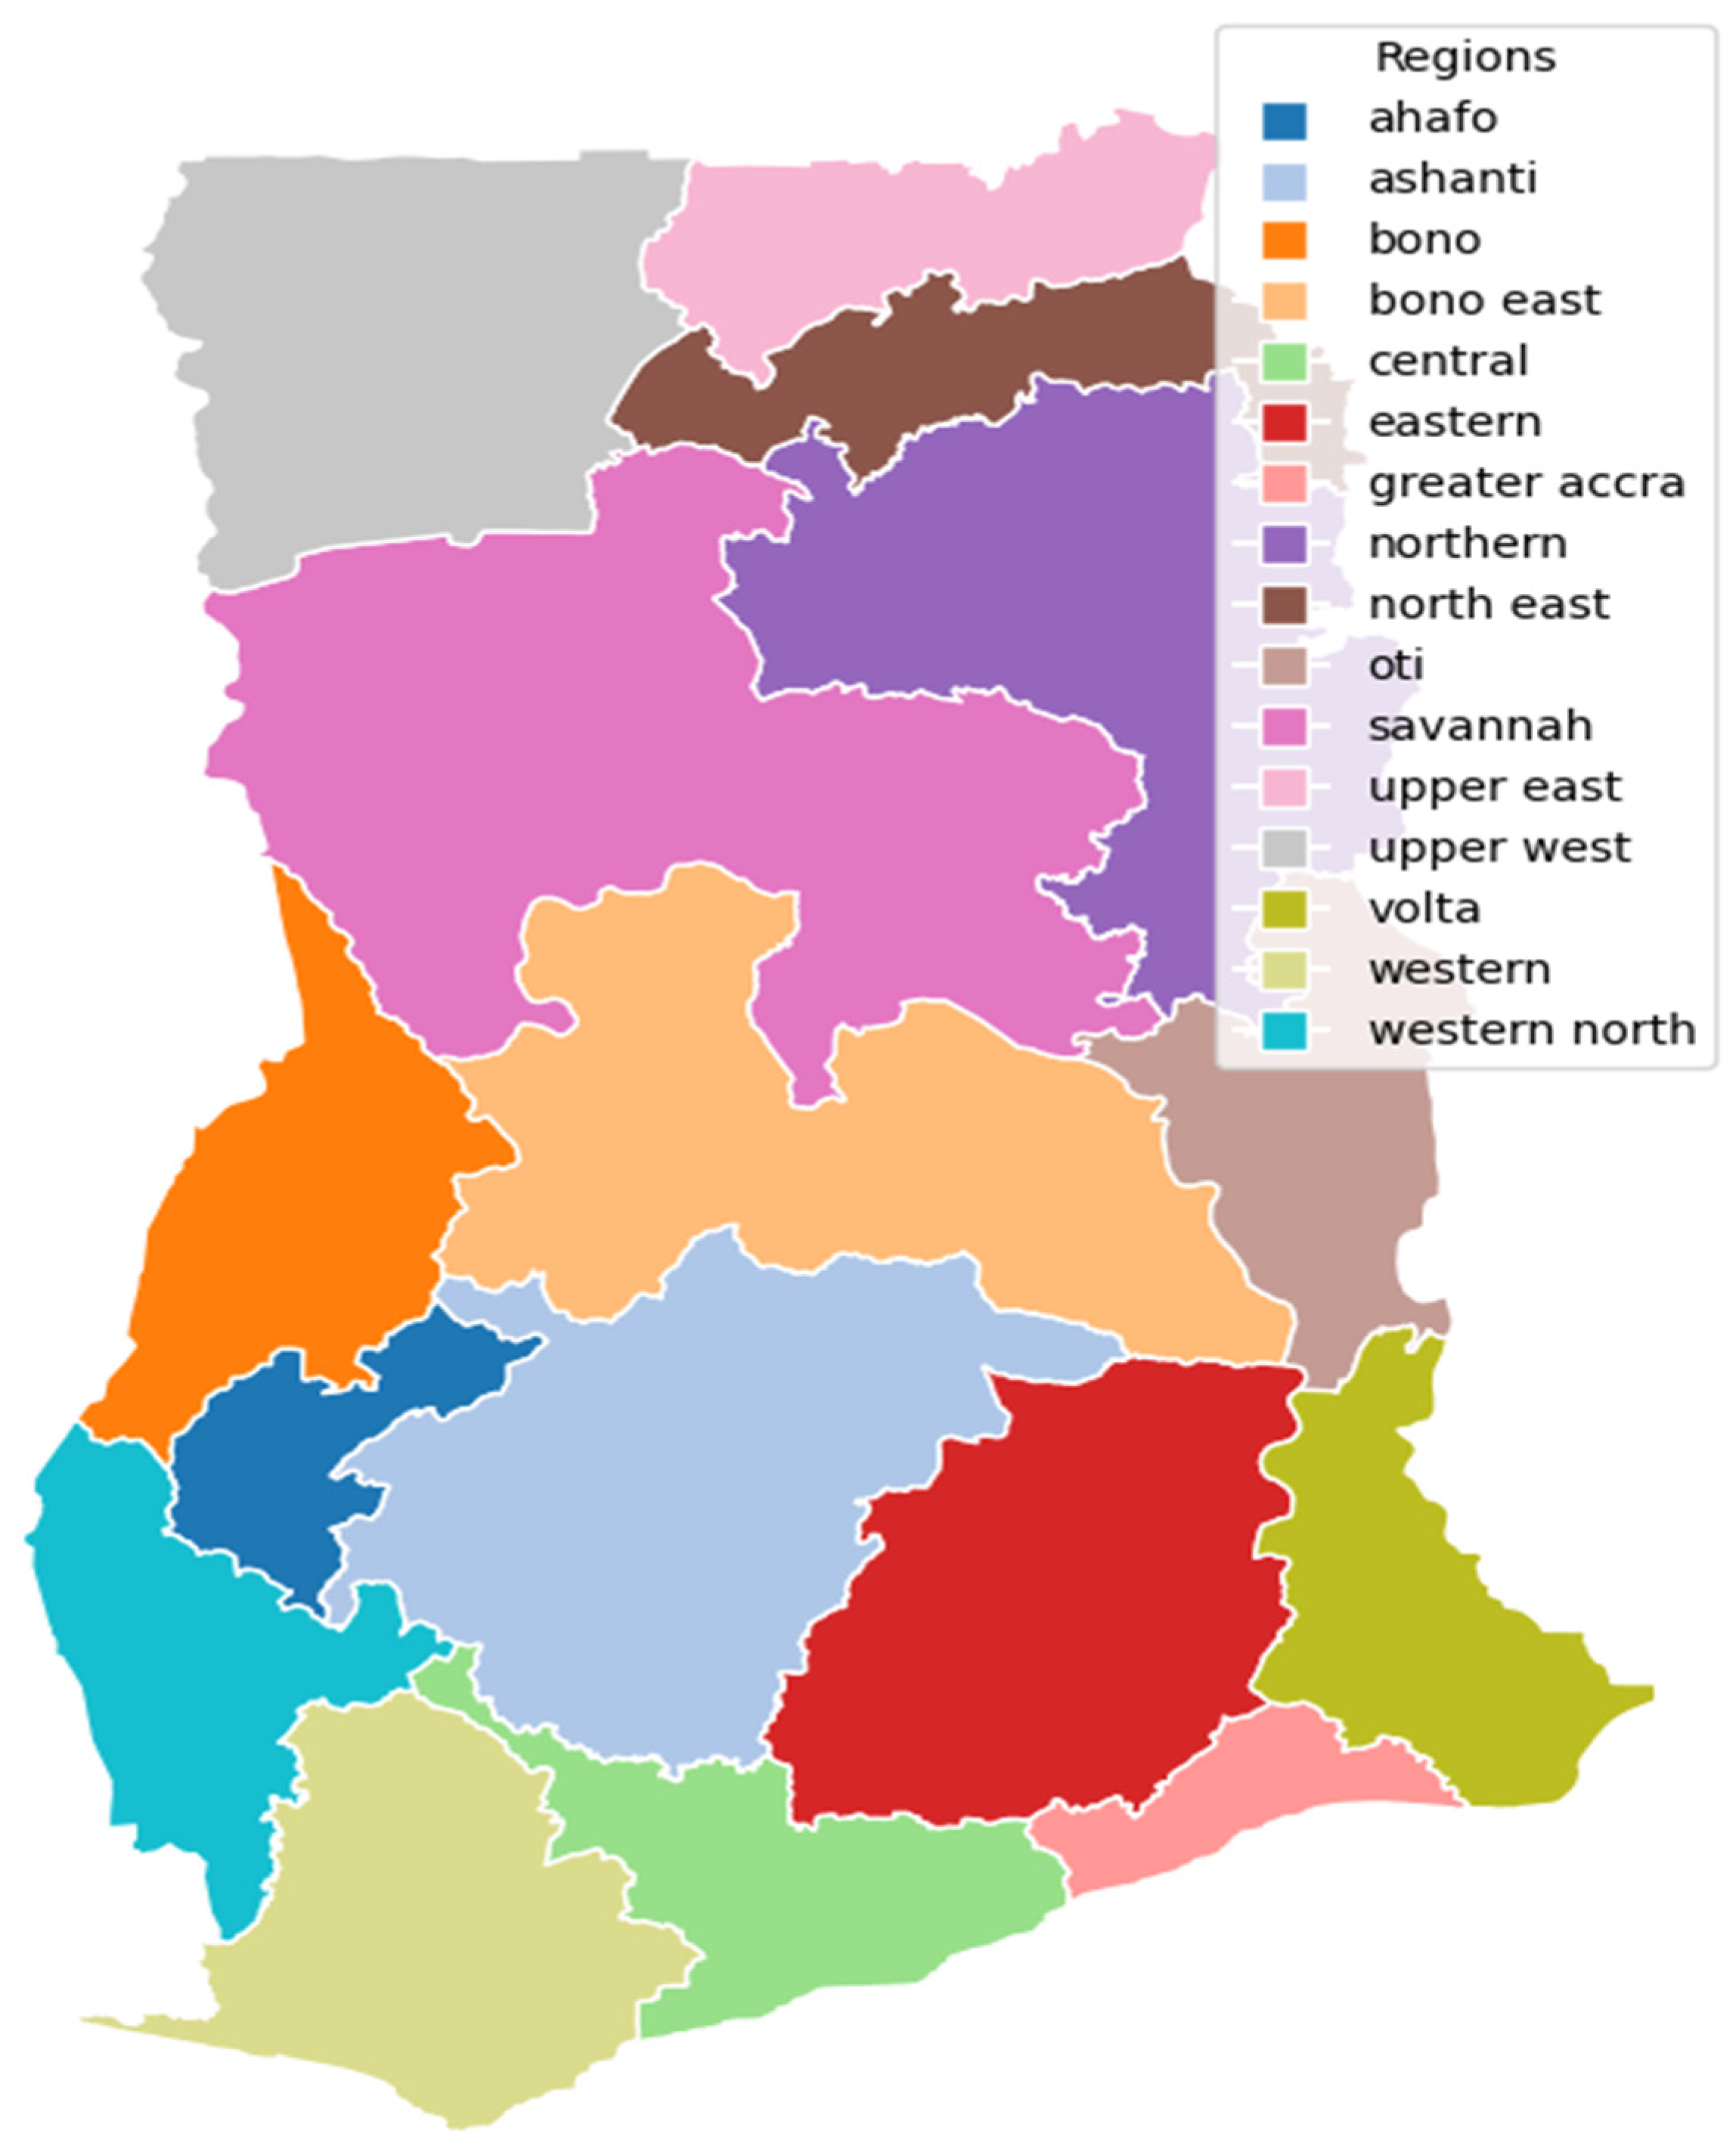
Figure 1. The Regional Map of Ghana. Source: Author’s creation based on data from the SimpleMaps [17].
Obesities 05 00033 g001
Figure 3. Local Indicators of Spatial Association (LISA) Analysis of Metabolic Equivalent in the General Population. Source: Author’s creation based on GDHS from The DHS Program [18].
Obesities 05 00033 g003
Figure 4. Local Indicators of Spatial Association (LISA) Analysis of Metabolic Equivalent in Urban Areas. Source: Author’s creation based on GDHS from The DHS Program [18].
Obesities 05 00033 g004
Figure 5. Local Indicators of Spatial Association (LISA) Analysis of Metabolic Equivalent in Rural Areas. Source: Author’s creation based on GDHS from The DHS Program [18].
Obesities 05 00033 g005
Table 1. Metabolic Equivalent of Task (METs) Values Assigned to Management Occupations.
Occupation TypeMETs
Salespersons, demonstrators and models1.5
Sales and services, elementary occupations2.5
Other craft and related workers4
Personal and protective services workers3.5
Not working and did not work in last 12 months1.5
Other associate professionals2.3
Teaching professionals2.5
Market-oriented skilled agricultural and fishery workers5
Agricultural, fishery and related labourers5.5
Precision, handicraft, printing and related trades workers3.5
Life science and health professionals2
Stationary machine operators and assemblers3
Customer services clerks2
General managers1.5
Office clerks2
Physical science and engineering associate professionals2.2
Life science and health associate professionals2
Labourers in mining, construction, manufacturing and transport6
Corporate managers1.5
Other professionals2.3
Extraction and building trades workers6
Physical, mathematical and engineering science professionals2
Drivers and mobile machine operators3
Subsistence agricultural, fishery and related workers5.5
Industrial plant operators3
Metal and machinery trades workers5
Source: Adapted from the National Cancer Institute, Division of Cancer Control and Population Sciences [7] and applied to the GDHS data from The DHS Program [18].
Table 2. Summary Statistics of the Study’s Indicators.
  Urban  Rural
  Total (%)  Total (%)
6829 (49.489)6970 (50.511)
Indicators
   x - ± SD   x - ± SD
Age29.657 ± 9.72629.560 ± 9.922
BMI25.304 ± 4.85423.467 ± 3.891
BMI (imputed)25.313 ± 4.85423.476 ± 3.888
METs values 2.415 ± 1.208 3.351 ± 1.627
  Total (%)  Total (%)
Education
No education  919 (13.457)2150 (30.846)
Primary  813 (11.905)1233 (17.690)
Secondary 4164 (60.975)3328 (47.747)
Tertiary/Higher  933 (13.662) 259 (3.716)
Wealth
Poorest  323 (4.730)3001 (43.056)
Poorer  993 (14.541)2105 (30.201)
Middle 1810 (26.505) 975 (13.989)
Richer 1905 (27.896) 568 (8.149)
Richest 1798 (26.329) 321 (4.605)
Regions
Ahafo  387 (5.667) 400 (5.739)
Ashanti  610 (8.932) 445 (6.385)
Bono  442 (6.472) 317 (4.548)
East  484 (7.087) 425 (6.098)
Central  494 (7.234) 416 (5.968)
Eastern  436 (6.385) 350 (5.022)
Greater Accra  740 (10.836) 164 (2.353)
Northeast  351 (5.140) 513 (7.360)
Northern  525 (7.688) 519 (7.446)
Oti  333 (4.876) 511 (7.331)
Savannah  343 (5.023) 556 (7.977)
Upper East  312 (4.569) 585 (8.393)
Upper West  312 (4.569) 576 (8.264)
Volta  376 (5.506) 401 (5.753)
Western  398 (5.828) 340 (4.878)
Western North  286 (4.188) 452 (6.485)
Source: Author’s computation based on GDHS from The DHS Program [18].
Table 3. Global Spatial Correlation Statistics Estimated by the Moran’s I Statistic.
Global Statistics
General PopulationUrban PopulationRural Population
Moran’s I0.0030.0020.004
z-value15.8804.92714.514
p-value0.0010.0020.001
Source: Author’s computation based on GDHS from The DHS Program [18].
Disclaimer/Publisher’s Note: The statements, opinions and data contained in all publications are solely those of the individual author(s) and contributor(s) and not of MDPI and/or the editor(s). MDPI and/or the editor(s) disclaim responsibility for any injury to people or property resulting from any ideas, methods, instructions or products referred to in the content.