Abstract
This paper investigates three distinct hydrogen-related subsystems: production, storage, and the use. An analysis of the micro-combined heat and power production (mCHP) behavior using natural gas is conducted to understand how the system operates under different conditions and to evaluate its yearly performance. To reduce CO2 emissions, hydrogen fuel consumption is proposed, and an emission analysis under different fuel-supply configurations is performed. The results show that hydrogen produced by artificial photosynthesis has the lowest CO2 impact. Therefore, the paper examines this process and its main characteristics. An engineering model is proposed to rapidly estimate the mean volumetric hydrogen production rate. To ensure safe coupling between hydrogen production and mCHP demand, the study then focuses on solid-state hydrogen storage. Subsequently, in this framework, the state of charge (SOC) is defined as the central control variable linking storage thermodynamics to hydrogen delivery. Accurate SOC estimation ensures that the storage unit can supply the required hydrogen flow without causing starvation, pressure drops, or thermal drift during CHP operation. The proposed SOC estimation method is based on an analytical approach and experimentally validated while relying solely on external measurements. The overall objective is to enable a coherent, low-carbon, and safely controllable hydrogen-based mCHP system.
1. Introduction
In recent decades, energy consumption has continuously increased. Numerous international and national organizations have set ambitious goals to build a more sustainable economy based on renewable energy and hydrogen storage. Hydrogen has emerged as a key green energy carrier toward sustainable and low-carbon solutions, while enabling greater integration of renewable energy sources into the global energy system [1].
There are different processes for hydrogen production described in the literature review. Coal gasification is one of the mature carbonized technologies where the coal, ranging from anthracite to lignite, is converted into synthetic gas. A mixture mainly composed of carbon monoxide and hydrogen, but other gases may also be present in trace amounts. The gasification process involves high temperatures (around 1000 °C) in the presence of oxygen and/or steam. Large-scale hydrogen production is possible, but this method emits significant greenhouse gases. This process is often referred to as “black hydrogen” for anthracite and “brown hydrogen” for lignite [2]. Steam Methane Reforming (SMR) represents over 90% of H2 global production, where reacts with water vapor to produce carbon dioxide and hydrogen. The reaction also occurs around 800–1000 °C and produces around 10 tons of per ton of hydrogen [3]. This process is often referred to as “gray hydrogen” and “blue hydrogen” with the incorporation of carbon capture and storage to reduce emissions [4]. Hydrogen production from water electrolysis uses electricity coming from renewable energy sources (green hydrogen), nuclear power plants (yellow hydrogen), or a mixed grid (pink hydrogen) [5]. It is the most mature technology for decarbonizing hydrogen production. Hydrogen production requires efficient storage that remains a major challenge. High-pressure storage is subject to safety risks and leakage issues, while liquefied hydrogen requires extremely low temperatures, making it complex. Hydrogen solid storage using metal hydride (MH) offers safer, low-pressure alternatives with low temperature thermal management, but suffers from high weight and low flow rates. It is becoming essential for both vehicles and residential applications. Xu et al. [6] highlight that MH tanks provide higher volumetric density and safer operation compared to compressed or liquid hydrogen, making them ideal for vehicles where space and safety are critical. Similarly, Wang et al. [7] emphasize their potential for residential backup and grid support, where MH systems ensure reliable, space-efficient, and long-duration energy storage, particularly valuable in renewable-based microgrids. Recent investigations [8] demonstrated that thermal conditions strongly influence MH absorption/desorption kinetics, and used these insights to develop a physics-informed neural network model capable of accurately predicting SOC under dynamic operating conditions. Another study [9] integrated MH systems with PEM fuel cells, showing that optimized coupling between storage and conversion units enhances system efficiency in stationaries and transport applications.
A key limitation of MH is estimating the SOC [10], especially when the initial state is unknown. Unlike liquefied hydrogen, where weight provides a clear measure, for high-pressure hydrogen storage, MH has significant weight, limiting hydrogen measurement accuracy. Additionally, internal pressure measurement does not reflect hydrogen pressure distribution due to temperature-dependent equilibrium shifts, limiting hydrogen applications. There are relatively few studies of hydrogen SOC in the literature. Existing SOC estimation techniques show significant limitations in practical adaptability, particularly when dealing with variations in tank geometry, such as radius-to-height ratios, porosity distribution, or non-uniform thermal fields. These constraints often lead to inaccurate predictions and complex calibration procedures, restricting their use in real applications where geometrical and thermal heterogeneities are inevitable. To address these challenges, this work introduces an analytical study on the hydrogen SOC prediction using residential micro-CHP (micro combined heat and power) as a stationary hydrogen application because the simultaneous energy production using a fuel cell combined with a boiler can significantly improve efficiency in buildings (up to 85%) [11]. Ramadhani et al. [12] demonstrate that the proton exchange membrane fuel cells (PEMFC) and solid oxide fuel cells (SOFCs) have a promising future in the micro-CHP more than the conventional internal combustion engines. Recent studies have focused on low-temperature PEMFC-based mCHP systems. Briguglio et al. [13] evaluated the thermal and electrical performance of a pre-commercial fuel cell system for stationary applications under various load conditions. Gabana et al. [14] evaluated the performance of a fuel cell mCHP under different hydrogen sources and heat recovery configurations. They show that the use of hydrogen produced from natural gas saves more primary energy than H2 produced from electricity. Song et al. [15] provide a comprehensive review of thermal management system architectures for liquid-cooled PEMFCs during both the on-load stage and the start-up stage. Meng et al. [16] propose a prognostics and health management approach to predict performance degradation trends and enable early interventions to extend system life. They introduce a novel health indicator based on the decomposition of polarization losses, which can be used to optimize system design and operational strategies, ensuring long-term economic efficiency and reliability.
The energy-independent mCHP requires analysis of the dynamic H2 consumption based on the domestic demand, space heating demand, and electricity needs. The dynamic hydrogen profile needed by residential load is strongly linked to the SOC-controlled MH solid storage and the variable hydrogen inflow from artificial photosynthesis. Sizing the future fully integrated system (mCHP with H2 production and storage) requires coordinated management of production variability, storage thermodynamics, and end-use consumption, forming a coherent low-pressure hydrogen pathway. This ensures that the mCHP receives the required amount of hydrogen with an optimal number of the MH storage tanks. For this reason, the present paper presents experimental and analytical studies on mCHP behavior, hydrogen solid storage, and production. This article treats the following:
- Artificial photosynthesis for hydrogen production with low carbon emissions;
- Analytical approach for estimation of MH SOC based only on external measurements;
- The mCHP behavior under different operating conditions.
2. Hydrogen Solid Storage and Artificial Photosynthesis Production
Under a complete FC mCHP system, real-time MH SOC estimation stabilizes the entire chain by absorbing production variability from artificial photosynthesis. It contributes to indicating how much hydrogen MH can still store without exceeding the pressure limit. It protects the FC by guaranteeing a predictable, starvation-free supply that avoids voltage drop, membrane dehydration, and thermal drift. SOC estimation minimizes cycling stress on the FC, prevents inefficient throttling of the photosynthetic reactor, and enables coordinated control of H2 production, storage, and use.
In this work, the focus will be on the artificial photosynthesis method for H2 production (gold hydrogen) because this technology is characterized by a maximum theoretical thermodynamic efficiency (about 40%) higher than that of other technologies [17]. Artificial photosynthesis aims to imitate natural photosynthesis by converting sunlight into chemical compounds. One of the main reactions is water photolysis, which produces hydrogen, and oxygen, . Photocatalytic systems (semiconductors or molecular components) absorb light, generate charge carriers, and catalyze redox reactions. Semiconductors such as , and are commonly used to reduce protons to and oxidize to . Photoreactors are reactors with transparent walls that allow light to pass through. Water photolysis reaction occurs within the medium inside the reactor. The process is controlled and limited by radiative transfer. Foin [18] proposes an engineering model for hydrogen production from water photolysis in a photoreactor. An analytical formula for the mean volumetric hydrogen production rate, , for a 1D cartesian semi-infinite slab radiative transfer model, with a collimated normal radiation passing through a gray, purely absorbing medium.
Considering 99% of the maximum absorption, and that recombination phenomena are far more important than reduction phenomena, the maximum mean volumetric hydrogen production rate is approximated by
Considering the number of particles in , the absorption coefficient in a gray medium in and the specific surface area in , the model can be simplified as
The stoichiometric coefficient () for the photolysis reaction and the maximum photoconversion efficiency () are and , respectively. is a specific value associated with the experimental measurements. The most important parameter is the illuminated specific surface area () that is representative of the photoreactor geometry [19]. The subscripts are for particle, for medium, for dihydrogen, for photons, and for charge carriers referring to electron or hole.
The proposed equation can be applied to a photocatalytic system that is able to perform water photolysis, where the photoreactor geometry is characterized by the illuminated specific surface areas. This allows the model to be generic regarding the photoreactor geometry. In order to implement this model, a specific practical case corresponding to cadmium sulfide CdS particles in an aqueous suspension.
Figure 1 shows the maximum mean volumetric hydrogen production rate plotted as a function of the incident photon flux density . The incident photon flux density is generally considered the standard value for full sunlight. The results are obtained for a particle radius of , a specific absorption cross-section in a gray medium () of , a particle density of , and a of .
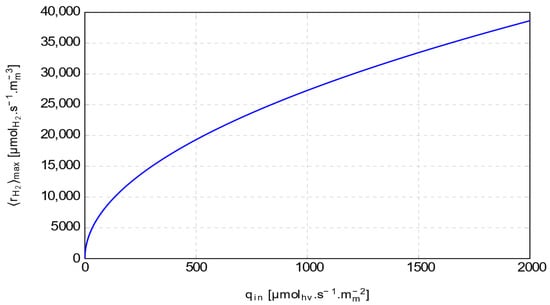
Figure 1.
Modeling of the maximum mean volumetric hydrogen production rate.
The carbon footprint of artificial photosynthesis strongly depends on the catalyst type. Therefore, the life cycle assessment (LCA) of artificial photosynthesis can be considered to be primarily associated with the LCA of the photocatalyst. According to the IPCC [20], the production of titanium dioxide used for water photocatalysis results in emissions ranging between 0.7 and 1.3 kgCO2 per kgH2 produced. No data are available for cadmium sulfide production. Patel et al. [21] report that hydrogen production via water electrolysis powered by solar electricity emits approximately 2.5 kgCO2 per kg of H2.
Although artificial photosynthesis technology has low CO2 emissions, it is impacted by the development of efficient catalysts and the optimization of light absorption. Its efficiency is low compared to the electrolysis process. It requires larger solar surfaces than photovoltaics combined to electrolyzer. However, this example highlights recent advances in the modeling of photoreactive processes for hydrogen production that need to be stored. This is the reason that the analysis was focused on H2 solid storage SOC. The used approach integrates the effects of internal pressure distribution, flow-dependent losses, and thermal gradients while relying solely on non-intrusive external parameters, namely, inlet hydrogen pressure, surface heat flux or temperature, and inlet mass flow rate.
Hydrogen production rate obtained from artificial photosynthesis is inherently intermittent and constrained by radiative conditions, requiring a storage system capable of absorbing fluctuating inflows without exceeding thermal or pressure limits. This motivates the shift to metal-hydride storage, where real-time SOC estimation is essential to track the internal absorption state, prevent saturation, and maintain the tank within its safe operating temperature and compatible pressure window.
2.1. Hydrogen Storage Experimental Setup
The experimental setup in Figure 2 investigates the kinetics of H2 absorption and desorption of a LaNi5 500 NL MH tank based on surface thermal management. It utilizes MH heating and cooling forced water convection. The tested MH tank is connected to a vacuum pump for clearing and two hydrogen sources: a high-pressure supply with a 10-bar regulator and an electrolyzer. A data acquisition system controls valves and records hydrogen flow rate, pressure, surface heat flux, and surface temperature. The MH tank, with a length of 35 cm and a radius of 3.5 cm, has a LaNi5-filled powder section, with 5 cm empty spaces at the top and bottom.
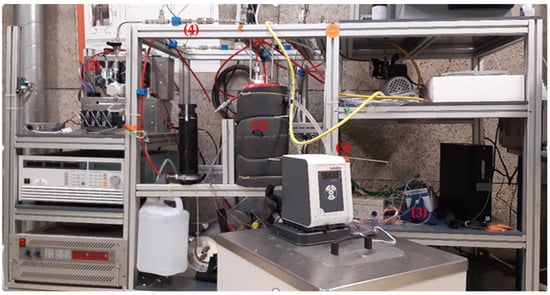
Figure 2.
Experimental fuel cell—metal-hydride bench test.
Experimental tests have been performed at different cooling and heating water temperatures and flow rates. It is composed of metal-hydride tanks (1), a PEM fuel cell stack and its components (2), a data acquisition system (3), a hydrogen circuit (4), and cooling/heating circuits (5). Discharging, the state is released from the MH tank through a pressure-regulated circuit to ensure a stable flow. A 300 W self-humidified PEMFC converts the released H2 into electricity connected to a DC power supply and a DC load for controlled energy management. The SOC real-time estimation based on MH surface measurements is estimated using an analytical method programmed in the LabVIEW software vesion 2024. The obtained values were compared with the calculated ones based on hydrogen flow rate accumulation. The metal hydride was activated through 3 vacuum-hydrogen cycles, consisting of evacuation below 10−3 bar, hydrogen charging at 10 bar at fixed external surface thermal conditions to stabilize the kinetics of LaNi5, and full discharging using a connected PEM-FC. All tests were then carried out at a controlled temperature range of (5, 10, 15, 20, 25, 30, 40 °C) using surface circulating water through an external 13 cm diameter water tank.
2.2. Mathematical Modeling
The proposed analytical model starts by calculating the H2 equilibrium pressure distribution inside a MH tank while ensuring adaptability to various geometries. The relationship between radius and height is considered. As shown in Figure 3, the model assumes a one-dimensional temperature distribution along the longitudinal axis. Combining physical modeling and data-driven correction, real-time inputs compute absorbed mass to derive a raw SOC. A correction layer, using log-polynomial or advanced models, refines accuracy, enabling reliable, real-time SOC estimation for direct control integration.
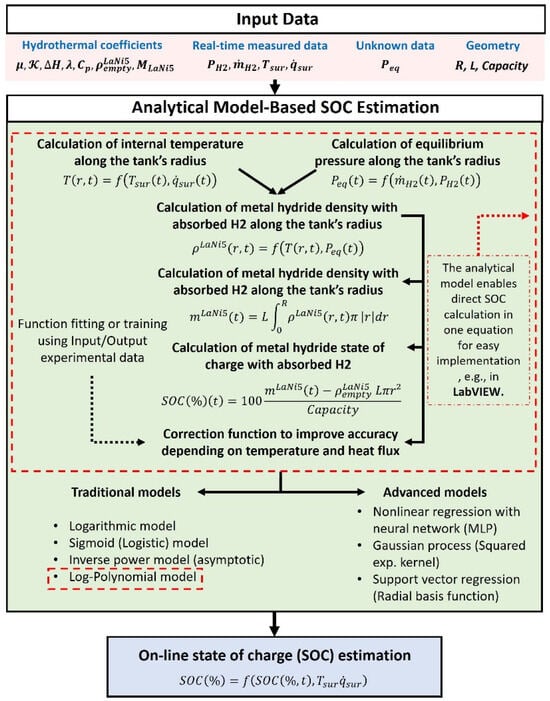
Figure 3.
Scheme of analytical-based SOC estimation for MH storage systems.
The equilibrium pressure within the MH bed is adjusted based on the H2 flow resistance, taking into account the inlet pressure, mass flow rate, H2 viscosity, bed length, LaNi5 permeability, and cross-sectional area. Additionally, the effective equilibrium pressure is corrected using Van’t Hoff’s equation, which relates the pressure to the local temperature. Dhaou et al. [22] experimentally analyzed the charging process of LaNi5, LaNi4.85Al0.15, and LaNi4.75Fe0.25 under quasi-isothermal, variable-pressure conditions. They derived a rate correlation linking the absorption rate to the logarithmic pressure ratio and the unreacted fraction (1–F). The constant rate followed an Arrhenius law, showing the thermal activation of the process.
This formulation captured the strong influence of operating pressure and temperature on kinetics and provided accurate fits to experimental data. In the study by Dhaou et al. [22], a ninth-order polynomial correlation was proposed to express the equilibrium pressure as a function of the H/M ratio for a reference temperature (25 °C), representing the atomic-scale absorption state. In the present work, an empirical correlation of the H/M ratio as a function of the equilibrium pressure is developed and defined as
where a, b, c, and d are the empirical parameters shown in Table 1. represents the local temperature over time, linking thermal gradients to reaction kinetics, and is the equilibrium pressure driving the absorption process, (30,932 J/mol) [23].

Table 1.
Empirical parameters for equilibrium pressure.
During absorption, the MH local density is determined from the local hydrogen-to-metal atomic ratio (H/M) equation defined as follows [24]:
where (6430 kg/m3) is the empty alloy density before charging. (2.016 g/mol) is the hydrogen molar mass, and (432 g/mol) is the alloy molar mass [25].
The effective equilibrium pressure in the metal-hydride bed depends on the measured pressure and inlet hydrogen flow rate. It is approximated by the following:
where is the inlet hydrogen pressure, is the hydrogen mass flow rate, μ is the dynamic viscosity of hydrogen, L is the length of the cylindrical bed, (10−9 m2) is the permeability of the porous medium, and is the cross-sectional area of the bed. The equilibrium pressure matches the inlet pressure for zero of the hydrogen flow rates. α is a correction factor related to the reservoir design specific to the manufacturer, and the pressure losses that can slightly affect the system’s physical behavior. For this reason, α is experimentally identified to account for the effects of the auxiliary components in the circuit.
During the MH charging state, energy conservation is governed by the balance between reaction enthalpy, sensible heat, and heat transfer. The exothermic hydriding reaction releases significant heat, which raises the bed’s local temperature. The temperature rise increases the equilibrium pressure and slows down hydrogen absorption, reducing both reaction kinetics and storage efficiency. The temperature evolution inside the metal-hydride reservoir was modeled using the transient heat equation with Dirichlet boundary conditions defined by the measured surface temperatures. The analysis considered temperature variation only along the cylinder’s diameter, neglecting axial variations. The internal reaction heat was treated as the thermal power recovered during cooling, incorporating an efficiency term to account for thermal losses, which can vary depending on the specific reservoir design.
Where is the effective specific heat capacity, defining the bed’s ability to store thermal energy, determined dynamically by
is the effective thermal conductivity that governs heat conduction along the cylinder diameter, calculated by
(530 J/kg K) is for the solid alloy, (14,500 J/mol K) is for the hydrogen gas, weighted by the porosity ε (0.5) and the SOC () [23]. Similarly, the effective thermal conductivity, mixing (2 W/(m K)) [25] of the solid phase and of the gas phase with the same porosity and SOC weighting.
The transient heat equation along the cylinder diameter is solved analytically using variable separation and Fourier series decomposition, providing an exact, closed-form expression of the temperature field. This method enables direct temperature evaluation without iterative steps, ensuring fast and stable computation [26]. The theoretical framework from [27] justifies the integration of measured heat sources in the thermal modeling.
The state of charge estimation starts with a formulation computing the total metal-hydride mass inside the cylindrical bed by integrating using trapeze method the local hydride density along the diameter, capturing radial density variations due to non-uniform absorption during charging, and is presented as
The state of charge is defined as the percentage of hydrogen stored relative to the system’s full storage capacity. It compares the current hydride mass to the empty bed mass, normalized by the maximum storage capacity.
The enhanced SOC model applies a log-polynomial regression to correct residual errors from the physical prediction by incorporating nonlinear and cross-effects of key operating variables. It uses the base SOC from the physical model, the measured surface temperature, and the measured heat power as inputs. Squared and linear logarithmic terms capture nonlinear sensitivities, while direct linear terms account for primary dependencies. The intercept adjusts any global bias:
is the measured volumetric heating power released by the exothermic hydriding reaction. The term is a thermal efficiency factor. Together, these terms describe the transient energy balance during charging, linking internal heat generation, heat conduction, and thermal storage within the bed.
Table 2 shows the optimized parameters of the log-polynomial regression model, calibrated using the experimentally tested 500 NL LaNi5 metal-hydride tank. Residuals plotted in log-space exhibited non-zero second derivatives with respect to each variable and variable sign of the first derivative across the domain. This indicates a response that is neither monotonic nor affine but instead curvilinear with inflection regions. Since metal-hydride kinetics introduce power-law and exponential dependencies, expressing variables in logarithmic form linearizes these natural scalings, making curvature directly interpretable as a second-order deviation from the physical model. A quadratic basis in log-space is thus the lowest-order mathematical structure that can reproduce the observed curvature (non-zero second derivative), the change in sensitivity sign (crossing of the first derivative through zero), and the multiplicative influence typical of thermally activated processes.
Table 2.
Log-polynomial empirical parameters for SOC enhancement.
2.3. Results and Discussions
Figure 4 compares different fitting models for the H/M pressure relationship of the metal hydride. The experimental data show the typical sigmoidal behavior of absorption, with a sharp transition between low and high storage states. Among the models, the arctangent-based correlation (black curve) best aligns with the experimental points across all regions: low pressure, transition zone, and saturation. This indicates superior accuracy and stability compared to logistic and exponential forms, which deviate slightly in the transition or plateau regions.
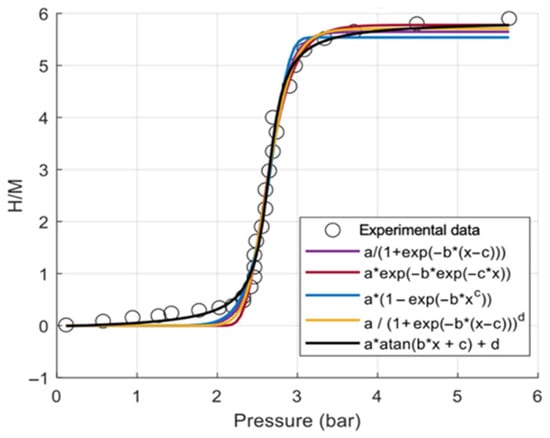
Figure 4.
Model fitting of H/M–pressure relationship against experimental data.
The arctangent model shows the highest goodness of fit with (R2) = 0.992538, compared to (R2) = 0.990423 for the Richards logistic model and (R2) = 0.989725 for the Gompertz model. From a thermodynamic perspective, Figure 5 illustrates the variation of LaNi5 material density with equilibrium pressure and temperature, comparing the analytical correlation (surface) with experimental data (black lines). The density sharply increases with pressure until reaching saturation, while higher temperatures slightly shift the transition to higher pressures due to thermodynamic effects. The close alignment between the model surface and experimental curves at 20 °C, 30 °C, and 40 °C confirms the correlation’s accuracy for predicting hydride density across operating conditions.
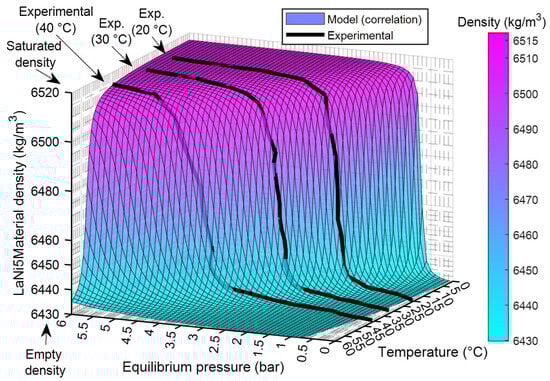
Figure 5.
LaNi5 density variation with pressure and temperature: model and experimental.
Figure 6 shows that under a fixed inlet pressure (10 bar), each charging cycle exhibits the coupled thermal and kinetic behavior of hydriding. The surface heat flux rises sharply due to the exothermic reaction, then decays as the driving pressure difference diminishes, while the hydrogen flow follows the same peak–decay profile as mass transfer slows near equilibrium. Lower cooling temperatures sustain higher flux and flow rates by reducing equilibrium pressure and enhancing absorption. These experimental measurements of surface heat flux, hydrogen flow, and inlet pressure are the key inputs used for accurate SOC estimation.
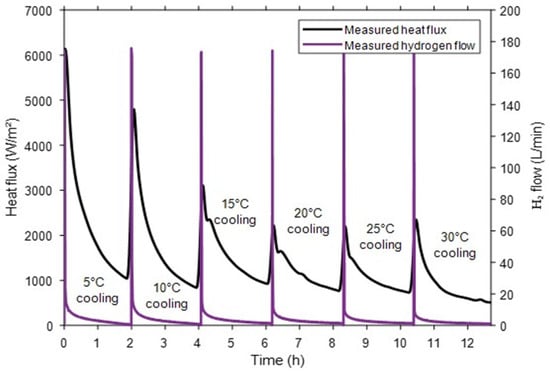
Figure 6.
Measured surface heat flux and hydrogen flow under different cooling conditions.
Figure 7 shows that, under a fixed inlet pressure of 10 bar, the analytical SOC estimation model accurately tracks the experimental SOC evolution across all cooling conditions, from 5 °C to 30 °C. The charging curves highlight the influence of thermal management: lower cooling temperatures accelerate absorption kinetics, reaching full saturation faster (around 1.7 h at 5 °C compared to over 2.2 h at 30 °C). This is driven by a stronger driving force for absorption at lower equilibrium pressure. The close overlap between measured and estimated SOC confirms the model’s robustness and accuracy across different thermal conditions. The surface temperature profiles, which also serve as critical inputs for SOC estimation, capture the heat release from the exothermic reaction, showing sharper peaks under more efficient cooling. At early SOC, the model is more sensitive to temperature transients, as minor deviations in equilibrium pressure produce larger relative errors, and the residuals remain bounded but exhibit sharper local variations. In the mid-range, where the driving force is stable and temperature gradients are moderate, the estimation error becomes minimal and nearly uniform. Near saturation, the reduced kinetics amplify the effect of small pressure or temperature offsets, leading to a slight increase in residuals without compromising overall accuracy.
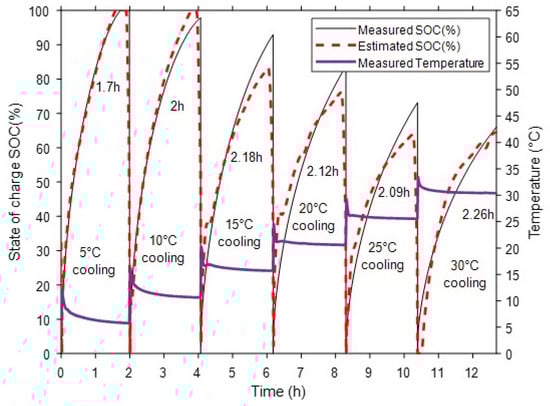
Figure 7.
Measured and estimated SOC with surface temperature under different cooling conditions.
Table 3 highlights the significant improvement achieved by integrating an enhancement model into the SOC estimation. Without enhancement, the root mean square error (RMSE) reaches 9.35%, indicating a deviation from experimental data. Applying basic models like logarithmic or inverse power slightly reduces the error (~4.25%), while the sigmoid model performs better with an RMSE of 2.44%. The log-polynomial enhancement provides the most accurate prediction, reducing the RMSE to (1.49%), demonstrating its superior ability to capture nonlinear and cross-dependent effects.
Table 3.
RMSE comparison of enhancement models for SOC estimation accuracy.
The method is formulated in a geometry-independent way, since transport equations and boundary terms scale with radius and height, not with a specific tank size. This supports its claim of universality across cylindrical geometries. Its universality follows from the fact that the model depends mainly on external measurements of temperature, pressure, and flow, which naturally adjust to each tank’s geometry and internal structure.
The method relies on closed-form expressions and simple algebraic operations, allowing real-time execution on standard microcontrollers using only temperature, pressure, and flow sensors. Practical challenges are mainly linked to sensor noise and boundary-temperature stability near saturation, rather than processing load.
3. mCHP Behavior, H2 Demand, and CO2 Emission Under Different Fuel Consumption
This section presents experimental analysis of the hybrid FC mCHP—boiler behavior operating under different conditions in order to determine the required amount of hydrogen during one year. To reduce emissions, the required amount of hydrogen is determined. Evaluation of the CO2 emission was also carried out to compare the studied mCHP CH4 fuel consumption integrated reformer (IR) process with other H2 produced by artificial photosynthesis.
3.1. mCHP Experimental Setup
The test bench shown in Figure 8 is used to investigate mCHP for a single-family home with heat requirements up to 32,000 kWh and electricity needs of 6200 kWh per year. The daily production of electricity can cover the household’s basic needs. The test bench integrates a PEMFC providing electrical power of 700 W and the thermal power of 1100 W, recovered from the FC cooling system to maintain it at 70 °C. To prolong the fuel cell lifespan, it operates continuously for a maximum of 45.5 h, after which it undergoes a 3 h regeneration. Additionally, the FC only starts when the expected operating period is sufficiently long, ensuring stable operation and extending its lifespan. The mCHP system also includes a condensing boiler with a thermal power of 19 kW to provide heating when the fuel cell’s thermal output is insufficient or during the regeneration phase. A domestic hot water tank (220 L) supplies the building’s domestic hot water demand, and a human–machine interface for setting parameters such as the heating curve and temperature setpoints. The mCHP unit uses a reformer, integrated into the system to convert the natural gas into hydrogen for the fuel cell.
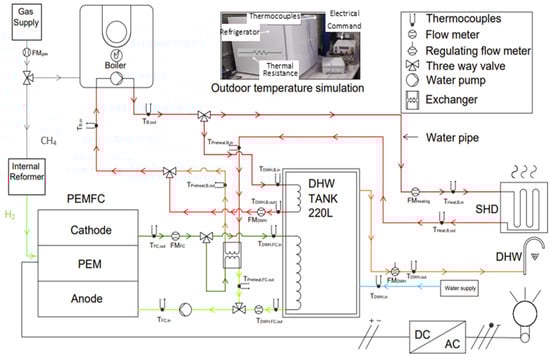
Figure 8.
Test bench schematic.
In addition to the mCHP system, the test bench is equipped with a fan coil unit with a thermal power of 8 kW, to simulate the space heating demand (SHD). A temperature control system is implemented to simulate outside temperature conditions. It is based on a refrigeration unit equipped with an electric resistance heater, whose thermal power exceeds that of the refrigerator. The resistance heater is controlled by LabVIEW to increase the temperature by 1 °C per hour. To simulate domestic hot water (DHW) consumption, the experimental system is equipped with an electrically controlled valve that regulates the hot water flow rate. The valve opening is controlled by LabVIEW through an electrical voltage that varies according to a predefined DHW consumption profile integrated into the program.
The experimental data were recorded using the National Instruments (NI-DAQ) device, which has a data sampling rate of 1 sample per 30 s. The measurements of temperatures and water flow at different points of the system were used to determine the various powers produced by the system and consumed by the equipment, using the following equation.
where P is the produced or consumed heat (W), is the mass flow rate of water (kg/s), and is the outlet and inlet temperature difference (°C).
3.2. Experimental Results and Analysis
Various tests were performed to analyze the studied mCHP behavior under variation in the outdoor temperature from 3 °C to 10 °C, with incrementation of 1 °C per hour. These tests were conducted for the same setpoints, temperature, and heating curve, and with an imposed DHW flow rate. Figure 9 shows the boiler behavior under different outdoor temperatures. As can be seen, the boiler operates cyclically, reaching a maximum power exceeding 10 kW at startup before entering the steady state with a power of around 7.2 kW. Figure 9a also illustrates the duration of each operating step; as can be seen, the cycle duration decreases with increasing outdoor temperature. The energy production also decreases, reflecting the thermal demand reduction. The operating duration is very short when the outdoor temperature is about 4 °C, 7 °C, 8 °C, and 10 °C, when the boiler supplies the DHW tank thermal need. The system prioritizes the DHW tank over the space heat demand (SHD) once the thermal DHW tank requirement reaches the setpoint. Figure 10 shows that the FC operates continuously, with different behaviors. The system always prioritizes DHW. During SHD operation, the water flow rate is kept constant, while the supply temperature varies depending on whether the boiler and/or the fuel cell are operating, in order to match the produced and demanded power. When the boiler and the fuel cell operate simultaneously for SHD, the fuel cell preheats the return line, thereby increasing the boiler inlet temperature and reducing boiler fuel consumption.
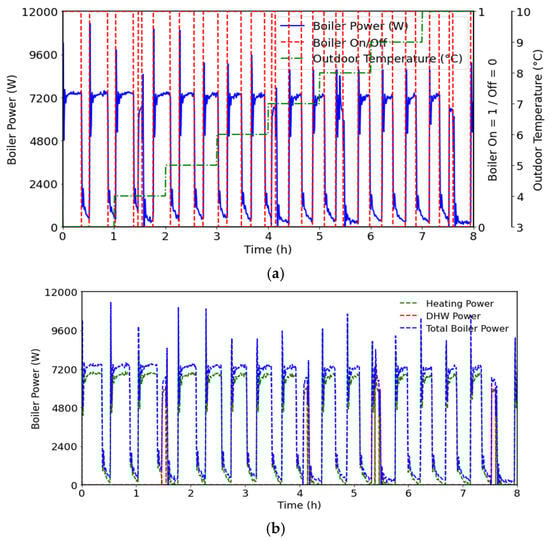
Figure 9.
Boiler energy supplied and operating cycles under different outdoor temperatures,(a) Boiler On/Off cycling duration time under different outdoor temperatures; (b) Boiler energy supplied to DHW demand’s and SHDs.
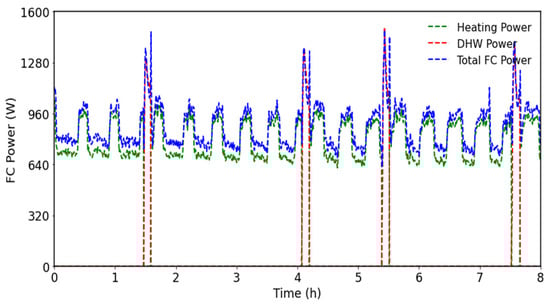
Figure 10.
FC energy supplied to DHW and SHDs.
Figure 11 illustrates the hourly thermal energy generated by the mCHP system. It presents the experimental results obtained for different DHW and SHDs that are linked to the outside temperature. The DHW demand is influenced by the water supply temperature (DHW is high for low outside temperatures). The SHW demand is defined for one house (of 120 m2) with volumetric heat loss of 1 W/m3K, and it is defined taking into account the comfort temperature. The setpoint temperature was controlled by the mCHP in order to feed DHW and SHDs. It is taken as 50 °C for DHW and varies with outdoor temperature for the SHW circuit. As shown by Figure 11, the produced thermal energy decreases as the outdoor temperature increases, especially when the outdoor temperature is 4 °C and 8 °C due to the increase in the heat water needed (SHD and DHW). The electrical energy produced depends on the number of FC operations, which run at a constant power (750 W) after a few minutes of startup.
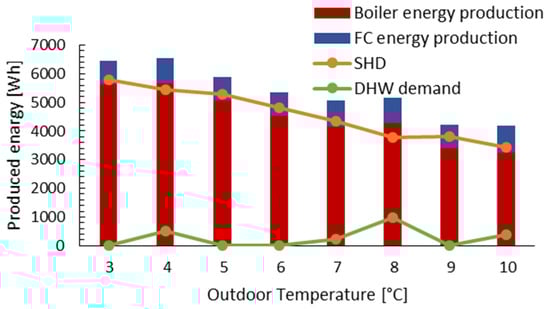
Figure 11.
mCHP produced thermal energy under different outdoor temperature conditions.
The developed model [28] uses input inlet parameters such as the surface area, volumetric loss coefficient, outdoor temperature, and hourly, daily, and monthly DHW demand coefficients. Based on these factors, the yearly DHW and SHD were computed for a house in Normandy with a surface area of 120 m2 and a volumetric loss coefficient of 1 W/(m3 °C). The model takes into account the maximum continuous operating hours and the FC regeneration cycle. The model computes the hourly hydrogen consumption as its output.
Figure 12 shows the mCHP yearly performance. The maximum produced energy is in the coldest months, with more than 4000 kWh. The lowest energy production (500 kWh) is obtained during summer. According to these results, the thermal demand is met throughout the year. However, the electrical demand is not covered during the periods when the thermal requirements do not allow the fuel cell to operate for its minimum required runtime. The mCHP can be supplemented by an intelligent energy management system that allows the system to switch to other sources of electricity (solar, wind, storage battery, reversible fuel cell, etc.). Figure 13 shows the monthly quantity of natural gas or hydrogen required to satisfy the household energy needs. The calculation of the CH4 requirement is based on an empirical equation that uses only the product energy as input and incorporates the efficiency of the mCHP system. The conversion to hydrogen is based on the lower heating value (LHV). The yearly mCHP fuel need is about 1865 kg for H2 and 4442 kg for CH4.
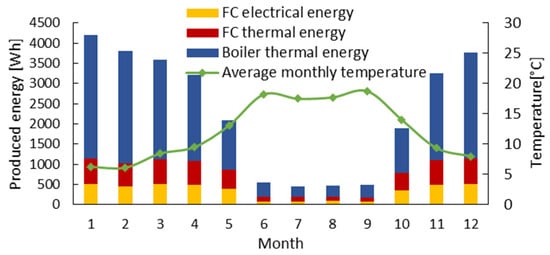
Figure 12.
Yearly thermal and electrical energy produced by the mCHP system as a function of the monthly average outdoor temperature.
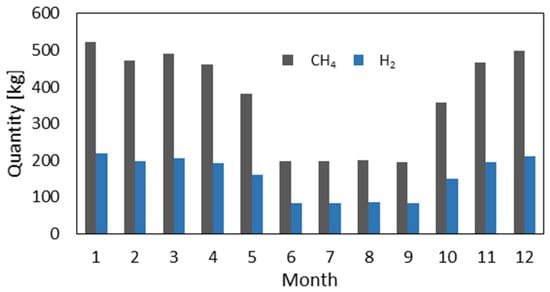
Figure 13.
Monthly natural gas consumption and its hydrogen equivalent.
The results for CO2 emission are obtained for the studied mCHP system using CH4 as the primary combustible and hydrogen produced by the reforming process. The CO2 emission factor is provided by the French Agency for Environment and Energy Management (ADEME) [29,30]. The results were compared with a conventional system (separate sources) using CH4 as a fuel for the boiler and the grid electricity [31], and with an mCHP unit supplied only by H2 produced via artificial photosynthesis (AP) [32]. Figure 14 compares the monthly CO2 emissions for both processes. As can be seen, the reduction in CO2 emissions is strongly related to the hydrogen production process. Hydrogen produced by AP has a significant environmental benefit, with a high reduction in CO2 emissions. However, H2 production by reforming emits more CO2 than the conventional system. During summer, the CO2 emissions of the mCHP system become slightly lower than those of the conventional system. This is mainly due to the significantly reduced operating time of the FC during this period, while the boiler covers almost all the thermal demand, which, in turn, limits the CO2 emissions emitted by the reforming process.
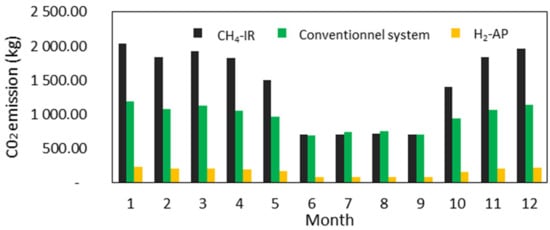
Figure 14.
Monthly CO2 emission for the three mCHP fuel supply configurations.
4. Conclusions
This paper presents an original study on micro-combined heat and power for building applications. Two future research investigations were integrated in this work to make the system energy self-sufficient using only H2 as the supplied fuel of the mCHP unit. The first investigation concerning hydrogen solid storage and estimation of the metal-hydride state of charge based only on the external parameters. The second investigation is related to gold hydrogen production with the artificial photosynthesis process.
The experimental studies of the mCHP unit demonstrate that the boiler cycling decreases when the outdoor temperature increases, and, consequently, the produced energy also decreases. The PEMFC operates continuously with two behaviors depending on the state of the boiler. The studied mCHP yearly performance shows a disadvantage of the mCHP unit in summer, where heat demand is low, and the electricity produced by the fuel cell will not be sufficient, and the system must be switched to another source. Hydrogen production is one of the parameters affecting the mCHP’s overall efficiency and the environment. Steam reforming offers low production costs but a significant CO2 emission that requires the implementation of carbon capture, which substantially increases investment costs. H2 production by artificial photosynthesis processes shows the lowest carbon impact despite the fact that this method remains at a laboratory scale and requires more investigations. Another key parameter impacting mCHP efficiency is the dynamic estimation of MH SOC. In this area, the present work demonstrates an adaptive and experimentally validated framework for real-time SOC prediction of metal-hydride hydrogen storage systems using only external, non-intrusive measurements. By integrating analytical modeling of pressure, temperature, and density distributions with a log-polynomial correction, the method achieves high accuracy (RMSE reduced to ~1.5%) across varying thermal conditions and tank geometries. Experimental validation on a 500 NL LaNi5 tank under different cooling regimes confirmed the model’s robustness and adaptability, accurately reproducing dynamic charging behaviors and thermal effects. The approach eliminates the need for internal sensors, simplifies system integration, and enables reliable real-time monitoring for control and optimization in stationary and mobile applications. This makes it a strong candidate for embedded implementation in energy systems, coupling metal hydrides with fuel cells or renewable-based storage platforms.
These three studies represent distinct research axes developed within the laboratory, and future work will focus on their full integration into a unified hydrogen pathway, combining artificial-photosynthesis production, SOC-controlled metal-hydride storage, and PEMFC-based micro-CHP operation.
Author Contributions
Conceptualization, H.L. and T.K.; methodology, S.F., T.K., G.F. and H.L.; software, S.F. and T.K.; validation, S.F. and T.K.; formal analysis, S.F., T.K., G.F. and H.L.; investigation, T.K. and S.F.; resources, H.L.; data curation, S.F., T.K. and G.F.; visualization, S.F., T.K., G.F. and H.L.; writing—original draft preparation, S.F., T.K. and G.F.; writing—review and editing, S.F., T.K., G.F. and H.L.; supervision, H.L.; project administration, H.L.; funding acquisition, H.L. All authors have read and agreed to the published version of the manuscript.
Funding
This research was funded by the Department of Manche.
Data Availability Statement
Data will be available upon request.
Acknowledgments
The authors would like to acknowledge the departmental council of the Manche (CD50) and Saint-Lô Agglomeration for the funding.
Conflicts of Interest
The authors declare no conflicts of interest.
Abbreviations
The following abbreviations are used in this manuscript:
| DHW | Domestic hot water |
| FC | Fuel cell |
| IR | Internal reformer |
| LHV | Lower heating value |
| mCHP | Micro-combined heat and power production |
| MH | Metal hydrides |
| PEMFC | Proton exchange membrane fuel cell |
| SHD | Space heat demand |
| SOC | State of charge |
| RMSE | Root mean square error |
References
- Salehabadi, A.; Zanganeh, J.; Moghtaderi, B. Exploring Hydrogen Production over Non-Thermal Ammonia Electrolysis: A Practical Review. Sustain. Mater. Technol. 2025, 46, e01732. [Google Scholar] [CrossRef]
- Midilli, A.; Kucuk, H.; Topal, M.; Akbulut, U.; Dincer, I. A Comprehensive Review on Hydrogen Production from Coal Gasification: Challenges and Opportunities. Int. J. Hydrogen Energy 2021, 46, 25385–25412. [Google Scholar] [CrossRef]
- Szablowski, L.; Wojcik, M.; Dybinski, O. Review of Steam Methane Reforming as a Method of Hydrogen Production. Energy 2025, 316, 134540. [Google Scholar] [CrossRef]
- Soltani, S.; Lahiri, A.; Bahzad, H.; Clough, P.; Gorbounov, M.; Yan, Y. Sorption-Enhanced Steam Methane Reforming for Combined CO2 Capture and Hydrogen Production: A State-of-the-Art Review. Carbon Capture Sci. Technol. 2021, 1, 100003. [Google Scholar] [CrossRef]
- El-Shafie, M. Hydrogen Production by Water Electrolysis Technologies: A Review. Results Eng. 2023, 20, 101426. [Google Scholar] [CrossRef]
- Xu, Y.; Zhou, Y.; Li, Y.; Ding, Z. Research Progress and Application Prospects of Solid-State Hydrogen Storage Technology. Molecules 2024, 29, 1767. [Google Scholar] [CrossRef]
- Wang, X.; Peng, P.; Witman, M.D.; Stavila, V.; Allendorf, M.D.; Breunig, H.M. Technoeconomic Insights into Metal Hydrides for Stationary Hydrogen Storage. Adv. Sci. 2025, 12, 2415736. [Google Scholar] [CrossRef]
- Kaoutari, T.; Louahlia, H.; Schaetzel, P.; Gualous, H. Modeling of a Metal Hydride Energy Storage Tank Dynamics Using Hybrid Numerical, Experimental, and Machine Learning Methods. Appl. Therm. Eng. 2025, 258, 124718. [Google Scholar] [CrossRef]
- Kaoutari, T.; Louahlia, H.; Schaetzel, P. Optimization of Hydrogen Gas Storage in PEM Fuel Cell mCHP System for Residential Applications Using Numerical and Machine Learning Modeling. Energy Convers. Manag. 2025, 341, 120017. [Google Scholar] [CrossRef]
- Brooks, K.P.; Sprik, S.J.; Tamburello, D.A.; Thornton, M.J. Design Tool for Estimating Metal Hydride Storage System Characteristics for Light-Duty Hydrogen Fuel Cell Vehicles. Int. J. Hydrogen Energy 2020, 45, 24917–24927. [Google Scholar] [CrossRef]
- Luo, L.; Cristofari, C.; Levrey, S. Cogeneration: Another Way to Increase Energy Efficiency of Hybrid Renewable Energy Hydrogen Chain—A Review of Systems Operating in Cogeneration and of the Energy Efficiency Assessment through Exergy Analysis. J. Energy Storage 2023, 66, 107433. [Google Scholar] [CrossRef]
- Ramadhani, F.; Hussain, M.A.; Mokhlis, H. A Comprehensive Review and Technical Guideline for Optimal Design and Operations of Fuel Cell-Based Cogeneration Systems. Processes 2019, 7, 950. [Google Scholar] [CrossRef]
- Briguglio, N.; Ferraro, M.; Brunaccini, G.; Antonucci, V. Evaluation of a Low Temperature Fuel Cell System for Residential CHP. Int. J. Hydrogen Energy 2011, 36, 8023–8029. [Google Scholar] [CrossRef]
- Gabana, P.; Tinaut, F.V.; Reyes, M.; Domínguez, J.I. Performance Evaluation of a Fuel Cell mCHP System under Different Configurations of Hydrogen Origin and Heat Recovery. Energies 2023, 16, 6420. [Google Scholar] [CrossRef]
- Song, K.; Hou, T.; Jiang, J.; Grigoriev, S.A.; Fan, F.; Qin, J.; Wang, Z.; Sun, C. Thermal Management of Liquid-Cooled Proton Exchange Membrane Fuel Cell: A Review. J. Power Sources 2025, 648, 237227. [Google Scholar] [CrossRef]
- Meng, X.; Sun, C.; Mei, J.; Tang, X.; Hasanien, H.M.; Jiang, J.; Fan, F.; Song, K. Fuel Cell Life Prediction Considering the Recovery Phenomenon of Reversible Voltage Loss. J. Power Sources 2025, 625, 235634. [Google Scholar] [CrossRef]
- Nandy, S.; Savant, S.A.; Haussener, S. Prospects and Challenges in Designing Photocatalytic Particle Suspension Reactors for Solar Fuel Processing. Chem. Sci. 2021, 12, 9866–9884. [Google Scholar] [CrossRef]
- Foin, G. Production D’hydrogène par Photosynthèse Artificielle: Modélisation du Transfert Radiatif Pour L’analyse de la Spectrophotométrie et de son Couplage Cinétique en Photoréacteur. Ph.D. Thesis, Université Clermont Auvergne, Clermont-Ferrand, France, 2024. [Google Scholar]
- Heining, M.; Buchholz, R. Photobioreactors with Internal Illumination—A Survey and Comparison. Biotechnol. J. 2015, 10, 1131–1137. [Google Scholar] [CrossRef]
- Calvin, K.; Dasgupta, D.; Krinner, G.; Mukherji, A.; Thorne, P.W.; Trisos, C.; Romero, J.; Aldunce, P.; Barrett, K.; Blanco, G.; et al. IPCC, 2023: Climate Change 2023: Synthesis Report. Contribution of Working Groups I, II and III to the Sixth Assessment Report of the Intergovernmental Panel on Climate Change; Core Writing Team, Lee, H., Romero, J., Eds.; First; Intergovernmental Panel on Climate Change (IPCC): Geneva, Switzerland, 2023. [Google Scholar]
- Patel, G.H.; Havukainen, J.; Horttanainen, M.; Soukka, R.; Tuomaala, M. Climate Change Performance of Hydrogen Production Based on Life Cycle Assessment. Green Chem. 2024, 26, 992–1006. [Google Scholar] [CrossRef]
- Dhaou, H.; Askri, F.; Ben Salah, M.; Jemni, A.; Ben Nasrallah, S.; Lamloumi, J. Measurement and Modelling of Kinetics of Hydrogen Sorption by LaNi5 and Two Related Pseudobinary Compounds. Int. J. Hydrogen Energy 2007, 32, 576–587. [Google Scholar] [CrossRef]
- Askri, F.; Ben Salah, M.; Jemni, A.; Ben Nasrallah, S. Optimization of Hydrogen Storage in Metal-Hydride Tanks. Int. J. Hydrogen Energy 2009, 34, 897–905. [Google Scholar] [CrossRef]
- Nam, J.; Ko, J.; Ju, H. Three-Dimensional Modeling and Simulation of Hydrogen Absorption in Metal Hydride Hydrogen Storage Vessels. Appl. Energy 2012, 89, 164–175. [Google Scholar] [CrossRef]
- Jemni, A.; Nasrallah, S.B. Study of Two-Dimensional Heat and Mass Transfer during Absorption in a Metal-Hydrogen Reactor. Int. J. Hydrogen Energy 1995, 20, 43–52. [Google Scholar] [CrossRef]
- Hahn, D.W.; Özisik, M.N. Heat Conduction; John Wiley & Sons: Hoboken, NJ, USA, 2012; ISBN 978-1-118-33011-1. [Google Scholar]
- Zill, D.G.; Cullen, M.R. Differential Equations with Boundary-Value Problems; Cengage Learning: Boston, MA, USA, 2008; ISBN 978-0-495-10836-8. [Google Scholar]
- Elkhatib, R.; Petrone, R.; Louahlia, H. Dynamic Study of Hydrogen Optimization in the Hybrid Boiler-Fuel Cells MCHP Unit for Eco-Friendly House. Int. J. Hydrogen Energy 2024, 56, 973–988. [Google Scholar] [CrossRef]
- Production D’hydrogène. Available online: https://prod-basecarbonesolo.ademe-dri.fr/documentation/UPLOAD_DOC_FR/index.htm?production-dhydrogene_2.htm (accessed on 4 December 2025).
- Gaz. Available online: https://prod-basecarbonesolo.ademe-dri.fr/documentation/UPLOAD_DOC_FR/index.htm?gaz.htm (accessed on 4 December 2025).
- éCO2mix—Les émissions de CO2 par kWh produit en France|RTE. Available online: https://www.rte-france.com/donnees-publications/eco2mix-donnees-temps-reel/emissions-co2-par-kwh-produit-france (accessed on 12 December 2025).
- Huang, X.; Jeswani, H.K.; Azapagic, A. Green Hydrogen Production in Photoelectrochemical Artificial-Leaf Systems with Different Tandem Solar Cells: An Environmental and Economic Assessment of Industrial-Scale Production in China. Energy Convers. Manag. 2025, 344, 120274. [Google Scholar] [CrossRef]
Disclaimer/Publisher’s Note: The statements, opinions and data contained in all publications are solely those of the individual author(s) and contributor(s) and not of MDPI and/or the editor(s). MDPI and/or the editor(s) disclaim responsibility for any injury to people or property resulting from any ideas, methods, instructions or products referred to in the content. |
© 2026 by the authors. Licensee MDPI, Basel, Switzerland. This article is an open access article distributed under the terms and conditions of the Creative Commons Attribution (CC BY) license.