Abstract
Hydrogen energy is essential in the transition to sustainable transportation planning, providing a clean and efficient alternative to traditional fossil fuels. As a versatile energy carrier, hydrogen facilitates the decarbonization of diverse transportation modes, including passenger vehicles, heavy-duty trucks, trains, and maritime vessels. To justify and clarify the role of hydrogen energy in sustainable transportation planning, this study conducts a comprehensive techno-economic and environmental assessment of hydrogen production in the USA, Europe, and China. Utilizing the Shlaer–Mellor method for policy modeling, the analysis highlights regional differences and offers actionable insights to inform strategic decisions and policy frameworks for advancing hydrogen adoption. Hydrogen production potential was assessed from solar and biomass resources, with results showing that solar-based hydrogen production is significantly more efficient, producing 704 tons/yr/km2, compared to 5.7 tons/yr/km2 from biomass. A Monte Carlo simulation was conducted to project emissions and market share for hydrogen and gasoline vehicles from 2024 to 2050. The results indicate that hydrogen vehicles could achieve near-zero emissions and capture approximately 30% of the market by 2050, while gasoline vehicles will decline to a 60% market share with higher emissions. Furthermore, hydrogen production using solar energy in the USA yields a per capita output of 330,513 kg/yr, compared to 6079 kg/yr from biomass. The study concludes that hydrogen, particularly from renewable sources, holds significant potential for reducing greenhouse gas emissions, with policy frameworks in the USA, Europe, and China focused on addressing energy dependence, air pollution, and technological development in the transportation sector.
1. Introduction
Hydrogen production is increasingly recognized as a key element in the global transition to sustainable transportation planning considering different advanced technologies [1,2,3]. As a clean, versatile energy carrier, hydrogen can be produced from a wide range of sources, including renewable resources like wind, solar, and biomass, which makes it critical for reducing greenhouse gas emissions [4,5]. It plays a vital role in sectors that are difficult to electrify, such as heavy industry, long-distance transportation, and aviation [6,7]. Additionally, hydrogen has the potential to store excess renewable energy, providing a solution to the intermittency of wind and solar power. Its use in fuel cells also offers a clean alternative to traditional fossil fuels, contributing to global efforts to combat climate change and promote energy security [8,9,10]. The optimal hydrogen production method depends on resource availability and specific goals. Electrolysis powered by renewables is the most sustainable, with zero emissions, while steam methane reforming (SMR) remains the most cost-effective due to its scalability and mature infrastructure [2]. On the other hand, its storage and transportation pose challenges that are currently being addressed through ongoing research. Recent research on hydrogen storage materials has shown significant improvements. For example, Sohan Bir Singh et al. (2019) [11] found that metal (Ni/Pd) and nitrogen codoped mesoporous carbon materials achieved a hydrogen uptake of 5 wt%, with excellent cyclic stability. Additionally, Sohan Bir Singh et al. (2020) [12] demonstrated that exfoliated graphene oxide (GO) materials, particularly those treated at 300 °C, showed a hydrogen uptake of 3.12 wt%. These advancements highlight hydrogen’s storage solutions for its broader adoption.
Figure 1 presents the projected hydrogen energy production levels across different regions, comparing estimates for 2025 and 2030. The data highlight Europe as the leading region, expected to produce 13 million tons of hydrogen by 2030, with a significant increase from 2.2 million tons in 2025. North America follows closely, with an anticipated production of 9.3 million tons by 2030, up from 2.8 million tons in 2025. Latin America is projected to have moderate growth, reaching 5.2 million tons in 2030 [5]. Oceania and the Middle East are also expected to play important roles in hydrogen energy production, with Oceania’s output increasing from 0.8 million tons in 2025 to 4.7 million tons by 2030, and the Middle East seeing an increase from 0.9 to 2 million tons over the same period. Other regions, such as Africa, China, and the rest of Asia, are projected to have lower hydrogen production levels, but they all show growth, highlighting a global shift toward hydrogen as a key energy source. Japan and South Korea, while relatively small in terms of production, are expected to contribute modestly, increasing from 0.2 million tons in 2025 to 0.3 million tons by 2030. Figure 1 highlights the growing importance of hydrogen energy production, especially in Europe and North America, as part of the broader energy transition. Hydrogen’s versatility as a clean energy carrier, along with increasing regional efforts to decarbonize industries, transportation, and power generation, is driving this global push. The notable projected increase in production reflects the rising demand for sustainable and scalable solutions to meet future energy needs while reducing greenhouse gas emissions [13].

Figure 1.
Global projections for hydrogen energy production by 2025 and 2030 (in million tons). Source: Hydrogen Council; McKinsey & Company; ID 1391177 [13].
Conversely, the global transportation sector is at a critical moment in its evolution, driven by the urgent need to transition to more sustainable and environmentally friendly energy sources. Central to this shift is the growing interest in hydrogen as a viable alternative to fossil fuels, since hydrogen energy has emerged as a critical component of future energy systems due to its potential to reduce greenhouse gas emissions, alleviate air pollution, and contribute to energy independence. With climate change [14] and energy security being key priorities for governments and industries worldwide, hydrogen-based solutions offer a promising pathway to achieving sustainable transportation goals, considering the techno-economic aspects and environment [15,16,17].
Several studies have examined hydrogen’s potential as a sustainable energy source for transportation, focusing on production methods [18,19,20,21], storage technologies [22], and economic viability [23,24,25,26]. The following are several significant studies:
Ghasemi et al. [27] analyzed hydrogen production from fossil fuels and renewable sources, such as biomass. Their findings show that thermochemical methods, like gasification, are more scalable than biological and electrochemical processes, although improvements are needed for biomass-based hydrogen to be competitive. Fakhreddine et al. [28] reviewed hydrogen fuel cells (HFCs) in various transportation modes. They highlighted HFCs’ high efficiency and zero emissions, predicting widespread adoption, though large airplanes may only use HFCs for auxiliary power in the near future due to storage limitations. Zhan et al. [29] conducted a techno-economic comparison of hydrogen storage methods for hybrid trains. While compressed hydrogen is the most mature, liquid hydrogen and ammonia offer higher storage densities and cost efficiency. The authors emphasize the role of hydrogen in decarbonizing rail transport. Muñoz Díaz et al. [30] explored green hydrogen production and export potential in Chile, highlighting the country’s renewable energy resources. However, current production costs are high (3.5 USD/kg), and further optimizations are required to make hydrogen export more competitive. Granovskii et al. [31] provided an early examination of hydrogen production technologies, comparing traditional natural gas reforming with renewable methods such as wind and solar-based electrolysis. Their study highlights a critical trade-off between environmental benefits and economic efficiency. They find that hydrogen production via electrolysis using wind energy is the most effective in mitigating greenhouse gas emissions. However, natural gas reforming remains more favorable for reducing air pollution due to its lower cost. They propose a mathematical model for quantifying the environmental and economic sustainability of these methods, emphasizing the challenges of balancing ecological goals with economic feasibility. Aminov et al. [32] built on the theme of hydrogen’s role in a low-carbon energy future by discussing the integration of hydrogen production into nuclear power plants. Their analysis focuses on Russia’s energy strategy, which envisions using excess electricity from nuclear plants for hydrogen production via electrolysis. This approach serves the following two purposes: stabilizing nuclear power generation and producing hydrogen at competitive costs. They argue that this model can provide nuclear power plants with a stable base load and contribute to carbon-free hydrogen production. The article also explores hydrogen’s commercial viability and purity requirements for industrial use, presenting a case for hydrogen as a versatile and valuable product in various sectors. Qureshi et al. [33] reviewed the current state of hydrogen as a transportation fuel, recognizing its potential to replace fossil fuels in internal combustion engines. Hydrogen’s clean-burning properties, high energy density, and diverse production methods make it a promising candidate for renewable energy. This review outlines various hydrogen production techniques, from conventional steam reforming to emerging technologies like plasma reforming and photoelectrolysis. However, the authors point out significant challenges, particularly in hydrogen storage, and emphasize the need for further research to address the risks associated with hydrogen production, handling, and transportation. They also discuss the techno-economic challenges in making hydrogen a mainstream energy carrier, noting that while hydrogen holds great promise, its widespread adoption still faces hurdles. Balat [34] discussed the importance of hydrogen in addressing air pollution and reducing vehicle emissions. He underscores hydrogen’s potential as a secondary energy carrier that can be produced through various means, including electrolysis and natural gas reforming. The study highlights the strategic importance of hydrogen in transitioning to a low-emission, sustainable energy system. The combustion of hydrogen produces only water and minimal nitrogen oxides, making it an attractive alternative to fossil fuels in transportation. However, he also points out that the most economical method for large-scale hydrogen production is still steam methane reforming, which relies on natural gas and contributes significantly to hydrogen costs. Balat suggested that advances in renewable energy could eventually lower the cost of hydrogen produced through cleaner methods such as solar-powered electrolysis. Sun et al. [35] provided a critical assessment of hydrogen production via steam methane reforming (SMR) in the U.S., focusing on its environmental impacts. While hydrogen fuel cell vehicles (FCEVs) offer zero tailpipe emissions, the authors emphasize that the production of hydrogen through SMR is not emission-free. Their study quantifies the greenhouse gas (GHG) and criteria air pollutant (CAP) emissions associated with SMR facilities, highlighting the environmental trade-offs involved in hydrogen production. By developing national and state-level median values for emissions, Sun et al. [35] offered insights into the real-world environmental costs of hydrogen production and called for more transparency in reporting hydrogen production data. They concluded that while hydrogen can contribute to a clean energy future, its production methods must also be scrutinized for their environmental impacts.
Alves et al. (2013) [36] reviewed hydrogen production from biogas via various reforming methods. According to their results, steam reforming (SR) is the most efficient, yielding 60–70% hydrogen at 650–850 °C. Partial oxidation (POR) and autothermal reforming (ATR) offer different H2/CO ratios, while dry reforming (DR) is less favorable without further purification. The study also highlights fuel cell efficiencies, with PEMFCs operating at 40–60% and SOFCs reaching 50–60%. SOFCs allow direct biogas conversion but face challenges like catalyst deactivation. In 2008, global hydrogen demand was 409 billion m3, projected to rise by 18% by 2013. PEMFCs require high-purity hydrogen, demanding CO levels below 10 ppm. Biogas composition (55–70% CH4, 30–45% CO2, 500–4000 ppm H2S) influences the reforming and pretreatment choices. In another related research, Gopinath and Marimuthu (2022) [37] analyzed solar-powered hydrogen production. Their results showed that electrolysis, particularly PEM electrolysis, achieves 55–58% energy and exergy efficiency, while PV-integrated electrolysis drops to 1.24% and 0.70%, respectively. The Cu-Cl thermochemical cycle (550 °C) produces hydrogen at USD 2.17/kg with 45% efficiency, whereas ZnO/Zn and Fe3O4/FeO cycles, operating at higher temperatures, yield lower efficiencies and higher costs. Photolysis and biophotolysis show poor efficiency, with photocatalysis at 0.20% and 0.10% for energy and exergy, respectively. Solar PV systems produce 1356 kg/day of hydrogen at USD 10.49/kg, while solar thermal yields 1000 kg/day at a lower cost of USD 7.00/kg, with a higher capacity factor of 40% compared to 28% for PV.
Table 1 shows the comparison of the key aspects of hydrogen production technologies, properties, and values based on the provided literature review.

Table 1.
Comparison of the key aspects of hydrogen production technologies, properties, and values based on the literature review.
As hydrogen has emerged as a clean and versatile energy carrier, recent technological advancements have significantly enhanced hydrogen production efficiency and scalability, particularly from renewable sources like solar and biomass. For instance, Europe has prioritized integrating green hydrogen into industrial and transportation sectors through the European Hydrogen Strategy, which aims to install 40 GW of electrolyzer capacity by 2030 [38]. Similarly, the United States has adopted a technology-neutral approach through initiatives such as the U.S. Department of Energy’s Hydrogen Energy Earthshot program, targeting a production cost of USD 1 per kilogram by 2030 [39]. In contrast, China’s policies focus on the large-scale deployment and manufacturing of hydrogen-related technologies, supported by extensive infrastructure investments [40]. These regional approaches reflect the following varied priorities: Europe emphasizes policy-driven decarbonization, the U.S. prioritizes technological innovation and cost reduction, and China focuses on scaling production capabilities. Addressing these regional policy differences highlights the need for tailored strategies that align with local energy landscapes, socio-economic priorities, and technology readiness levels.
Based on the literature review, it is evident that hydrogen production policymaking across different regions has not been strongly modeled through conceptual frameworks. Additionally, there is a lack of comprehensive techno-economic analyses of renewable energy sources coupled with hydrogen fuel production. Moreover, the application of a Life Cycle Assessment (LCA) in analyzing transportation systems, specifically in relation to hydrogen fuel, has been addressed only rarely in case studies. In light of these gaps, the present study aims to achieve the following:
- Apply the Shlaer–Mellor method for the strategic analysis of hydrogen energy production in different regions, including Europe, the USA, and China.
- Conduct a techno-economic analysis of solar and biogas energy sources coupled with hydrogen production in the USA.
- Simulate air pollution emissions from different fuel resources in transportation systems, with a focus on hydrogen fuel.
- Provide managerial insights through foresight analysis regarding the application of hydrogen in transportation systems.
This approach seeks to address the above-mentioned gaps by integrating strategic, economic, and environmental assessments of hydrogen production and usage in transportation systems.
2. Methodology
According to Figure 2, first, the Shlaer–Mellor method is applied to assess hydrogen energy production [41] in the USA, Europe, and China. Next, a techno-economic evaluation is conducted on solar-biogas sources in the USA for hydrogen hydrolysis processes using statistical methods. Following this, a case study simulates the environmental and economic impacts of hydrogen fuel life cycles in the USA transportation sector. Finally, the Monte Carlo simulation method is employed to conduct a foresight study on hydrogen sources in USA transportation systems.

Figure 2.
Research roadmap of the present study.
Figure 3 presents the geographical distribution of the cases analyzed in this study, structured in a funnel diagram format. The study considers the following three primary regions: the European Union (EU), the United States (USA), and China, at the top level of the funnel. Within the USA, two specific states, California and Michigan, are highlighted as key case study locations. The diagram illustrates a stepwise approach, beginning with policymaking and strategy analysis at the broader regional level (EU, USA, and China). As the analysis narrows, the next stage involves a techno-economic analysis, focusing on California and Michigan. Finally, the funnel reaches its most specific level, where life cycle assessment (LCA) and Monte Carlo analysis are conducted for California. The use of dashed arrows indicates the transition of analytical focus from broader geopolitical entities to more localized studies within selected states.

Figure 3.
Geographical distribution of cases in this study.
The Shlaer–Mellor method is an object-oriented modeling technique that helps structure complex systems, particularly for policy and scenario analysis. It consists of the following three main steps: 1. Conceptual modeling, which identifies key entities (e.g., hydrogen production facilities, government policies, and market dynamics) and their interactions. 2. Behavioral modeling, which defines state transitions and interactions over time (e.g., policy changes affecting hydrogen adoption rates). 3. Simulation and validation, implementing scenarios to analyze long-term trends and policy impacts. The method is particularly suited for analyzing complex systems, focusing on cost, time, and environmental impact. Compared to other policy modeling frameworks, such as system dynamics modeling and agent-based modeling, the Shlaer–Mellor method offers distinct advantages. System dynamics modeling, widely used for energy policy, emphasizes feedback loops and dynamic behaviors but often lacks granularity in representing discrete components. Agent-based modeling, on the other hand, captures the interactions of individual entities within a system but can become computationally intensive and less practical for broad policy analysis. In contrast, the Shlaer–Mellor method’s object-oriented approach enables the detailed representation of system components while maintaining scalability and computational efficiency [42]. These features make it particularly effective for addressing hydrogen production’s techno-economic and environmental dimensions.
Figure 4 illustrates the cost of hydrogen production across the following three main categories: gray hydrogen, blue hydrogen, and green hydrogen. These can be defined as follows:

Figure 4.
Comparison of the cost differences among three types of hydrogen production [42].
- Gray hydrogen is produced from natural gas through steam methane reforming (SMR) without carbon capture, making it the most cost-effective but also the highest in carbon emissions.
- Blue hydrogen follows the same SMR process but incorporates carbon capture and storage (CCS) to reduce CO2 emissions, making it a lower-carbon alternative to gray hydrogen.
- Green hydrogen is generated via electrolysis using renewable energy sources such as solar and wind power. This method is completely carbon-free but remains the most expensive due to the high cost of renewable electricity and electrolyzer technology.
Figure 4 provides a clear comparison of the cost differences among these production methods, emphasizing the economic viability of renewable versus non-renewable hydrogen sources.
2.1. Shlaer–Mellor Method
This study utilizes the Shlaer–Mellor method, an Object-Oriented Analysis (OOA) approach, to model hydrogen production policies across different countries. The policy model P is defined as a function of key factors such as cost C(t), time τ, and environmental impact E (Equation (1)) [43].
where C(t) represents the cost as a function of time, τ is the duration required for policy implementation, and E quantifies the environmental impact, such as reductions in carbon emissions. The optimization process aims to minimize C(t) and E, while maximizing efficiency within the available timeframe τ [40]. The method applies differential analysis to evaluate the change in cost and environmental impact over time, using the following:
These expressions help identify the sensitivity of cost and environmental factors to policy changes. Additionally, comparisons between regions such as the USA, Europe, and China are modeled to assess differences in their investments and policy strategies, with the focus on hydrogen production and its applications. The final model aims to create a dynamic policy framework that adapts over time based on these factors [43].
2.2. Techno-Economic Analysis
This study performs a techno-economic assessment of hydrogen energy production in the USA, utilizing data from the National Renewable Energy Laboratory (NREL). The assessment focuses on the following two renewable resources: solar and biomass. Geographic Information System (GIS) analysis is applied to model hydrogen production across different regions, with hydrogen energy production per unit area (HEPUA) formulated as Equation (2). All computations are implemented in Excel 2016.
To evaluate the performance of solar and biomass resources, a comprehensive statistical analysis is conducted using the following parameters in Equations (3)–(8) [44].
where xi is the hydrogen production potential for each data point, and n is the total number of observations.
Representing the spread of hydrogen production potential values.
Showing the dispersion of hydrogen production potentials around the mean.
Measuring the asymmetry of hydrogen production potential distribution.
Indicating the “peakedness” of the distribution.
where z is the z-score that corresponds to the desired confidence level (e.g., 95%).
It is important to mention that the adoption of hydrogen technologies is influenced by more than just resource potential. Region-specific challenges, such as regulatory frameworks and infrastructure constraints, play a critical role. For instance, while Europe’s stringent regulatory environment encourages decarbonization, it also imposes high compliance costs that can slow the deployment of hydrogen infrastructure. In contrast, the USA faces significant gaps in hydrogen storage and distribution networks, despite supportive renewable energy policies. In China, state-led strategies have rapidly advanced hydrogen infrastructure, but they encounter challenges related to regional disparities in resource allocation and local air quality priorities.
2.3. Fuel Life-Cycle Environmental and Economic Transportation Simulation
This study uses the Alternative Fuel Life-Cycle Environmental and Economic Transportation tool (AFLEET) to evaluate the sustainability of various fuel types, including hydrogen, for transportation. The AFLEET tool [45] is a comprehensive analytical framework designed for evaluating the environmental and economic implications of alternative fuel vehicles (AFVs) and conventional internal combustion engine (ICE) vehicles. Developed by the Argonne National Laboratory, under the U.S. Department of Energy’s Clean Cities Coalition Network, AFLEET integrates LCA methodologies to quantify key performance metrics, including petroleum consumption, greenhouse gas (GHG) emissions, air pollutant emissions, and the total cost of ownership (TCO). Utilizing well-established databases such as the Greenhouse gases, Regulated Emissions, and Energy use in Transportation (GREET) model and the U.S. Environmental Protection Agency’s Motor Vehicle Emission Simulator (MOVES), AFLEET enables the scenario-based assessment of 18 fuel-vehicle technology combinations. The model incorporates modules such as the AFLEET Spreadsheet, AFLEET Online, the Heavy-Duty Vehicle Emissions Calculator (HDVEC), and the Charging and Fueling Infrastructure (CFI) Emissions Tool, each addressing specific aspects of vehicle emissions, energy consumption, and cost-effectiveness. By allowing users to input vehicle-specific operational parameters—such as fleet composition, fuel efficiency, vehicle mileage, and regional energy grid mix—the model generates comparative analyses of different transportation alternatives, offering insights into emission mitigation strategies, energy efficiency improvements, and economic feasibility. Furthermore, AFLEET employs a robust computational framework to assess policy-driven interventions, optimize fleet management decisions, and support regulatory compliance by quantifying the environmental benefits of alternative fuel adoption [46].
2.4. Monte Carlo Simulations
The Monte Carlo simulation methodology projects future emissions and market shares for hydrogen and gasoline vehicles from 2025 to 2050, using 10,000 simulations to account for uncertainty. The initial market shares are set at 5% for hydrogen and 95% for gasoline. Emissions are modeled based on the mean and standard deviation values as follows: hydrogen emissions decrease slightly, while gasoline emissions increase over time. Growth and decline rates are randomly sampled from normal distributions, with hydrogen growth set at 5% (±1%) per year and gasoline declining by 2% (±1%) annually. For each year, market shares are updated, and emissions are calculated based on these shares. The results, averaged over all simulations, show that hydrogen vehicles will capture around 30% of the market by 2050, with near-zero emissions. Gasoline market share declines to 60%, though emissions remain higher. The model provides foresight into the potential market transition, emphasizing hydrogen’s role in reducing transportation-related emissions [47]. All computations are executed in MATLAB 2019b [48] software.
3. Results and Discussions
To demonstrate the methodology for obtaining the results, the flowchart in Figure 5 outlines the computational process, encompassing the data inputs, modeling steps, Monte Carlo simulations, and result interpretation. Subsequently, a detailed step-by-step computation is presented to elaborate on each stage of the process.

Figure 5.
Schematic plan of results in this study.
3.1. Policymaking of Hydrogen Energy Production in Countries
In this section of the article, the policies of different countries, including China (Figure 6a), the USA (Figure 6b), and European countries (Figure 6c), for hydrogen production are evaluated. For the policymaking, the Shlaer–Mellor method is utilized for the first time [49]. The technique is a type of Object-Oriented Analysis (OOA) method [50]. During the modeling of the present investigation, the time, cost, and policies are modeled in the hydrogen production section.
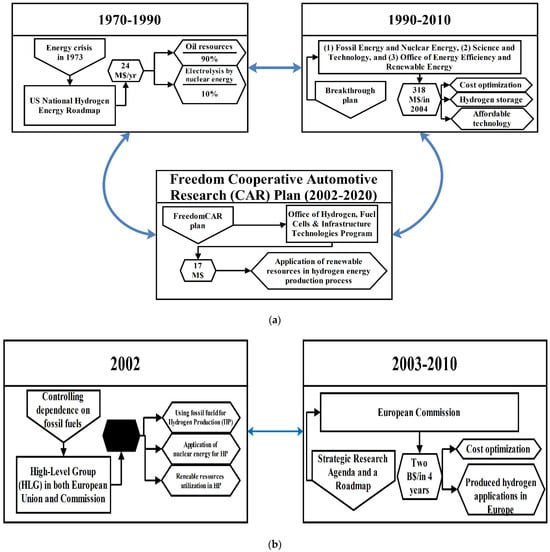

Figure 6.
Hydrogen energy production policies based on (a) the USA, (b) European Union, and (c) China, as per the Shlaer–Mellor method.
Considering the literature review [51,52,53,54] and using the Shlaer–Mellor method, a structure of the policies of the USA, the European Union, and China has been displayed according to Figure 6 (All financial values are in USD). From the comparison of Figure 6a,b, it is evident that the volume of invested expenses in the EU is much more than the USA, with an amount equal to USD 2 billion in a limited period of time. To better understand the created models, it is necessary to adequately grasp the concept of each figure. Referring to Figure 6a–c, it can be seen that the driving force for promoting hydrogen energy production in the USA, Europe, and China is related to the energy crisis, reducing dependence on fossil fuel in Middle East countries and preventing the increase in air pollution, respectively.
As per Figure 6a, it can be seen that in the USA, policies have been based on the use of fossil fuels as the raw material for hydrogen energy production. This is despite the fact that after several years of exploitation and development of the mentioned clean energy, approaches have changed and the volume of investments has increased more than tenfold in the second ten years. At the same time, in Europe, large investment has been made in the production of hydrogen energy from the beginning, and the focus has been on evaluating new applications of this renewable resource in society (Figure 6b). Finally, in China, the main investments were focused on technology development for using hydrogen energy in transportation systems (Figure 6c).
The Shlaer–Mellor method, as applied in Figure 6, provides a multi-layered policy modeling framework for hydrogen energy production, incorporating temporal evolution, cost optimization, and environmental impact analysis. Unlike traditional policy evaluation models, which often rely on static, deterministic approaches, the object-oriented structure of the Shlaer–Mellor method enables a dynamic and adaptive representation of policy shifts in response to technological advancements and socio-economic pressures. The model formalizes hydrogen policy as a function of investment dynamics, regulatory evolution, and market adaptation, allowing for a structured assessment of national strategies in the USA, the European Union, and China. One of the key contributions of this approach is its ability to differentiate between proactive and reactive policymaking, with the EU exemplifying a frontloaded investment model; the USA demonstrating an iterative, resource-adaptive approach; and China focusing on phased technological expansion within industrial and transportation sectors [55].
A deeper analysis of behavioral modeling reveals that policy trajectory in each region is not solely dictated by economic feasibility but also by the flexibility of regulatory mechanisms. In the USA (Figure 6a), early reliance on fossil fuel-derived hydrogen reflects an incremental transition strategy, where policy shifts are contingent on technological viability and private sector engagement. The exponential growth in investments over the second decade suggests that the USA follows a market-driven approach, where hydrogen adoption scales in tandem with cost reductions in electrolysis and fuel cell technologies. However, this model also highlights a structural vulnerability—the USA’s reliance on a gradual policy adaptation mechanism may lead to a delayed infrastructure deployment, potentially reducing its competitive edge against more aggressively investing economies. In contrast, the EU’s hydrogen policy (Figure 6b) follows a structured regulatory roadmap, wherein early-stage investments prioritize large-scale infrastructure development and regulatory standardization. The initial financial commitment significantly exceeds that of the USA, which positions the EU as a leader in hydrogen commercialization and industrial integration. The policy model suggests that this high upfront investment approach mitigates long-term economic uncertainty, ensuring that hydrogen production scales in a cost-efficient, well-regulated manner [56].
China’s hydrogen policy (Figure 6c) demonstrates a fundamentally different paradigm, emphasizing technology-first investment rather than immediate commercialization. The object-oriented modeling framework illustrates how China’s policy transitions are closely linked to industrial growth and transportation electrification, with an initial focus on fuel cell vehicle adoption before scaling broader hydrogen applications. Unlike the EU’s infrastructure-heavy investment model and the USA’s gradualist approach, China adopts a staged policy integration strategy, ensuring that technological breakthroughs drive economic feasibility before nationwide scaling. This highlights a policy resilience mechanism, where early-stage R&D funding minimizes future adoption barriers by ensuring that domestic production capacity is well-aligned with regulatory and infrastructural readiness. The comparative assessment underscores how China’s hydrogen roadmap is engineered for long-term sectoral dominance, leveraging state-controlled investments to reduce dependency on external energy sources [57].
Beyond the cost-time framework, the Shlaer–Mellor modeling approach reveals deeper structural implications for hydrogen energy transition strategies. By integrating behavioral state transitions, the model accounts for policy inertia and feedback loops, which are critical in long-term decision making under economic and technological uncertainties. For instance, the EU’s strong early-stage regulatory framework ensures that market confidence accelerates private sector adoption, whereas the USA’s iterative policy adjustments could face capital allocation inefficiencies due to fluctuating economic priorities. Meanwhile, China’s policy framework demonstrates an inherent adaptability, as investments scale proportionally to technological feasibility rather than political cycles. This distinction is vital for predicting policy sustainability—the EU’s centralized strategy ensures high regulatory compliance, but its rigid structure may slow down adjustments to emerging technologies, whereas China’s decentralized, phased approach fosters agility but risks over-reliance on government subsidies [58]. The Shlaer–Mellor method further enables a cross-regional policy synchronization analysis, revealing the degree of interdependence between market expansion and regulatory frameworks. The USA, while leading in technological innovation, may lag behind in infrastructure deployment [59].
In the following, as the operational level of policy implementation, two important experiences in the field of developing the use of hydrogen energy fuel in the states of California and Michigan, USA, are analyzed. Considering Figure 7, it can be concluded that, in the state of California, the main goal is to reduce the air pollution burden, and most applications of the aforementioned fuel consumption have emerged in the public and personal transportation system (Figure 7a) [50,60]. According to the reports, it can be seen that during the last 5 years, the release of 1,134,000 pounds of carbon dioxide gas has been prevented by this startup. At the same time, Michigan city’s approach is to create a link between green economy and sustainable fuel production, which can be permanently productive and encourage new approaches in this field, with the experiences in different examples confirming the correctness of this tactic (Figure 7b) [61,62].

Figure 7.
Hydrogen energy production policy based on the Shlaer–Mellor method in the states of (a) California and (b) Michigan.
3.2. Techno-Economic Assessment of Hydrogen Energy Production in USA
One of the most important aspects of achieving sustainable development in the production of hydrogen energy is related to the use of renewable resources as a system resource. At the same time, in this part of the study, the approaches of using renewable energy in the USA to produce hydrogen energy have been investigated. The data are gathered from the reports of the National Renewable Energy Laboratory (NREL) in the Energy section [63]. The conceptual assessment model of renewable energy applications for hydrogen energy production in the investigation is presented in Figure 8. In the present study, we evaluated the overall perspective of hydrogen production across various countries, with a specific focus on the USA. We subsequently analyzed the strategies employed in the following two case studies: California and Michigan. Following this, we studied energy provision based on renewable energy resources, focusing on a histogram analysis of biogas-based and solar-based hydrogen production in the USA. Figure 9a illustrates the distribution of hydrogen energy production from renewable resources across the country. Recognizing the importance of strategic planning in energy provision, we analyzed energy supply methods in the USA. Also, Figure 9b shows the projected global supply of clean hydrogen by technology from 2030 to 2050. Finally, as depicted in Figure 8 and Figure 9, we assessed the use of hydrogen fuel in the transportation sector—one of the key applications in California—using LCA analysis and software simulation. Moving forward, a foresight research is conducted to explore the potential future outcomes of the approved plan.

Figure 8.
Structure of the techno-economic assessment in the present study.

Figure 9.
Histogram diagram of hydrogen energy production potential data distribution based on (a) biomass and (b) solar resources.
The hydrogen energy production potential from solar and biomass resources (103 tons per year) are presented in Figure 9. The presented data are related to all counties of the USA based on geographical information system analysis, which can be seen in Figure 10a.

Figure 10.
Hydrogen energy production based on (a) the map of hydrogen production potential from renewable resources [64], and (b) the projected global supply of clean hydrogen by technology from 2030 to 2050; Deloitte, ID 1401926 [65].
As per Figure 10b, the Hydrogen Pathway Explorer (HyPE) model projects a significant increase in the global supply of green hydrogen from 2030 to 2050. By 2050, green hydrogen produced from solar energy is anticipated to reach the highest supply level of 373 million metric tons. In contrast, green hydrogen from wind energy is forecasted to supply 133 million metric tons by 2050. Meanwhile, blue hydrogen, produced from natural gas with carbon capture and storage, is expected to have a supply volume of 92 million metric tons in 2050, following a decline from its peak in 2040 [65].
Michigan’s approach to hydrogen strategies reflects its industrial heritage and economic goals, which are centered on diversifying energy sources and ensuring resilience. Figure 11a [66] highlights Michigan’s emphasis on cost-competitive energy generation technologies, including wind and nuclear, alongside advancements in hydrogen production. The state’s energy plan integrates hydrogen as a means to connect sustainable fuel production with economic productivity, particularly in manufacturing and transportation sectors. Michigan’s energy crisis mitigation strategy includes reducing dependence on coal and fossil fuels while leveraging hydrogen for industrial applications. Unlike California, Michigan’s focus extends to creating synergy between hydrogen adoption and green technology manufacturing, ensuring long-term sustainability. Investments in hydrogen are also seen as a pathway to position Michigan as a leader in clean energy technology, promoting job creation and industrial competitiveness.
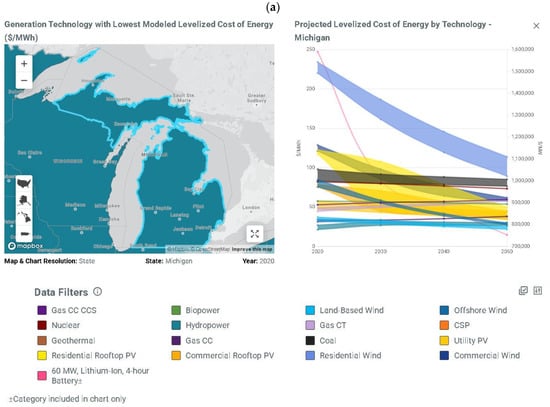

Figure 11.
Generation technology with lowest modeled Levelized Cost of Energy (LCOE) and projected LCOE trends by technology for (a) Michigan and (b) California.
California’s focus on hydrogen strategies aligns with its ambitious climate policies and commitment to reducing greenhouse gas emissions. The state has a high penetration of renewable energy, particularly solar and wind, as depicted in the Levelized Cost of Energy (LCOE) analysis in Figure 11b [66]. The projections show a downward trend in costs for renewable technologies, reinforcing the feasibility of hydrogen production from solar and wind power. California’s energy plan prioritizes mitigating air pollution, given its historical struggles with urban smog and high vehicular emissions. California’s hydrogen strategy also emphasizes infrastructure development, with significant investments in refueling stations and renewable-powered electrolyzers. The state views hydrogen as a solution to store excess solar and wind energy, addressing intermittency issues while promoting a green economy. This dual focus on environmental sustainability and energy innovation makes California a model for hydrogen adoption. In summary, the comparative analysis of these states’ hydrogen plans highlights their distinct approaches to crisis management, energy planning, and utilizing hydrogen’s potential. Michigan’s emphasis on industrial and economic transformations is complemented by California’s emphasis on energy storage and environmental effect, underscoring the many uses and advantages of hydrogen technologies.
According to Figure 10b, it can be seen that the volume of hydrogen production based on solar production significantly exceeds and will exceed form natural gas resources. Meanwhile, according to Table 2, it is clear that the Hydrogen Energy Production Used Area (HEPUA) (kg/yr/km2) factor of the solar system is more efficient than biomass resources. Therefore, from an economic aspect, the biomass system does not demonstrate considerable performance in comparison to the solar system. On average, 5.7 ton/yr/km2 of hydrogen energy is produced from the biomass system, while 704 ton/yr/km2 is produced from the solar system. This finding aligns with broader trends favoring solar energy for renewable hydrogen production, driven by its scalability and technological maturity.
Table 2.
Descriptive analysis of HEPUA based on biomass and solar renewable energies.
However, transitioning to solar-based hydrogen production presents cost-related challenges, particularly in emerging economies. While decreasing the cost of photovoltaic (PV) systems has improved the feasibility of solar hydrogen production, the high initial capital expenditure for PV installations, electrolyzers, and supporting infrastructure can be prohibitive for many regions. In emerging economies, additional barriers such as limited access to financing, grid instability, and inconsistent policy support exacerbate these challenges. Addressing these cost considerations requires targeted policy interventions, including subsidies, technology transfer programs, and international collaborations aimed at reducing upfront costs and accelerating adoption.
In the other aspect of this study, the average per capita production of hydrogen energy is computed as a social index. Considering Table 3, it can be understood that for each person, based on solar energy, more volume of hydrogen is produced compared to that from biomass sources. As a result, the level of social benefit in these two systems is not equal, and due to the high efficiency of the solar method, better conditions are created for the mentioned method. Finally, it can be concluded that from all technical, economic, and social points of view, hydrogen energy production using solar resources has higher efficiency and brings more development justifications.
Table 3.
Descriptive analysis of the social index of hydrogen energy production based on biomass and solar systems.
Following Table 2, increasing hydrogen production from biomass per unit area can be approached through a combination of optimizing cultivation, utilizing advanced technologies and integrating renewable energy sources. One of the primary methods is optimizing biomass cultivation. By selecting genetically modified or specially cultivated energy crops with higher growth rates and enhanced properties for hydrogen production, the biomass yield per area can be significantly increased. This includes using plant species with high cellulose content, which can be easily broken-down during conversion processes, maximizing the potential of the biomass feedstock [67].
Advanced gasification technologies also play a crucial role in enhancing hydrogen production from biomass. Gasification involves converting biomass into a syngas mixture primarily composed of hydrogen, carbon monoxide, and methane. By optimizing the gasification parameters such as temperature, pressure, and the type of gasifying agent (e.g., steam or oxygen), the efficiency of the conversion can be increased, leading to greater hydrogen yields. Additionally, other thermal conversion technologies like hydrothermal liquefaction and pyrolysis can also be leveraged. These processes break down biomass at high temperatures in the absence of oxygen, creating bio-oil that can subsequently be reformed to produce hydrogen [68].
Biological pathways are another promising approach. Using microbial and enzymatic processes, such as dark fermentation and photofermentation, can convert biomass into hydrogen. These methods rely on specific bacteria that break down organic materials to release hydrogen. Enhancing the efficiency of these microorganisms through genetic engineering or optimizing the fermentation conditions can further increase hydrogen yields. The integration of renewable energy is also a key aspect. Biomass-to-hydrogen production can be combined with electrolysis powered by renewable electricity—such as solar or wind energy—to produce additional hydrogen from water, further increasing the total hydrogen yield per cultivated area [69,70,71]. Moreover, Combined Heat and Power (CHP) systems can be integrated into the biomass conversion process. These systems utilize the heat generated during biomass conversion to produce electricity, which can then power electrolysis units, thus producing additional hydrogen. This integration helps maximize the efficiency of biomass resources. Additionally, utilizing CO2 by employing biological methanation techniques can also be repurposed to prioritize hydrogen production. Optimizing the biological pathways in this process to favor hydrogen accumulation instead of complete methanation would provide another route for enhancing hydrogen output [72]. By combining these different strategies, including advancements in reactor design, more efficient catalysts, and improved waste management, the hydrogen potential from biomass per unit area can be significantly increased. These integrated approaches ensure the more sustainable and efficient utilization of biomass, paving the way for an effective renewable hydrogen economy [73].
3.3. Sustainability Assessment and Hydrogen Energy Production in the USA
In the following, considering the Alternative Fuel Life-Cycle Environmental and Economic Transportation (AFLEET) tool as a sustainability assessment concept, the performance of different fuels in car driving is evaluated. For this goal, the state of California is selected as a sample, and the mileage of the passenger car is assumed equal to 12,400 annually. Likewise, during the simulation process, soy and low NOX engines are selected as the source of biodiesel and motor type. The complete specifications of the simulation based on fuel price and vehicle options are presented in Table 4 and Table 5.
Table 4.
Fuel prices during the simulation process.
Table 5.
Specifications of the fuel and car in the simulation process.
Looking at Figure 12a, it becomes clear that the Greenhouse Gas (GHG) emissions from hydrogen energy production in the USA are lower than the average emissions generated by fuel consumption from all energy sources. Therefore, in terms of the global warming effect, fuel cells have suitable conditions compared to other sources. But according to Figure 12b, it is evident that the annual consumption of petroleum resources for hydrogen production is the lowest compared to all the others. Therefore, it can be deduced that the greenhouse effect resulting from fuel cells is based on processes related to biomass and initial energy requirement for the process [74]. At the same time, among all fuel sources in the transportation system, FCV can be introduced as one of the cleanest sources.

Figure 12.
Outcomes of the passenger car fuel simulation based on (a) GHG emission and (b) Petroleum use. RD100—Renewable Diesel 100%; EREV—Extended Range Electric Vehicle; B100—Biodiesel 100%; FCV—Fuel Cell Vehicle; PHEV—Plug-in Hybrid Electric Vehicle; E85—Ethanol 85%; HEV—Hybrid Electric Vehicle; RD20—Renewable Diesel 20%; B20—Biodiesel 20%; CNG—Compressed Natural Gas; Diesel—conventional diesel; LPG—Liquefied Petroleum Gas; Gasoline—conventional gasoline.
As per Figure 13, it can be understood that hydrogen energy (FCV) consumption in the transportation system creates the lowest amount of CO, VOC, particle matter with less than 2.5 mm diameter (PM2.5), PM10, and NOX air pollution. According to Figure 13, it can be seen that the FCV is the greenest fuel resource. Therefore, the present research proved that this fuel resource can meet the Sustainable Development Goals (SDGs). Utilizing the AFLEET tool, the analysis rigorously evaluated hydrogen and other fuel types across greenhouse gas emissions, particulate matter (PM2.5 and PM10), and NOX emissions, showcasing hydrogen’s significant environmental advantages. Nevertheless, it is critical to consider the life cycle environmental impact of hydrogen production. Hydrogen production methods, particularly electrolysis powered by renewable energy, are often energy intensive. The study acknowledges these challenges and highlights potential solutions, such as improving electrolyzer efficiency, utilizing energy storage systems to stabilize renewable energy inputs, and optimizing production processes to reduce energy losses.

Figure 13.
Outcomes of the air pollution simulation based on car driving and different fuel resources.
According to the data achieved in the investigation, hydrogen energy production can be enhanced by the application of sensitizer in the presence of solar radiation. Based on Figure 12a, the process of hydrogen energy production emits a low amount of GHGs, mainly related to the required energy for the electrolysis process of H2 extraction and its purification. Meanwhile, through the application of sensitizers in the process of hydrogen energy production, the initial required energy is optimized, and therefore, GHG emission is prevented [75]. Finally, considering SDGs, the achievements of the present study meet some aspects of the SDGs—Good Health and Well-being [76], Affordable and Clean Energy [77], and Sustainable Cities and Communities [78].
For the validation of the results archived, the emissions of CO, VOC, PM10, PM2.5, and NOX are validated with the study of Qian and Li (2023) [79]. The results have demonstrated that the emission rank comparison between the present study and the mentioned study demonstrates strong overall consistency, particularly for CO, VOC, and NOX emissions, as described in Appendix A. According to Figure A1, both studies rank FCV-Liquid H2 as the cleanest option (rank 1), followed by LNG (or CNG) (rank 2), with Diesel as the highest emitter (rank 3). For PM2.5 and PM10 emissions, however, a slight discrepancy is observed. While Qian and Li [79] assign rank 2 to LNG (or CNG) and rank 3 to Diesel, the present study reverses these positions, ranking Diesel as 2 and LNG (or CNG) as 3. Despite this variation, FCV-Liquid H2 consistently maintains the lowest emission rank across all categories in both studies. This alignment in key emission trends validates the robustness of the present study, confirming its findings largely agree with the established literature while acknowledging minor differences in particulate matter assessments.
Regarding recent developments in the United States on hydrogen energy, it reflects a focused effort to integrate hydrogen into its energy transition strategy. The U.S. government has implemented comprehensive initiatives, primarily under the Bipartisan Infrastructure and Jobs Act (BIJA) and the Inflation Reduction Act (IRA). These acts collectively allocate billions of dollars toward clean hydrogen production, infrastructure, and technological innovation. The National Clean Hydrogen Strategy and Roadmap sets ambitious goals for achieving annual production levels of 10 million metric tons (MMT) by 2030, 20 MMT by 2040, and 50 MMT by 2050, with a strong emphasis on reducing production costs to USD 1/kg under the Hydrogen Shot initiative. State-level efforts complement federal actions. California leads with incentives for hydrogen fuel cell vehicles (FCEVs) and extensive hydrogen fueling infrastructure, supported by initiatives like the Zero Emission Vehicle (ZEV) mandate. Texas is leveraging its extensive natural gas infrastructure to develop blue hydrogen, supported by carbon capture and storage (CCS) technologies. New York is pioneering clean hydrogen integration into its decarbonization strategy, focusing on industrial and transportation applications. The U.S. Department of Energy (DOE) is fostering innovation through investments in research, development, and demonstration projects. Recent funding initiatives include USD 8 billion for regional clean hydrogen hubs and USD 1 billion for the Clean Hydrogen Electrolysis Program. These hubs aim to establish integrated networks connecting hydrogen producers, consumers, and infrastructure. The Shlaer–Mellor method provides a robust framework for analyzing these developments, enabling the dynamic modeling of policy impacts across the hydrogen value chain. It captures regional disparities, production cost dynamics, and technological adoption trends, offering stakeholders actionable insights [56].
In the European Union (EU), the hydrogen strategy is advancing significantly, aligned with the Green Deal’s objectives to achieve climate neutrality by 2050. Recent developments focus on green hydrogen production using renewable energy sources, particularly through electrolysis. The REPowerEU plan emphasizes energy independence and scaling hydrogen infrastructure to reduce reliance on fossil fuels. The EU Clean Hydrogen Alliance fosters collaboration to establish a competitive hydrogen market by increasing electrolyzer capacity and promoting hydrogen valleys, which integrate production, storage, and consumption locally. Key investments target hydrogen pipelines, storage facilities, and refueling stations to address both transport and industrial decarbonization needs. Hydrogen’s role as a storage medium for renewable energy strengthens energy security, especially during peak demand or supply disruptions. The European Parliament and Commission emphasize innovation in electrolyzer technology, safety protocols, and international standardization, aiming for a unified regulatory framework [80].
China has also made significant advancements in hydrogen energy development, focusing on green hydrogen production as a key strategy for decarbonizing its economy. The 14th Five-Year Plan and Vision 2035 outline hydrogen as a strategic industry, aiming to achieve carbon neutrality by 2060. Key initiatives include leveraging renewable energy sources like wind and solar to produce green hydrogen, with large-scale demonstration projects such as the Zhangjiakou facility producing 6000 tons of hydrogen annually by using wind power. The China Hydrogen Alliance projects hydrogen demand to reach 60 million tons by 2050, with 70% sourced from renewables. Recent data highlight the scaling-up of infrastructure, with hydrogen refueling stations expected to grow from 80 in 2020 to 1500–2000 by 2035. Fuel cell vehicles (FCEVs) are also prioritized, targeting 1 million units by 2030. Despite these efforts, challenges remain, including high costs (currently USD 3–7.5/kg for green hydrogen) and regulatory gaps. The Shlaer–Mellor method dynamically models these developments, ensuring strategies adapt to market and policy shifts while integrating regional production capacities into the hydrogen ecosystem [81].
As the last result, Figure 14 presents a foresight analysis of hydrogen and gasoline in transportation, using Monte Carlo simulations to project emissions and market shares from 2024 to 2050. In Figure 11a, the projected emissions for gasoline vehicles (red line) show a steady decline but remain significantly higher than those for hydrogen vehicles (green line), which consistently exhibit near-zero emissions. This highlights the production potential of hydrogen as a clean energy solution for reducing transportation-related emissions. Figure 14b illustrates the projected market share transition from gasoline to hydrogen vehicles. Gasoline vehicles dominate in 2024, with close to 90% market share, but they show a steady decline to around 60% by 2050. In contrast, hydrogen vehicles show gradual growth, reaching approximately 30% by 2050. This transition underscores the increasing adoption of hydrogen fuel technology in the transportation sector. The analysis demonstrates hydrogen’s potential for near-zero emissions, emphasizing its critical role in reducing greenhouse gas emissions within the transport sector. However, the transition to hydrogen-based transportation is contingent upon overcoming significant infrastructure challenges. A key barrier is the limited availability of hydrogen refueling stations, which constrains scalability and limits consumer adoption. For example, while some regions have begun pilot programs for refueling infrastructure, achieving the projected market penetration will require substantial investment in expanding these networks. Furthermore, the scalability of hydrogen production, particularly from renewable sources like solar and biomass, will require advancements in storage, distribution, and cost optimization technologies.
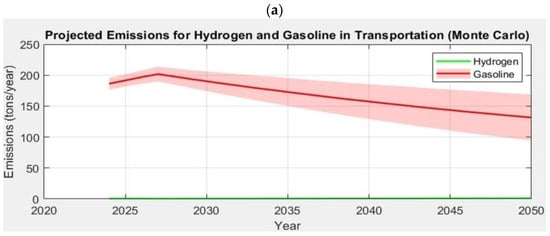

Figure 14.
Projected (a) emissions and (b) market share for hydrogen and gasoline vehicles in Monte Carlo.
The findings of this study strongly support the strategic promotion of solar-based hydrogen production and the adoption of hydrogen fuel cell vehicles (FCVs) as critical measures for reducing air pollution and mitigating climate change. To effectively implement these strategies, targeted recommendations for policymakers and industries are essential. Policymakers should prioritize investments in infrastructure development, such as hydrogen refueling stations and renewable energy-powered electrolyzers. Providing financial incentives, including subsidies and tax credits for solar-based hydrogen production, can accelerate adoption. Additionally, creating regulatory frameworks that standardize hydrogen storage and transport can address logistical challenges and promote international cooperation. For industries, investing in research and development to enhance the efficiency and scalability of hydrogen technologies is crucial. Collaborating with academic institutions and government agencies can foster innovation and cost reduction. Moreover, industries can focus on integrating green hydrogen into supply chains to align with global sustainability targets.
The LCA analysis presented in the AFLEET reports accounts for the emissions emitted in both scenarios, including vehicle operation and fuel production. While hydrogen fuel cell vehicles (HFCVs) themselves do not emit tailpipe emissions, the reports acknowledge that emissions are generated during hydrogen production, transportation, and vehicle manufacturing. The AFLEET tool integrates data from Argonne National Laboratory’s Greenhouse gases, Regulated Emissions, and Energy use in Technologies (GREET) model, which includes the upstream emissions of various fuels, including hydrogen, electricity, and conventional fossil fuels. This ensures a more comprehensive evaluation of environmental impacts beyond just tailpipe emissions. Additionally, AFLEET accounts for the cost and emissions associated with infrastructure development and vehicle life cycle, reflecting a more holistic environmental footprint [82,83,84,85,86].
The discussion can be extended to address region-specific challenges and regulatory frameworks for hydrogen deployment, emphasizing the distinct barriers encountered by developed and emerging economies. These include issues such as regulatory standardization, funding constraints, and infrastructure limitations, which significantly influence the pace of hydrogen adoption. The analyzed topics in this research, although yielding useful insights, remain diverse and multidimensional, posing unresolved concerns for further investigation. Key areas for exploration and future research include strategies for harmonizing region-specific policies to accelerate global hydrogen adoption, optimizing energy efficiency in hydrogen production processes across diverse contexts, and developing hybrid modeling approaches to enhance the robustness and applicability of hydrogen energy policies. These considerations highlight the necessity of continued investigation to address the evolving challenges of sustainable hydrogen integration.
Based on the IEA report [87], the predictions for global hydrogen demand beyond 2050 indicate a transformative shift in its role as a clean energy carrier, with hydrogen playing an increasingly critical role in decarbonizing multiple sectors. According to the Sustainable Development Scenario (SDS), hydrogen demand is projected to increase sevenfold by 2070, reaching approximately 520 Mt annually compared to 75 Mt in 2019. This growth will be primarily driven by the use of low-carbon hydrogen to support energy transition goals [87].
By 2070, hydrogen and hydrogen-based fuels are expected to meet 13% of all final energy needs, up from just 1% in 2019. The most significant sectors contributing to this growth include transportation, industry, power, and buildings. Specifically, the transportation sector is predicted to account for 70% of hydrogen use by 2070. This sector encompasses road transport, aviation, and shipping, with hydrogen serving as a critical fuel for decarbonizing these modes of transport. Notably, hydrogen and fuel cells are expected to become a dominant energy carrier for vehicles, especially heavy-freight trucks. By 2070, approximately 50% of all heavy-freight trucks and 25% of medium-freight trucks are anticipated to be powered by hydrogen fuel cells. Additionally, hydrogen-based synthetic kerosene are expected to provide 20% of aviation fuel, while ammonia derived from hydrogen is expected to cover 50% of the global shipping fuel demand. Hydrogen’s role in industry is also projected to expand significantly. By 2070, it is projected to account for 20% of energy use in industrial applications, driven by its use as a reducing agent in steel production and as a feedstock in the chemical industry for producing ammonia and methanol. Electrolytic hydrogen-based direct reduction technology is expected to contribute to more than a quarter of global steel production, while hydrogen is estimated to support 15% of the final energy demand in the iron and steel sector [87].
In the power sector, hydrogen is forecasted to account for nearly 15% of use by 2070, supporting flexible electricity generation to complement variable renewable energy sources. In the buildings sector, hydrogen is expected to account for 5% of energy use, primarily for space and water heating. The overall projections demonstrate that hydrogen is expected become one of the most utilized energy carriers by 2070, especially in transport and industrial applications. However, the transition will likely accelerate after 2050, as advancements in hydrogen production technologies, infrastructure, and policy support enhance its competitiveness and scalability. The shift from fossil fuel-based hydrogen to low-carbon hydrogen, particularly from renewable electricity, will be crucial to meeting these targets [73]. By 2070, hydrogen and hydrogen-based fuels promised to be the cornerstone for achieving deep decarbonization across multiple sectors, particularly as the transportation sector transitions to hydrogen for decarbonizing shipping, aviation, and road transport.
And lastly, as a brief discussion on the LCA of battery-electric vehicles (BEVs) and hydrogen fuel cell vehicles (HFCVs), we can mention the research presented by Wong et al. (2021) [88], which discusses valuable points about their environmental impacts. The study utilizes the GREET model to quantify emissions across the fuel cycle, with a focus on the Tesla Model 3 (BEV) and the Toyota Mirai (HFCV). A key finding from the assessment is that well-to-tank (WTT) emissions for hydrogen production vary significantly depending on the energy source. Hydrogen produced via natural gas reforming emits approximately 70.7 kg CO2 per 5 kg of hydrogen, whereas renewable electrolysis drastically reduces emissions to 11.9 kg CO2. In comparison, gasoline production for internal combustion engine vehicles (ICEVs) results in 35.7 kg CO2, while electricity generation for BEVs leads to 20.8 kg CO2. These results indicate that when hydrogen is sourced from natural gas, its production emissions are substantially higher than those of BEVs, but with renewable hydrogen, HFCVs can achieve the lowest overall emissions [88].
Tank-to-wheel (TTW) emissions, which account for direct emissions during vehicle operation, highlight a significant advantage for HFCVs. While both the Toyota Mirai and Tesla Model 3 produce zero direct emissions, BEVs still contribute indirect emissions from electricity generation, averaging 101 kg CO2 per 5 kg hydrogen equivalent energy consumption. In contrast, gasoline-powered ICEVs emit 202.3 kg CO2 in the same usage scenario. When evaluating the total well-to-wheel (WTW) emissions, which include both fuel production and vehicle operation, HFCVs using green hydrogen emerge as the most environmentally friendly option, generating just 11.9 kg CO2. However, if hydrogen is derived from natural gas, total emissions reach 70.7 kg CO2, making BEVs the superior choice in such cases. We can say that this comprehensive study by Wong et al. [88] shows the importance of energy policy and infrastructure development in determining the environmental feasibility of HFCVs. While BEVs currently offer lower emissions than HFCVs relying on natural gas-derived hydrogen, the widespread adoption of green hydrogen could make HFCVs the cleanest transportation alternative. Countries investing in renewable hydrogen strategies, such as Germany, Japan, and South Korea, are better positioned to integrate HFCVs into their transportation sectors. Therefore, the choice between BEVs and HFCVs is highly dependent on the availability of clean electricity and hydrogen production methods. A transition to fully renewable hydrogen production would enable HFCVs to surpass BEVs in terms of environmental sustainability, making them a promising solution for a carbon-neutral transportation future.
3.4. Practical Barriers to Hydrogen Adoption and Study Limitations
The successful adoption of hydrogen as a sustainable energy source for transportation relies on overcoming several practical barriers. Infrastructure remains one of the most significant challenges, as the establishment of hydrogen refueling stations requires substantial initial investment and careful planning to ensure accessibility and scalability. Regions transitioning to hydrogen must also address the high costs associated with renewable hydrogen production technologies, particularly in developing economies.
Moreover, hydrogen production is inherently energy intensive, raising concerns about its life cycle environmental impact, especially when non-renewable energy sources are involved. To mitigate this, governments and industries should collaborate to integrate renewable energy into the hydrogen production process, optimize electrolyzer efficiency, and scale up production to achieve economies of scale. A thorough LCA framework tailored to regional contexts is essential to evaluate and minimize the environmental trade-offs of hydrogen production and use.
The present study also has certain limitations that should be acknowledged. One key limitation is the reliance on projected data and assumptions in the Monte Carlo simulation, which, while robust, introduces inherent uncertainties in the long-term predictions of hydrogen adoption and emission reductions. Additionally, the study does not include a full life cycle assessment for all hydrogen production methods, which would provide a more comprehensive understanding of the environmental impacts associated with each pathway. Another limitation is the lack of granular regional analysis within the USA, Europe, and China, as the study primarily focuses on broader trends rather than specific subnational variations in hydrogen production potential and policy frameworks. Furthermore, the analysis does not account for economic externalities such as job creation, geopolitical considerations, and broader socio-economic impacts, which could influence the overall cost-effectiveness and feasibility of hydrogen adoption in the transportation sector.
4. Conclusions
This study underscores the pivotal role of hydrogen energy in sustainable transportation planning, particularly its potential to reduce air pollution and advance clean energy strategies. Hydrogen fuel cell vehicles (FCVs) were shown to produce the lowest levels of harmful emissions, such as CO, NOX, VOCs, and particulate matter (PM2.5 and PM10), compared to conventional fuels like gasoline and diesel. This positions hydrogen as one of the cleanest energy sources for transportation, offering significant environmental benefits and supporting the shift toward decarbonized mobility systems. Moreover, the techno-economic analysis revealed that solar-based hydrogen production, with an output of 704,322 kg/yr/km2, is substantially more efficient than biomass-based production, which yields only 5687 kg/yr/km2. These findings highlight the critical importance of integrating hydrogen energy into sustainable transportation planning to improve air quality and ensure environmental sustainability.
Future research and policy efforts should address the remaining challenges to accelerate the adoption of hydrogen in sustainable transportation systems. Key areas include reducing the costs associated with hydrogen production, storage, and distribution; scaling up infrastructure for hydrogen refueling networks; and integrating hydrogen energy systems with renewable energy sources, such as wind and solar. Advanced production technologies, such as photoelectrochemical water splitting and thermochemical cycles, should also be explored to enhance efficiency and sustainability.
Policymakers must prioritize incentive mechanisms to encourage the adoption of hydrogen-based solutions in both the transportation and industrial sectors. Interdisciplinary approaches combining policy modeling, life cycle assessment, and real-time data analytics are recommended to ensure comprehensive planning and actionable insights. By fostering innovation and international collaboration, future strategies can effectively address economic and environmental challenges, establishing hydrogen as a cornerstone of sustainable and zero-emission transportation systems.
Author Contributions
Methodology, M.G. (Mohammadamin Ganji) and M.G. (Mohammad Gheibi); software, M.G. (Mohammad Gheibi); resources, A.A.; data curation, K.D. and R.M.; writing—original draft, M.G. (Mohammadamin Ganji), M.G. (Mohammad Gheibi) and R.M.; writing—review and editing, S.A., A.A., S.V. and K.D.; visualization, R.M., S.A. and S.V.; supervision, M.G. (Mohammad Gheibi) and R.M. All authors have read and agreed to the published version of the manuscript.
Funding
The author would like to thank the Czech Republic’s Ministry of Education, Youth, and Sports for the Research Infrastructure NanoEnviCz, under Project No. LM2023066.
Data Availability Statement
The original contributions presented in the study are included in the article; further inquiries can be directed to the corresponding author.
Conflicts of Interest
The authors declare no conflicts of interest.
Appendix A
Figure A1 presents a comparative validation of emission ranks between the present study and the findings of Qian and Li (2023) [79] across the following five key pollutant categories: carbon monoxide (CO), volatile organic compounds (VOC), particulate matter less than 2.5 micrometers (PM2.5), particulate matter less than 10 micrometers (PM10), and nitrogen oxides (NOX). To ensure a fair comparison, all emission data in both studies have been converted to a unified unit of milligrams per kilometer (mg/km), and the fuel type “CNG” in the present study is correspondingly treated as equivalent to “LNG” in Qian and Li’s analysis.
In Figure A1a, both studies consistently rank FCV-Liquid H2 as the cleanest fuel option for CO emissions (rank 1), followed by LNG/CNG (rank 2) and Diesel (rank 3). This alignment highlights the minimal CO emission profile of hydrogen fuel cell vehicles.
Figure A1b similarly demonstrates full agreement in the ranking of VOC emissions, with FCV-Liquid H2 performing the best (rank 1), LNG/CNG being in the middle (rank 2), and Diesel again ranking the highest in emissions (rank 3) in both studies. These consistent results validate the reliability of the present study in assessing volatile organic compound impacts.
In contrast, Figure A1c reveals a minor discrepancy for PM2.5 emissions. While both studies agree that FCV-Liquid H2 is the cleanest option (rank 1), Qian and Li (2023) [79] rank LNG/CNG as cleaner than Diesel (ranks 2 and 3, respectively), whereas the present study reverses this order, assigning rank 2 to Diesel and rank 3 to LNG/CNG. This inversion may stem from variations in system boundaries, engine efficiency assumptions, or regional emission factor datasets used in each study.
A similar divergence is observed in Figure A1d, which addresses PM10 emissions. Again, both studies agree on the superior performance of FCV-Liquid H2 (Rank 1), but they differ in the order of LNG/CNG and Diesel. Qian and Li (2023) [79] rank LNG/CNG as less polluting (rank 2), while the present study ranks Diesel in this position. These inconsistencies suggest that the particulate emission profiles of alternative fuels are sensitive to methodological choices and may vary based on context-specific variables.
Finally, Figure A1e demonstrates the complete consistency for NOX emissions, where both studies uniformly rank FCV-Liquid H2 as the cleanest (rank 1), LNG/CNG as intermediate (rank 2), and Diesel as the most polluting (rank 3). This agreement confirms the robustness of the NOX emission estimations and supports the role of hydrogen fuel cell vehicles in minimizing nitrogen-based pollutants.
As a result, the comparative analysis shown in Figure A1 validates the present study’s emission ranking results across most categories, particularly for CO, VOC, and NOX, which are in full alignment with the findings of Qian and Li (2023) [79]. The minor deviations observed for PM2.5 and PM10 do not undermine the broader conclusion that FCV-Liquid H2 remains the most environmentally favorable option among the three fuel types assessed. These findings reinforce the credibility and generalizability of the present study’s emission impact assessments.
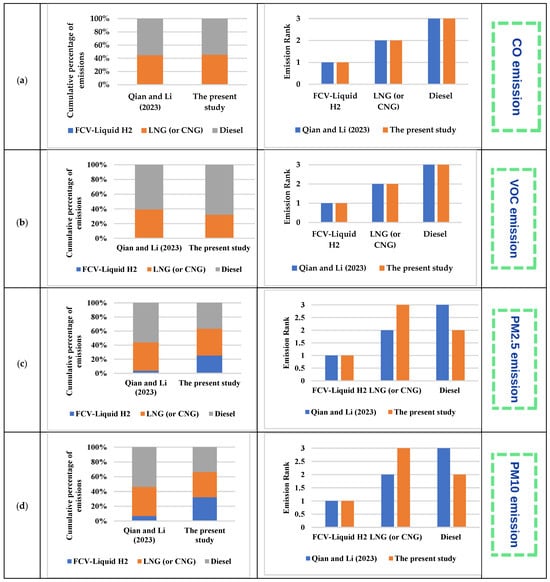

Figure A1.
Comparison of emission values and their rankings in this study and Qian and Li (2023) [79] (a–e) for different emission types accordingly.
References
- Pereira, J.; Souza, R.; Oliveira, J.; Moita, A. Hydrogen Production, Transporting and Storage Processes—A Brief Review. Clean Technol. 2024, 6, 1260–1313. [Google Scholar] [CrossRef]
- Stenina, I.; Yaroslavtsev, A. Modern Technologies of Hydrogen Production. Processes 2022, 11, 56. [Google Scholar] [CrossRef]
- Wawrzyńczak, A.; Feliczak-Guzik, A. Hydrogen Production Using Modern Photocatalysts. Coatings 2024, 14, 366. [Google Scholar] [CrossRef]
- Dawood, F.; Anda, M.; Shafiullah, G.M. Hydrogen Production for Energy: An Overview. Int. J. Hydrogen Energy 2020, 45, 3847–3869. [Google Scholar] [CrossRef]
- Dorel, S.; Lucian, M.; Gheorghe, L.; Cristian, L.G. Green Hydrogen, a Solution for Replacing Fossil Fuels to Reduce CO2 Emissions. Processes 2024, 12, 1651. [Google Scholar] [CrossRef]
- Bresa, Q.; Kovač, A.; Marciuš, D. Introduction of Hydrogen in the Kosovo Transportation Sector. Energies 2022, 15, 7275. [Google Scholar] [CrossRef]
- Yan, X.; Zheng, W.; Wei, Y.; Yan, Z. Current Status and Economic Analysis of Green Hydrogen Energy Industry Chain. Processes 2024, 12, 315. [Google Scholar] [CrossRef]
- Nikolaidis, P.; Poullikkas, A. A Comparative Overview of Hydrogen Production Processes. Renew. Sustain. Energy Rev. 2017, 67, 597–611. [Google Scholar] [CrossRef]
- Kayfeci, M.; Keçebaş, A.; Bayat, M. Hydrogen Production. In Solar Hydrogen Production; Elsevier: Amsterdam, The Netherlands, 2019; pp. 45–83. ISBN 9780128148532. [Google Scholar]
- Turner, J.; Sverdrup, G.; Mann, M.K.; Maness, P.-C.; Kroposki, B.; Ghirardi, M.; Evans, R.J.; Blake, D. Renewable Hydrogen Production. Int. J. Energy Res. 2008, 32, 379–407. [Google Scholar] [CrossRef]
- Singh, S.B.; De, M. Scope of Doped Mesoporous (<10 Nm) Surfactant-modified Alumina Templated Carbons for Hydrogen Storage Applications. Int. J. Energy Res. 2019, 43, 4264–4280. [Google Scholar] [CrossRef]
- Singh, S.B.; De, M. Thermally Exfoliated Graphene Oxide for Hydrogen Storage. Mater. Chem. Phys. 2020, 239, 122102. [Google Scholar] [CrossRef]
- Statista Research Department. Global Clean Hydrogen Volume Announced by Region 2030; Statista Research Department: Hamburg, Germany, 2024. [Google Scholar]
- Włodarczyk, R.; Kaleja, P. Modern Hydrogen Technologies in the Face of Climate Change—Analysis of Strategy and Development in Polish Conditions. Sustainability 2023, 15, 12891. [Google Scholar] [CrossRef]
- Kurc, B.; Gross, X.; Szymlet, N.; Rymaniak, Ł.; Woźniak, K.; Pigłowska, M. Hydrogen-Powered Vehicles: A Paradigm Shift in Sustainable Transportation. Energies 2024, 17, 4768. [Google Scholar] [CrossRef]
- Shahabuddin, M.; Rhamdhani, M.A.; Brooks, G.A. Technoeconomic Analysis for Green Hydrogen in Terms of Production, Compression, Transportation and Storage Considering the Australian Perspective. Processes 2023, 11, 2196. [Google Scholar] [CrossRef]
- Revinova, S.; Lazanyuk, I.; Gabrielyan, B.; Shahinyan, T.; Hakobyan, Y. Hydrogen in Energy Transition: The Problem of Economic Efficiency, Environmental Safety, and Technological Readiness of Transportation and Storage. Resources 2024, 13, 92. [Google Scholar] [CrossRef]
- Adaikalam, K.; Vikraman, D.; Karuppasamy, K.; Kim, H.-S. Solar Hydrogen Production and Storage in Solid Form: Prospects for Materials and Methods. Nanomaterials 2024, 14, 1560. [Google Scholar] [CrossRef]
- Knight, M.; Blanco-Davis, E.; Platt, O.; Armin, M. Life-Cycle and Applicational Analysis of Hydrogen Production and Powered Inland Marine Vessels. J. Mar. Sci. Eng. 2023, 11, 1611. [Google Scholar] [CrossRef]
- Oliveira, L.G.; Do Nascimento, C.T.; Cazula, B.B.; Tait, A.; De Oliveira, C.D.J.; Souza, G.E.Q.; Gasparrini, L.J.; Alencar, Á.D.O.; Ritter, G.; Jorge, N.N.; et al. Nickel-Stage Addition in Si-MCM-41 Synthesis for Renewable Hydrogen Production. Processes 2024, 12, 1836. [Google Scholar] [CrossRef]
- Pompodakis, E.E.; Orfanoudakis, G.I.; Katsigiannis, Y.A.; Karapidakis, E.S. Hydrogen Production from Wave Power Farms to Refuel Hydrogen-Powered Ships in the Mediterranean Sea. Hydrogen 2024, 5, 494–518. [Google Scholar] [CrossRef]
- Liu, Z.; Liu, Y. Research on the Stability of Salt Cavern Hydrogen Storage and Natural Gas Storage under Long-Term Storage Conditions. Processes 2024, 12, 2080. [Google Scholar] [CrossRef]
- Macingwane, Z.; Schönborn, A. Techno-Economic Analysis of Green Hydrogen Production as Maritime Fuel from Wave Energy. Energies 2024, 17, 4683. [Google Scholar] [CrossRef]
- Lei, J.; Zhang, H.; Pan, J.; Zhuo, Y.; Chen, A.; Chen, W.; Yang, Z.; Feng, K.; Li, L.; Wang, B.; et al. Techno-Economic Assessment of a Full-Chain Hydrogen Production by Offshore Wind Power. Energies 2024, 17, 2447. [Google Scholar] [CrossRef]
- Godini, H.R.; Huy, N.D.; Ramponi, L.; Son, N.X.; Mokhtarani, B.; Repke, J.-U.; Penteado, A.; Manzolini, G.; Orjuela, A.; Gallucci, F. Techno-Economic Analysis of Ethylene Adsorptive Separation Using Zeolite 13X in Oxidative Coupling of Methane Integrated Process. Processes 2024, 12, 1759. [Google Scholar] [CrossRef]
- Stecuła, K.; Olczak, P.; Kamiński, P.; Matuszewska, D.; Duong Duc, H. Towards Sustainable Transport: Techno-Economic Analysis of Investing in Hydrogen Buses in Public Transport in the Selected City of Poland. Energies 2022, 15, 9456. [Google Scholar] [CrossRef]
- Ghasemi, A.; Nikafshan Rad, H.; Akrami, M. Biomass-to-Green Hydrogen: A Review of Techno-Economic-Enviro Assessment of Various Production Methods. Hydrogen 2024, 5, 474–493. [Google Scholar] [CrossRef]
- Fakhreddine, O.; Gharbia, Y.; Derakhshandeh, J.F.; Amer, A.M. Challenges and Solutions of Hydrogen Fuel Cells in Transportation Systems: A Review and Prospects. World Electr. Veh. J. 2023, 14, 156. [Google Scholar] [CrossRef]
- Xu, Z.; Zhao, N.; Hillmansen, S.; Roberts, C.; Yan, Y. Techno-Economic Analysis of Hydrogen Storage Technologies for Railway Engineering: A Review. Energies 2022, 15, 6467. [Google Scholar] [CrossRef]
- Muñoz Díaz, M.T.; Chávez Oróstica, H.; Guajardo, J. Economic Analysis: Green Hydrogen Production Systems. Processes 2023, 11, 1390. [Google Scholar] [CrossRef]
- Granovskii, M.; Dincer, I.; Rosen, M.A. Environmental and Economic Aspects of Hydrogen Production and Utilization in Fuel Cell Vehicles. J. Power Sources 2006, 157, 411–421. [Google Scholar] [CrossRef]
- Aminov, R.Z.; Bairamov, A.N.; Filippov, S.P. Comprehensive Assessment of the Effectiveness of the Hydrogen Production and Transportation System. Int. J. Hydrogen Energy 2024, 86, 1358–1375. [Google Scholar] [CrossRef]
- Qureshi, F.; Yusuf, M.; Arham Khan, M.; Ibrahim, H.; Ekeoma, B.C.; Kamyab, H.; Rahman, M.M.; Nadda, A.K.; Chelliapan, S. A State-of-The-Art Review on the Latest Trends in Hydrogen Production, Storage, and Transportation Techniques. Fuel 2023, 340, 127574. [Google Scholar] [CrossRef]
- Balat, M. Potential Importance of Hydrogen as a Future Solution to Environmental and Transportation Problems. Int. J. Hydrogen Energy 2008, 33, 4013–4029. [Google Scholar] [CrossRef]
- Sun, P.; Young, B.; Elgowainy, A.; Lu, Z.; Wang, M.; Morelli, B.; Hawkins, T. Criteria Air Pollutants and Greenhouse Gas Emissions from Hydrogen Production in U.S. Steam Methane Reforming Facilities. Environ. Sci. Technol. 2019, 53, 7103–7113. [Google Scholar] [CrossRef]
- Alves, H.J.; Junior, C.B.; Niklevicz, R.R.; Frigo, E.P.; Frigo, M.S.; Coimbra-Araújo, C.H. Overview of hydrogen production technologies from biogas and the applications in fuel cells. Int. J. Hydrogen Energy 2013, 38, 5215–5225. [Google Scholar] [CrossRef]
- Gopinath, M.; Marimuthu, R. A review on solar energy-based indirect water-splitting methods for hydrogen generation. Int. J. Hydrog. Energy 2022, 47, 37742–37759. [Google Scholar] [CrossRef]
- Tatarewicz, I.; Skwierz, S.; Lewarski, M.; Jeszke, R.; Pyrka, M.; Sekuła, M. Mapping the Future of Green Hydrogen: Integrated Analysis of Poland and the EU’s Development Pathways to 2050. Energies 2023, 16, 6261. [Google Scholar] [CrossRef]
- Marzouk, O.A. 2030 Ambitions for Hydrogen, Clean Hydrogen, and Green Hydrogen. Eng. Proc. 2023, 56, 14. [Google Scholar] [CrossRef]
- Yang, L.; Wang, S.; Zhang, Z.; Lin, K.; Zheng, M. Current Development Status, Policy Support and Promotion Path of China’s Green Hydrogen Industries under the Target of Carbon Emission Peaking and Carbon Neutrality. Sustainability 2023, 15, 10118. [Google Scholar] [CrossRef]
- Gheibi, M.; Khaleghiabbasabadi, M.; Wacławek, S.; Černík, M. Policy-Making of Hydrogen Energy Production in Countries with the Application of the Shlaer—Mellor Technique. In Proceedings of the Hydrogen Days 2023, Prague, Czech Republic, 29–31 March 2023. [Google Scholar]
- Zemite, L.; Backurs, A.; Starikovs, A.; Laizans, A.; Jansons, L.; Vempere, L.; Bode, I.; Broks, A. A Comprehensive Overview of the Europen and Baltic Landscape for Hydrogen Applications and Innovations. Latv. J. Phys. Tech. Sci. Sciendo 2023, 60, 33. [Google Scholar] [CrossRef]
- Wieringa, R.J.; Saake, G. Formal Analysis of the Shlaer-Mellor Method: Towards a Toolkit of Formal and Informal Requirements Specification Techniques. Requir. Eng. 1996, 1, 106–131. [Google Scholar] [CrossRef]
- Tang, N.; Lee, S.-M. (Eds.) Statistical Methods in Data Science and Applications; MDPI: Basel, Switzerland, 2024; ISBN 9783725807482/9783725807475. [Google Scholar]
- Burnham, A. Alternative Fuel Life-Cycle Environmental and Economic Transportation (AFLEET) Tool 2016; Argonne National Laboratory: Lemont, IL, USA, 2016. [Google Scholar]
- Available online: https://afdc.energy.gov/ (accessed on 17 February 2025).
- Prakash, A.; Jha, S.K.; Prasad Mohanty, R. Scenario Planning for Service Quality: A Monte Carlo Simulation Study. J. Strategy Manag. 2012, 5, 331–352. [Google Scholar] [CrossRef]
- MATLAB. 9.7.0.1190202 (R2019b); The MathWorks Inc.: Natick, MA, USA, 2018. [Google Scholar]
- Gripsborn, C. Multitrådad Schemaläggning avxtUML Modeller: Utfört på Saab Dynamics. 2022. Available online: https://www.diva-portal.org/smash/get/diva2:1689748/FULLTEXT01.pdf (accessed on 17 February 2025).
- Volkov, V.; Loboda, Y. Object Information Models of Complicated Systems in Control Problems. In Proceedings of the ISIT 2021: II International Scientific and Practical Conference Intellectual Systems and Information Technologies, Odesa, Ukraine, 13–19 September 2021; 2021; pp. 137–142. Available online: https://ceur-ws.org/Vol-3126/paper20.pdf (accessed on 17 February 2025).
- Solomon, B.D.; Banerjee, A. A Global Survey of Hydrogen Energy Research, Development and Policy. Energy Policy 2006, 34, 781–792. [Google Scholar] [CrossRef]
- Liu, J.; Chen, T.; Hu, B. Consumer Acceptance under Hydrogen Energy Promotion Policy: Evidence from Yangtze River Delta. Int. J. Hydrogen Energy 2023, 48, 11104–11112. [Google Scholar] [CrossRef]
- Bednarczyk, J.L.; Brzozowska-Rup, K.; Luściński, S. Opportunities and Limitations of Hydrogen Energy in Poland against the Background of the European Union Energy Policy. Energies 2022, 15, 5503. [Google Scholar] [CrossRef]
- Gnann, T.; Speth, D.; Krail, M.; Wietschel, M.; Oberle, S. Pathways to Carbon-Free Transport in Germany until 2050. World Electr. Veh. J. 2022, 13, 136. [Google Scholar] [CrossRef]
- Pinto, M.C. Opportunities and Challenges of Green Hydrogen in the Energy Transition Framework: Analysis of Potential Cross-Border Cooperations Through a Multi-Dimensional Approach. Ph.D. Thesis, Politecnico di Torino, Turin, Italy, 2024. [Google Scholar]
- Bade, S.O.; Tomomewo, O.S. A review of governance strategies, policy measures, and regulatory framework for hydrogen energy in the United States. Int. J. Hydrogen Energy 2024, 78, 1363–1381. [Google Scholar] [CrossRef]
- Chai, S.; Zhang, G.; Li, G.; Zhang, Y. Industrial hydrogen production technology and development status in China: A review. Clean Technol. Environ. Policy 2021, 23, 1931–1946. [Google Scholar] [CrossRef]
- Bleischwitz, R.; Bader, N. Policies for the transition towards a hydrogen economy: The EU case. Energy Policy 2010, 38, 5388–5398. [Google Scholar] [CrossRef]
- Benalcazar, P.; Komorowska, A. Techno-economic analysis and uncertainty assessment of green hydrogen production in future exporting countries. Renew. Sustain. Energy Rev. 2024, 199, 114512. [Google Scholar] [CrossRef]
- Benefits, Hydrogen Fuel Cell Partnership. Available online: https://h2fcp.org/benefits (accessed on 17 March 2025).
- Ghaebi Panah, P.; Bornapour, M.; Cui, X.; Guerrero, J.M. Investment Opportunities: Hydrogen Production or BTC Mining? Int. J. Hydrogen Energy 2022, 47, 5733–5744. [Google Scholar] [CrossRef]
- Lucas, T.R.; Ferreira, A.F.; Santos Pereira, R.B.; Alves, M. Hydrogen Production from the WindFloat Atlantic Offshore Wind Farm: A Techno-Economic Analysis. Appl. Energy 2022, 310, 118481. [Google Scholar] [CrossRef]
- Hydrogen Resource Data, Tools, and Maps|Geospatial Data Science|Nrel. Available online: https://www2.nrel.gov/gis/hydrogen (accessed on 14 December 2024).
- Hydrogen Potential from Renewable Resources in the United States. Maps|Data Basin. Available online: https://databasin.org/maps/new/#datasets=99f129e835a5419eadb863c6bca430e8 (accessed on 25 March 2025).
- Clean Hydrogen Global Supply by Technology 2050. Available online: https://www.statista.com/statistics/1401926/global-clean-hydrogen-supply-forecast-by-technology/ (accessed on 20 November 2024).
- Innovative Data Energy Applications. Available online: https://maps.nrel.gov/ (accessed on 14 December 2024).
- Klassen, V.; Blifernez-Klassen, O.; Hoekzema, Y.; Mussgnug, J.H.; Kruse, O. A novel one-stage cultivation/fermentation strategy for improved biogas production with microalgal biomass. J. Biotechnol. 2015, 215, 44–51. [Google Scholar] [CrossRef] [PubMed]
- Obileke, K.; Makaka, G.; Nwokolo, N. Recent Advancements in Anaerobic Digestion and Gasification Technology. Appl. Sci. 2023, 13, 5597. [Google Scholar] [CrossRef]
- Chiaramonti, D.; Prussi, M.; Buffi, M.; Rizzo, A.M.; Pari, L. Review and experimental study on pyrolysis and hydrothermal liquefaction of microalgae for biofuel production. Appl. Energy 2017, 185, 963–972. [Google Scholar] [CrossRef]
- Tabatabaei, M.; Aghbashlo, M.; Valijanian, E.; Panahi, H.K.S.; Nizami, A.S.; Ghanavati, H.; Sulaiman, A.; Mirmohamadsadeghi, S.; Karimi, K. A comprehensive review on recent biological innovations to improve biogas production, part 1: Upstream strategies. Renew. Energy 2020, 146, 1204–1220. [Google Scholar] [CrossRef]
- Tabatabaei, M.; Aghbashlo, M.; Valijanian, E.; Panahi, H.K.S.; Nizami, A.S.; Ghanavati, H.; Sulaiman, A.; Mirmohamadsadeghi, S.; Karimi, K. A comprehensive review on recent biological innovations to improve biogas production, Part 2: Mainstream and downstream strategies. Renew. Energy 2020, 146, 1392–1407. [Google Scholar] [CrossRef]
- Demirel, B. Major pathway of methane formation from energy crops in agricultural biogas digesters. Crit. Rev. Environ. Sci. Technol. 2014, 44, 199–222. [Google Scholar] [CrossRef]
- Khan, I.U.; Othman, M.H.D.; Hashim, H.; Matsuura, T.; Ismail, A.F.; Rezaei-DashtArzhandi, M.; Azelee, I.W. Biogas as a renewable energy fuel—A review of biogas upgrading, utilisation and storage. Energy Convers. Manag. 2017, 150, 277–294. [Google Scholar] [CrossRef]
- Zohuri, B. Hydrogen Energy: Challenges and Solutions for a Cleaner Future; Springer International Publishing: Cham, Switzerland, 2019; ISBN 9783319934600/9783319934617. [Google Scholar]
- Gavrilyuk, A. (Ed.) Hydrogen Energy for Beginners; Jenny Stanford Publishing: Singapore, 2013; ISBN 9780429071133. [Google Scholar]
- Bigdeloo, M.; Teymourian, T.; Kowsari, E.; Ramakrishna, S.; Ehsani, A. Sustainability and Circular Economy of Food Wastes: Waste Reduction Strategies, Higher Recycling Methods, and Improved Valorization. Mater. Circ. Econ. 2021, 3, 3. [Google Scholar] [CrossRef]
- Teymourian, T.; Teymoorian, T.; Kowsari, E.; Ramakrishna, S. Challenges, Strategies, and Recommendations for the Huge Surge in Plastic and Medical Waste during the Global COVID-19 Pandemic with Circular Economy Approach. Mater. Circ. Econ. 2021, 3, 6. [Google Scholar] [CrossRef]
- Akbarian, H.; Jalali, F.M.; Gheibi, M.; Hajiaghaei-Keshteli, M.; Akrami, M.; Sarmah, A.K. A Sustainable Decision Support System for Soil Bioremediation of Toluene Incorporating UN Sustainable Development Goals. Environ. Pollut. 2022, 307, 119587. [Google Scholar] [CrossRef] [PubMed]
- Qian, S.; Li, L. A comparison of well-to-wheels energy use and emissions of hydrogen fuel cell, electric, LNG, and diesel-powered logistics vehicles in China. Energies 2023, 16, 5101. [Google Scholar] [CrossRef]
- Vivanco-Martín, B.; Iranzo, A. Analysis of the European Strategy for Hydrogen: A Comprehensive Review. Energies 2023, 16, 3866. [Google Scholar] [CrossRef]
- Li, Y.; Shi, X.; Phoumin, H. A strategic roadmap for large-scale green hydrogen demonstration and commercialisation in China: A review and survey analysis. Int. J. Hydrogen Energy 2022, 47, 24592–24609. [Google Scholar] [CrossRef]
- Available online: https://energy.maryland.gov/transportation/Documents/CFTA%20Cumberland%20Electrification%20Analysis.pdf (accessed on 17 March 2025).
- Available online: https://www.itf-oecd.org/sites/default/files/docs/analysis-vehicle-fuel-systems-anl.pdf (accessed on 17 March 2025).
- Available online: https://afleet.esia.anl.gov/home/ (accessed on 17 March 2025).
- Available online: https://afdc.energy.gov/files/u/publication/afleet-fact-sheet.pdf?d3685d8c2f (accessed on 17 March 2025).
- Available online: https://afdc.energy.gov/files/u/publication/tools.pdf (accessed on 17 March 2025).
- IEA. Energy Technology Perspectives 2020; IEA: Paris, France, 2020; Available online: https://www.iea.org/reports/energy-technology-perspectives-2020 (accessed on 17 March 2025).
- Wong, E.Y.C.; Ho, D.C.K.; So, S.; Tsang, C.W.; Chan, E.M.H. Life cycle assessment of electric vehicles and hydrogen fuel cell vehicles using the greet model—A comparative study. Sustainability 2021, 13, 4872. [Google Scholar] [CrossRef]
Disclaimer/Publisher’s Note: The statements, opinions and data contained in all publications are solely those of the individual author(s) and contributor(s) and not of MDPI and/or the editor(s). MDPI and/or the editor(s) disclaim responsibility for any injury to people or property resulting from any ideas, methods, instructions or products referred to in the content. |
© 2025 by the authors. Licensee MDPI, Basel, Switzerland. This article is an open access article distributed under the terms and conditions of the Creative Commons Attribution (CC BY) license (https://creativecommons.org/licenses/by/4.0/).