Article

Beyond Circumstantial Evidence on Wildlife–Vehicle Collisions During COVID-19 Lockdown: A Deterministic vs. Probabilistic Multi-Year Analysis from a Mediterranean Island

by
Andreas Y. Troumbis
* and
Yiannis G. Zevgolis
*
Biodiversity Conservation Laboratory, Department of Environment, University of the Aegean, 81132 Mytilene, Greece
*
Authors to whom correspondence should be addressed.
Ecologies 2025, 6(2), 42; https://doi.org/10.3390/ecologies6020042
Submission received: 16 April 2025 / Revised: 18 May 2025 / Accepted: 30 May 2025 / Published: 5 June 2025

Abstract

:
Decreases in animal mortality due to wildlife–vehicle collisions have been consistently documented as an environmental effect of human mobility restrictions aimed at containing the spread of the COVID-19 pandemic. In this study, we investigate this phenomenon on the mid-sized Mediterranean island of Lesvos, considering a multi-species group of mammals over a five-year systematic recording of animal casualties. We developed a method to analyze the relationship between actual casualties and risk, drawing inspiration from Markowitz’s theory on multi-asset optimization in economics. Additionally, we treated this phenomenon as a Poisson probabilistic process. Our main finding indicates that the lockdown year diverged markedly in modeled return–risk space, exhibiting a displacement on the order of 102 compared to the multi-year baseline—an outcome that reflects structural changes in risk dynamics, not a literal 100-fold decrease in observed counts. This modeled shift is significantly larger compared to published evidence regarding individual species. The results concerning the vulnerability of specific mammals, analyzed as a Poisson process, underscore the importance of singular events that can overshadow the overall systemic nature of the issue. We conclude that a promising strategy for addressing this problem is for conservationists to integrate animal-friendly measures into general human road safety policies.

1. Introduction

The outbreak of SARS-CoV-2, which led to the COVID-19 pandemic, has resulted in unprecedented global restrictions on human mobility seemingly creating the largest, unplanned experiment in Ecology and Conservation Science [1,2]. This social-ecological phenomenon [3] is often referred to as the “Global Human Confinement Experiment” (GHCE) [4], or the “Anthropause Perturbation Experiment” (APE) [5], deriving from the theoretical term or neologism “Anthropause” [6]. The sudden and widespread disruption of human activities was implemented worldwide as public health measure(s) [7,8], leading to unique reductions in or abatement of human impacts on the environment and wildlife interactions [9,10]. These changes included a variety of effects [11], such as alterations in the acoustic environment and a decrease in noise pollution [12]. There were also changes in travel and visitation of natural areas [13], a decline in citizen science contributions to wildlife data collection [14,15], and a significant reduction, in most cases, in road-related animal mortality due to decreased traffic and transportation activities [16,17,18,19,20,21,22,23,24,25,26].
Wildlife–vehicle collisions (WVCs), also known as animal road mortality, are a significant focus in the pandemic-conservation literature. As of February 2025, this issue is prominent among over 17,000 relevant publications in the Web of Science. Major roads fragment the Earth’s terrestrial surface into approximately 600,000 patches, more than half smaller than 1 km2 [5,27,28]. Estimates indicate that WVCs in Europe result in the deaths of around 194 million birds and 29 million mammals yearly, including approximately half a million ungulates [29]. After all, the term “Anthropause” has been specifically introduced to describe the interactions between humans and the biotic environment during the pandemic. This concept represents epistemically a top-down approach aimed at identifying patterns that could help us generalize solutions for “how best to share space [with animals] on this crowded planet” [6] (p. 1156).
A WVC incident occurs when traffic, road conditions, and/or driver behavior, and animal populations, habitats, and behaviors intersect. Which of them is determined by pandemic confinement? In an extensive review of the WVC literature (645 documents), Pagany [30] (Figure 6, p. 16) has compiled a list of impact factors associated with or involved in road mortality of various taxa. Among the 16 impact factors or predictors enumerated, two, i.e., traffic volume and vehicle speed, might be affected by human confinement measures. Other material aspects of the road system, e.g., highways, urban roads, or environmental templates, remain the same before, during, and after the transitory period of the lockdown. Then, all others being equal, quantitative changes in the statistical physics of vehicular traffic [31,32] supposedly provide the explanatory substratum for the WVCs within the Anthropause framework.
The scale of the phenomenon has inspired various schemes and initiatives aimed at mitigating its effects and finding dynamic, primarily technical, solutions to reduce the risk of collisions involving wildlife and humans [28,30,33,34,35,36,37], even before the pandemic period of Anthropause. As Pagany [30] (p. 17) concluded, “while there is currently a strong focus on explanatory studies as well as mitigation measures, the question arises to what extent the risk can be predicted and, e.g., used for drivers’ real-time warning”.
The extensive GHCE literature on WVCs presents several examples of scientists’ short-term, localized, and occasionally sporadic rapid reactions to taxa and environmental setups. Collectively, these approaches exemplify a scheme of “fewer people—less impacts” that supports the core conservation narrative: “We should strengthen the important role of people as custodians of biodiversity” [10] (p. 15).
From an epistemic standpoint, one might objectively evaluate the “custodian” narrative, which is based on earlier conservation themes (such as eco-centric [38], spirituality and ethics [39], and provision of goods and services [40]), without intending to dismiss the accumulated evidence of GHDE WVC. One significant weakness of this narrative is that it falls into a circular reasoning trap suggesting, in a verbal exaggeration, that “no human activity ‘means’ no anthropogenic effects” [41], which is not feasible within the Anthropocene [42]. We lean toward an optimistic view of the conservation challenge [43]. Therefore, we propose a neutral approach, considering WVC as either a deterministic ballistic event or as a probabilistic occurrence akin to the result of a Poisson process.
Second, as outlined in the previous literature, the unplanned “once-in-a-lifetime” observational evidence related to GHCE WVC [4] lacks replication and reproducibility. This represents a flaw in its problem-solving methodology [44,45], as it does not meet the requirements for a bottom-up accumulation of evidence necessary for theory building. Instead, in parallel, it exists outside the parameters of the top-down approach represented here by the Anthropause concept [6].
Third, human confinement due to the worldwide lockdown served as the strongest indicator or signal of the existential risks humanity faced [46,47,48]. However, its effects were short-lived and primarily influenced immediate human behavior. The return to pre-lockdown materialism [49] and the introduction of the Anthropulse concept [50] were predicted early enough by Young et al. [51], who advised caution in adopting and misusing the Anthropause concept.
This contribution attempts to address, even partially, the above questions through a multi-year (5-year long) monitoring of animal road fatalities. The monitoring procedure ensures replicability and concerns multi-species roaming mammals with different ranges, speeds, and daily activity on the island of Lesvos, Greece. The middle year of monitoring is 2020, the year of lockdown. This offers the possibility of examining the trajectory of WVC events per species and human activities that are additional to the baseline road mortality toll represented by restricted traffic conditions permitted during the lockdown period. The elements of our overall procedure are developed extensively in the Section 2. Namely, (1) a description of the study area; (2) the characterization and mapping of the Road Network; (3) the road mortality survey; (4) a description of the studied species population and behavioral traits; (5) WVC expected casualties—a risk additional to the baseline (or lockdown period) for the multi-species wild mammalian fauna of Lesvos; and (6) a Poisson-like process to model the number of WVC events occurring within a fixed interval of time or space, given that these events happen with a known constant mean rate and independently of the time since the last event.

2. Materials and Methods
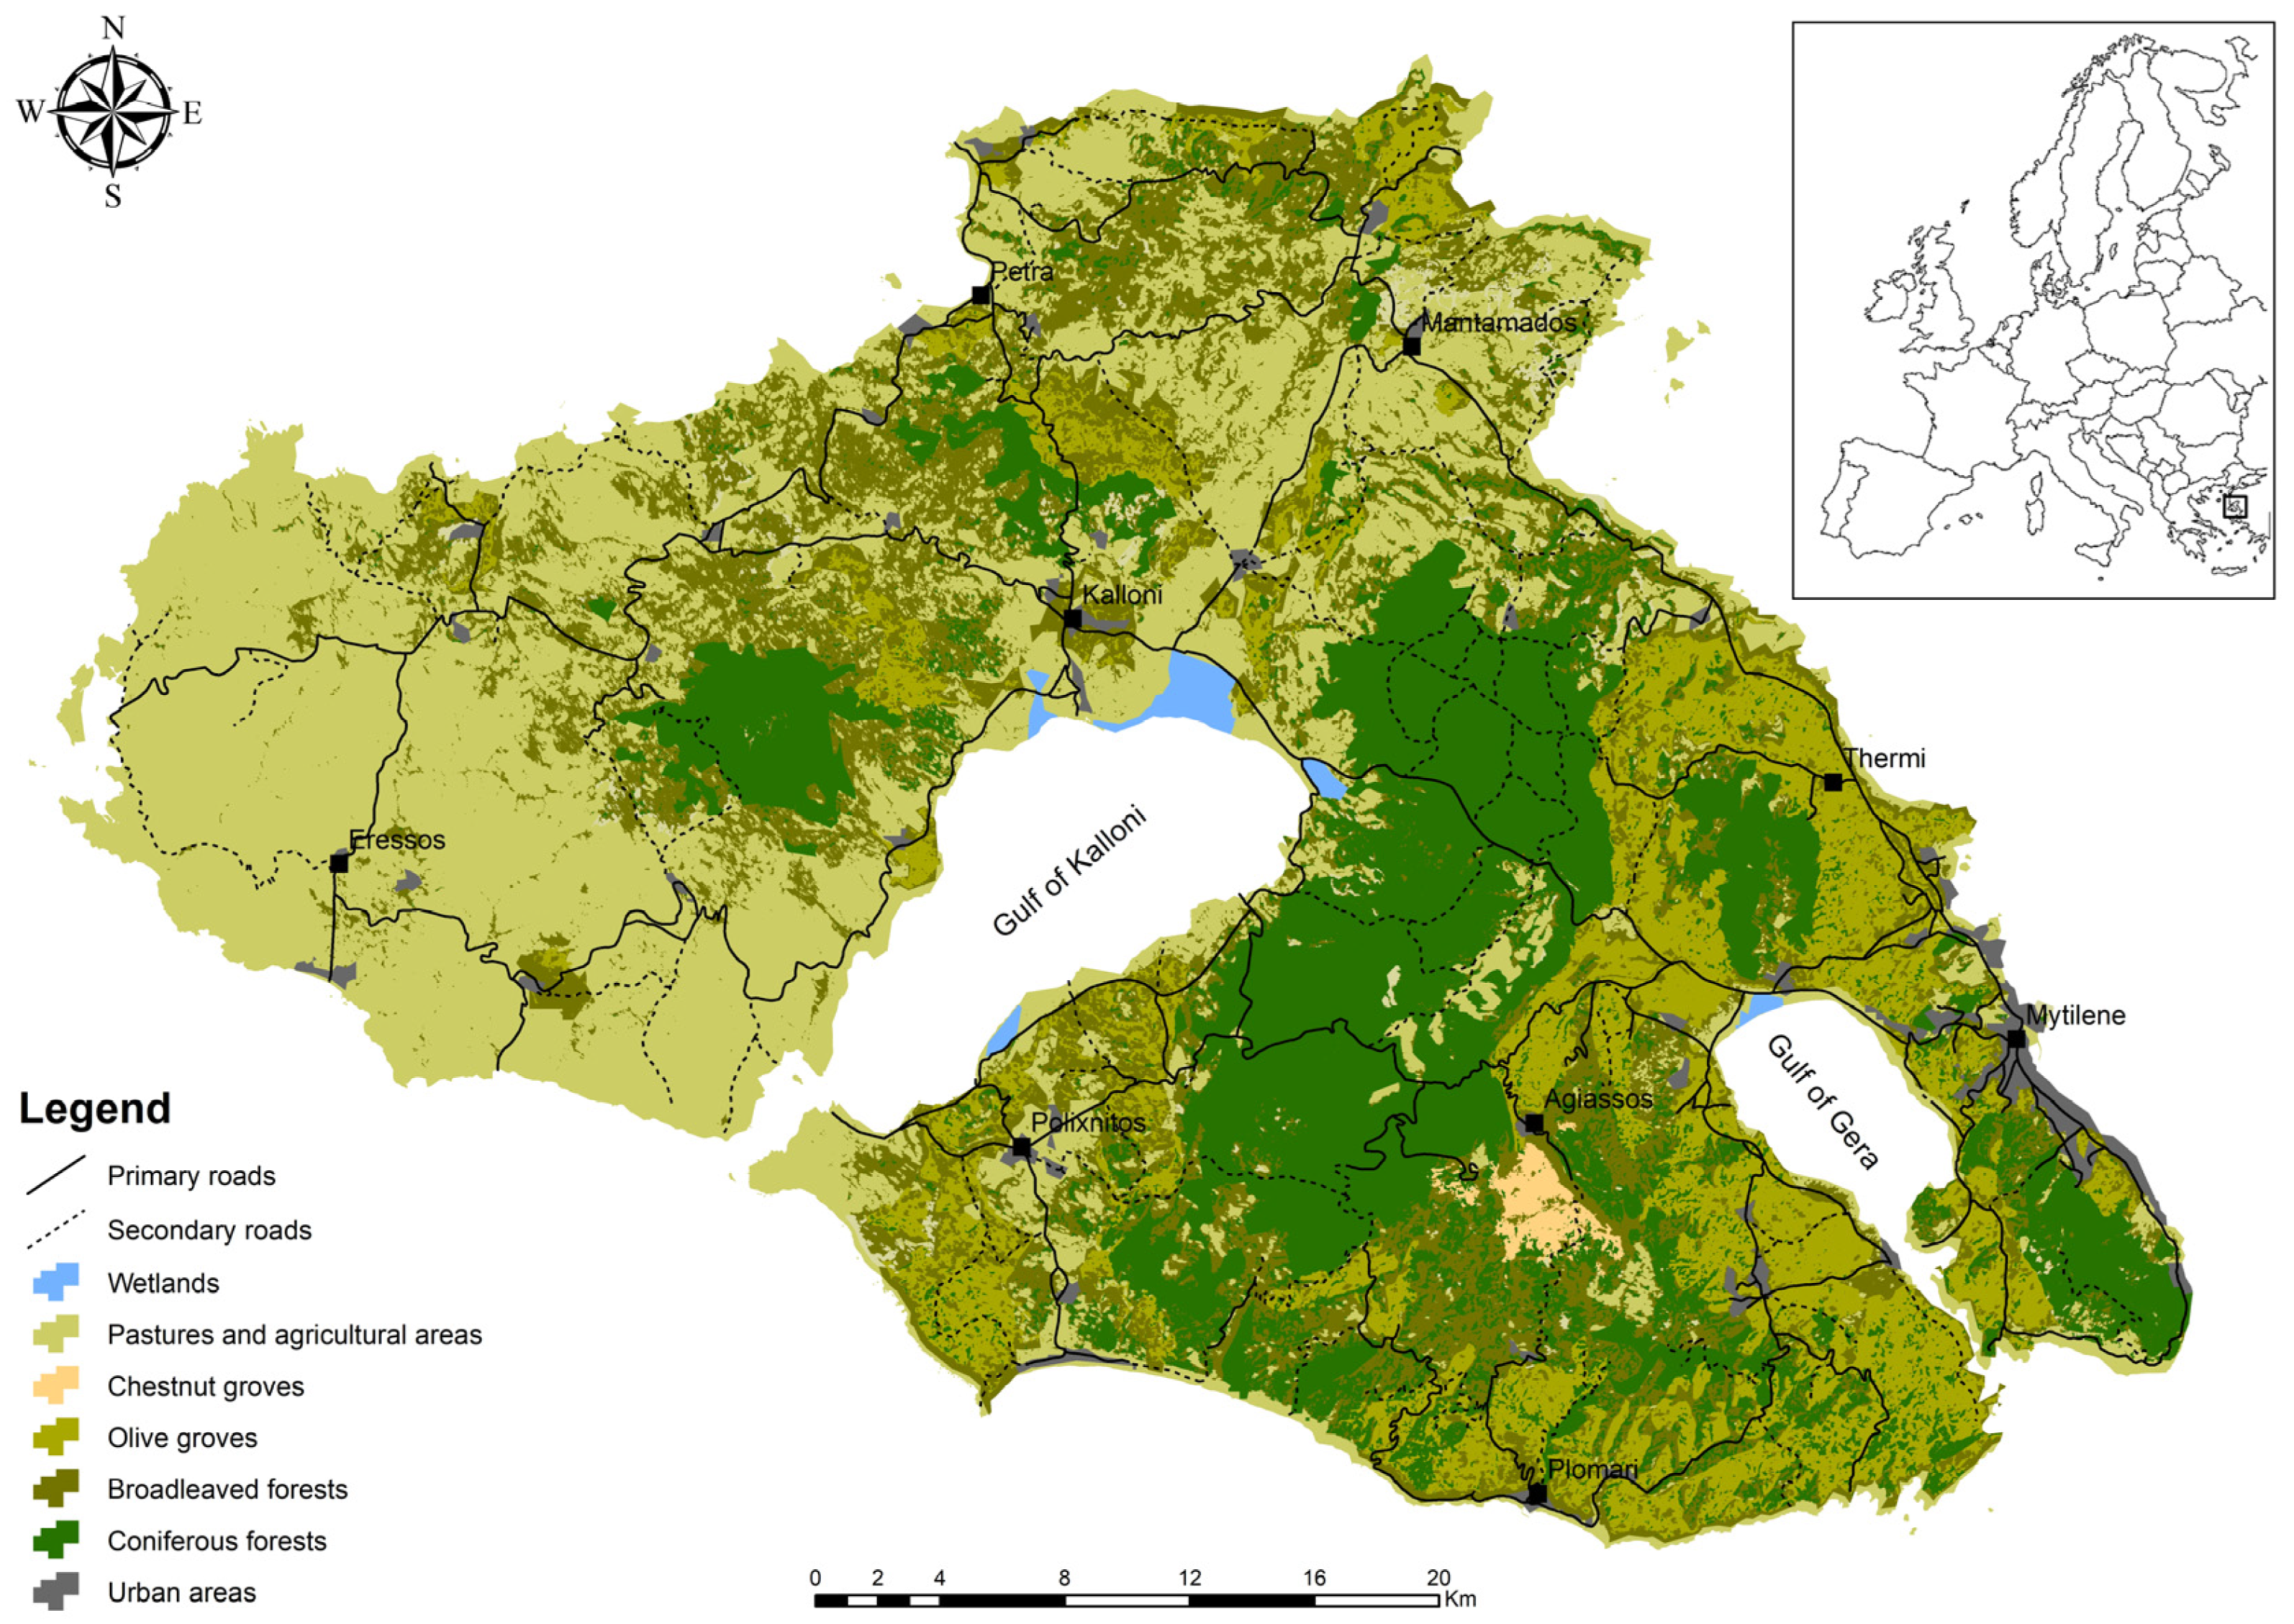
2.1. Study Area

Lesvos Island, situated in the northeastern Aegean Sea, is the third-largest island in Greece and the eighth-largest across the Mediterranean basin, encompassing a landmass of 1632.8 km2 and sustaining a permanent human population of approximately 90,000. The island’s physiographic and ecological profile is shaped by its semi-mountainous terrain, crowned by two major peaks—Mount Lepetymnos and Mount Olympus—which serve as prominent orographic features influencing both microclimatic patterns and habitat zonation. A triadic vegetation regime marks the spatial mosaic of Lesvos: (1) extensive traditional olive groves (Olea europaea), predominating in the eastern and southern lowlands, which represent both a cultural and ecological legacy; (2) relatively continuous and structurally homogeneous coniferous forests, primarily composed of Pinus brutia and Pinus nigra, occupying the central part of the island as uninterrupted wooded expanses [52,53]; and (3) a more fragmented northern and western sector characterized by brushwood formations interspersed with patches of sclerophyllous broadleaved forests, most notably Quercus coccifera and Quercus ithaburensis (Figure 1).
From a biogeographical standpoint, Lesvos represents a critical insular node in the Mediterranean biodiversity network, owing to its geographic isolation, substantial land area, and prolonged evolutionary history. The island’s floristic and faunal assemblages exhibit exceptionally high species richness and endemism, frequently surpassing those recorded on Mediterranean islands of equivalent or greater size. Vertebrate diversity is notably robust [54,55,56], underscoring the island’s ecological and conservation significance within the Mediterranean context.
The island’s Mediterranean climate is typified by marked seasonal and spatial variability. Winters are cool and hydric with a mean temperature of 9.6 °C in January, while summers are warm and xerothermic—features consistent with the broader Eastern Mediterranean climatic envelope, with a mean temperature of 27.0 °C in July (Mytilene airport [57]). The mean annual rainfall varies from approximately 725 mm in the east to 415 mm in the west of the island, with little or no rain between May and September [58].

2.2. Characterization and Mapping of the Road Network

A necessary preliminary step was to develop a detailed and spatially coherent representation of the island’s road infrastructure to systematically monitor wildlife–vehicle collisions (WVCs) involving free-ranging terrestrial mammals across Lesvos Island. This was accomplished by integrating open-access geospatial data from the Greek Geospatial Data and Services Platform [geodata.gov.gr (accessed on 15 January 2018)] with refined spatial datasets curated by the Biodiversity Conservation Laboratory at the University of the Aegean. The latter included field-verified information gathered through long-term monitoring efforts.
The road infrastructure of Lesvos is composed of two main categories: the primary road network, which extends over 488.67 km, and the secondary road network, totaling 484.18 km. The primary network connects the island’s capital, Mytilene, with various smaller towns and villages, several of which are seasonal tourist hubs. These roads are generally two-lane with asphalt shoulders and an average total width of approximately 6.5 m. In contrast, the secondary road system comprises narrower asphalt roads, rural tracks, and unpaved segments, forming connections between towns and villages. These roads typically measure around 5 m in width and often pass through areas of ecological importance or rugged terrain [59].
All reported parameters—such as road lengths, classification, and average widths—were collected and validated by the authors through direct field measurements and manual correction of road segments in a GIS environment.

2.3. Studied Taxa

We focused on five terrestrial mammal species inhabiting the island of Lesvos: Vulpes vulpes (Red Fox), Martes foina (Stone Marten), Erinaceus roumanicus (Northern White-breasted Hedgehog), Mustela nivalis (Least Weasel), and Sciurus anomalus (Persian Squirrel). Though differing in trophic level, spatial behavior, and ecological function, these taxa represent the core assemblage of medium- and small-sized mammals most frequently recorded in roadkill surveys on the island.
Crucially, these species exhibit non-uniform spatial behavior [60] and road-crossing propensities shaped by seasonality, thermoregulatory constraints, and habitat use. Winter represents a marked decline in detectability and surface-level mobility for several of them, driven by physiological adaptations and energy conservation strategies [61]. E. roumanicus, for instance, typically enters a state of hibernation [62], thereby minimizing road exposure almost entirely during the coldest months. S. anomalus, although diurnally active and largely arboreal, limits its movement in winter [63,64], thereby altering its risk profile in relation to road systems. Likewise, M. foina [65] and M. nivalis [66] exhibit behavioral plasticity by retreating into more insulated habitats, reducing exploratory behavior, and limiting road interaction under suboptimal thermal conditions.
This temporal contraction of movement ranges and behavioral modulation implies a seasonal bias in WVC occurrence and must be accounted for in both spatial interpretation and modeling. These species-specific traits—ranging from metabolic rhythms to habitat fidelity—serve as foundational parameters for the probabilistic and risk-based modeling frameworks introduced in Section 2.5 and Section 2.6. A structured summary of these ecological and behavioral attributes is presented in Table 1.

2.4. Road Mortality Survey

To systematically quantify road mortality among terrestrial mammals, we implemented a randomized monitoring protocol along the primary road network of Lesvos Island. This approach aimed to minimize spatial and temporal biases while ensuring sufficient statistical power and consistency across survey years. A vehicle equipped with flashing emergency lights was driven at a regulated speed of 40–50 km/h, in accordance with Greek traffic legislation, to maximize detection efficiency without compromising road safety. Each survey was carried out by a minimum of two experienced observers to ensure inter-observer reliability and to enhance carcass detectability.
Between 2018 and 2022, surveys were conducted exclusively along entire extent of the island’s primary road network through randomized procedures to ensure unbiased spatial representation of roadkill events. While the route length and road type remained constant in all sessions, survey direction and starting point were randomized to ensure unbiased spatial representation of roadkill events and to reduce potential observer habituation. The survey order was also randomized across sessions to counteract potential biases linked to fixed routing or observer anticipation. To account for the diel and seasonal variability in the activity patterns of the five focal mammalian species, observations were conducted during two distinct daily intervals—08:00–12:00 and 18:00–22:00—thus capturing both crepuscular and diurnal mortality patterns. Despite national travel restrictions during the COVID-19 pandemic, special authorization from the University of the Aegean allowed surveys to continue without interruption. As a result, the dataset maintains full spatiotemporal representation of the island’s WVC patterns encompassing five complete years of observations, with 135 surveys conducted in total (27 per year), and is in line with established best practices for island-wide roadkill monitoring.
Each survey was conducted in alternating directions along selected road segments to reduce directional bias and to enhance carcass detection rates. For every recorded incident, GPS coordinates, species identity, and date were documented. When feasible, carcasses were removed from the road following documentation to eliminate the possibility of redundant counts in subsequent surveys.
Road-killed mammals were identified in situ at the lowest possible taxonomic level to ensure high accuracy in species determination. Road mortality surveys were conducted exclusively during the spring, summer, and autumn months, while the winter period was intentionally excluded from monitoring. This decision was based on ecological and behavioral considerations specific to the species to ensure that surveys accurately reflected roadkill patterns during peak activity periods. Additionally, adverse winter weather conditions, such as rainfall, strong winds, and lower temperatures, restrict mammalian movement and presence on the roads. These environmental factors, combined with reduced visibility and challenging survey conditions, could compromise the accuracy and consistency of roadkill detection. Moreover, anthropogenic factors also contribute, as human traffic patterns in Lesvos tend to be lower in winter, resulting in fewer roadkills compared to the warmer months when tourism, agricultural activities, and rural commuting are more common.
Figure 2 presents a temporal decomposition of recorded WVC events by species, month, and year across the five-year monitoring window, offering a visual representation of interannual trends and seasonal dynamics.
This segmentation of the monitoring period is not arbitrary; rather, it aligns with the classification framework established by the Oxford COVID-19 Government Response Tracker [8], which systematically quantifies national-level public health interventions. The tracker’s Stringency Index offers a composite measure reflecting the severity of governmental restrictions, including limitations on mobility, closures of public spaces, and stay-at-home orders.
Figure 3 illustrates the evolution of stringency measures in Greece throughout 2020, encompassing the period of strict national lockdown during the first wave of the pandemic as well as subsequent phases of partial relaxation and re-tightening of controls. Although these data are national in scale, they reflect conditions experienced on Lesvos Island, where similar inter-district mobility restrictions and public health policies were implemented. Notably, the stringency level remained high during critical periods of the year, directly influencing patterns of human movement and, by extension, the likelihood of wildlife–vehicle collisions.

2.5. Calculation of Additional WVC (2018–2022) Against WVC During Lockdown Confinement

To evaluate the extent to which WVC increased following the easing of COVID-19 lockdown measures, we developed a quantitative framework to compare observed road mortality across the five-year monitoring period against a constructed confinement baseline. The aim was to isolate the additional WVC events attributable to restored human mobility and activity following the unique anthropogenic suppression of 2020.
The database was structured into four key categories, each corresponding to parameters required for modeling the risk of WVC events. These components echo the architecture of H. Markowitz’s return–risk theory for multi-asset portfolios in the field of economics and finance [69], allowing us to assess both the frequency (return) and variability (risk) of WVC under different human mobility regimes. This framework offers a useful analogy for interpreting species-specific roadkill risk as a function of exposure (return) and variability (risk): (a) Studied Species (i): represented by five focal taxa—Vulpes vulpes, Martes foina, Erinaceus roumanicus, Mustela nivalis, and Sciurus anomalus—indexed from i = 1 to 5; (b) Months of Observation (m): spanning March to December (m = 1 to 9) in each survey year, excluding the period corresponding to full lockdown; (c) Years of Observation (y): covering five consecutive years from 2018 to 2022 (y = 1 to 5); (d) Assigned Weights (w): a set of realized or randomized weights per species (i), constrained such that the sum across species equals 1 (or 100%).
In this context, we define “return” as the mean number of WVC per species per month—a biological proxy for exposure or realized mortality events. Likewise, “risk” corresponds to the standard deviation of monthly WVC values, representing the temporal variability or unpredictability in species-specific roadkill rates. These ecological analogs enable the return–risk framework to simultaneously capture the frequency (exposure) and variability (uncertainty) of WVC events across species and seasons. By adopting this dual-axis view, our approach facilitates a more nuanced understanding of roadkill vulnerability than raw count comparisons alone.
For modeling purposes, the analysis treats the lockdown period as a fixed six-month interval, while the remaining 39 months across all years are considered representative of ‘normal’ activity levels. In this framework, the variable year (y) is intentionally excluded to enable aggregation of the baseline (non-lockdown) data across all non-confinement years. This approach isolates the effect of mobility restrictions without conflating it with interannual variability, which is addressed elsewhere (Figure 2). By retaining monthly resolution and stratifying by species, the model focuses on seasonal and taxon-specific dimensions of WVC risk while maintaining statistical coherence and analytical clarity.
The analytical approach involves basic matrix operations and stochastic simulations, executed in Microsoft Excel. Inspired by portfolio theory, each species’ contribution to overall WVC risk is viewed through a weighted lens, accounting for the distribution of carcass detections across time. Monte Carlo simulations were incorporated to explore variability in outcomes under different weighting scenarios and to assess how observed patterns deviate from the baseline scenario defined by lockdown conditions. The full modeling procedure and visualizations of the simulation outputs are presented in Figure 4a,b, which illustrate the magnitude of excess mortality per species and per month relative to the confinement benchmark.

2.6. WVC as a Poisson Process Problem

A WVC can occur on a stretch of road when a vehicle traveling at speed sv encounters an animal crossing the road at speed sw. For both the vehicle and the animal, the distance traveled in their intersecting paths can be calculated by multiplying their respective speeds (sv) or (sw) by the time taken. Heuristically, the probability of a collision between a ground-roaming animal and a vehicle denoted as k can be estimated based on the time it takes for the animal to cross a road that has a width of w (and x lanes) as well as the time intervals between vehicles. The time it takes for the animal to cross, denoted as tw, is calculated as t w = w s w   (with units converted accordingly, such as kilometers and hours). A collision will occur if the vehicle’s speed sv and its distance from the crossing point are within a critical distance dc. This critical distance is equivalent to the width of the road w when the animal begins to cross with its traveling speed sw. The time required to transport Ν vehicles over this critical distance is also relevant in this context.
d c = s v × t w = s v s w × w  
Appendix A (Table A1) provides a summary of the physical interactions among the vehicle, motorway, and animal variables, as well as the factors influencing the likelihood of wildlife–vehicle collision (WVC) incidents. A complete list of the physical variables involved in the deterministic formulation, including the average vehicle length ( λ ¯ ), is also provided there. We clarify that λ ¯ refers specifically to the spatial length of vehicles—not to traffic volume—and is employed solely to parameterize spatial vehicle–animal interactions under constant-speed assumptions. Although empirical ranges are not always available for all parameters, the values used in our simulations are grounded in field-based measurements and accepted road ecology standards, as detailed in Appendix A (Table A1) and derived from local conditions on Lesvos Island.
This approach likens a WVC to a ballistic mechanism. Due to the uncertainties and unknowns related to the physical, ecological, and biological aspects of predicting WVC events, pursuing a purely deterministic approach could lead to uncontrollable significant errors. Instead, we can assume that the probability of these WVC occurrences follows a Poisson process. This statistical model yields random values based on the Poisson distribution, which effectively represents the unpredictable number of WVC incidents within a defined time frame, such as the count of road kills over a month. Or this simulation, we utilized the RandPoisson simulation function using the TREEPLAN SimVoi 3.11 platform (add-in) on Excel.
The advantages of this approach are twofold: (1) the possible outcomes of the Poisson distribution are non-negative integers, which align with real-world conditions, and (2) it allows for calculations that extend beyond the confidence intervals of a threshold value. This means we can determine the actual number of roadkills per month and the probability and its confidence intervals associated with significant threshold values, such as the average number of roadkills per month or other target figures. Figure 4 shows an excerpt from the SimVoi spreadsheet that illustrates our procedure.
The data tab will generate one thousand data points representing the average roadkills for the species of interest over one month (the time unit). Each point tracks the random value from the Poisson distribution. The main outputs, shown in the gray background of Figure 5, include the standard deviation and the mean standard error. It is important to note that when calculating the expected roadkill’s confidence limits, the statistic is the expected value’s mean standard error, not the simulation’s standard deviation.
In this configuration, attention should be given to the seed random number generator, especially when multiple species are compared, and the simulation’s output report, where values are sorted from the lowest to the highest.

3. Results

In Section 2, we presented the methodological and conceptual foundation necessary to interpret patterns of WVC on Lesvos Island. The present section synthesizes cartographic and temporal data to identify spatially explicit patterns of mammalian road mortality across a five-year observation period (2018–2022). Our analysis proceeds in three stages: (1) visualization of species-specific WVC distributions; (2) comparative assessment of road mortality during the lockdown year versus non-confinement periods; and (3) probabilistic modeling of species-level WVC occurrence based on a Poisson process framework operating at a one-month temporal resolution.

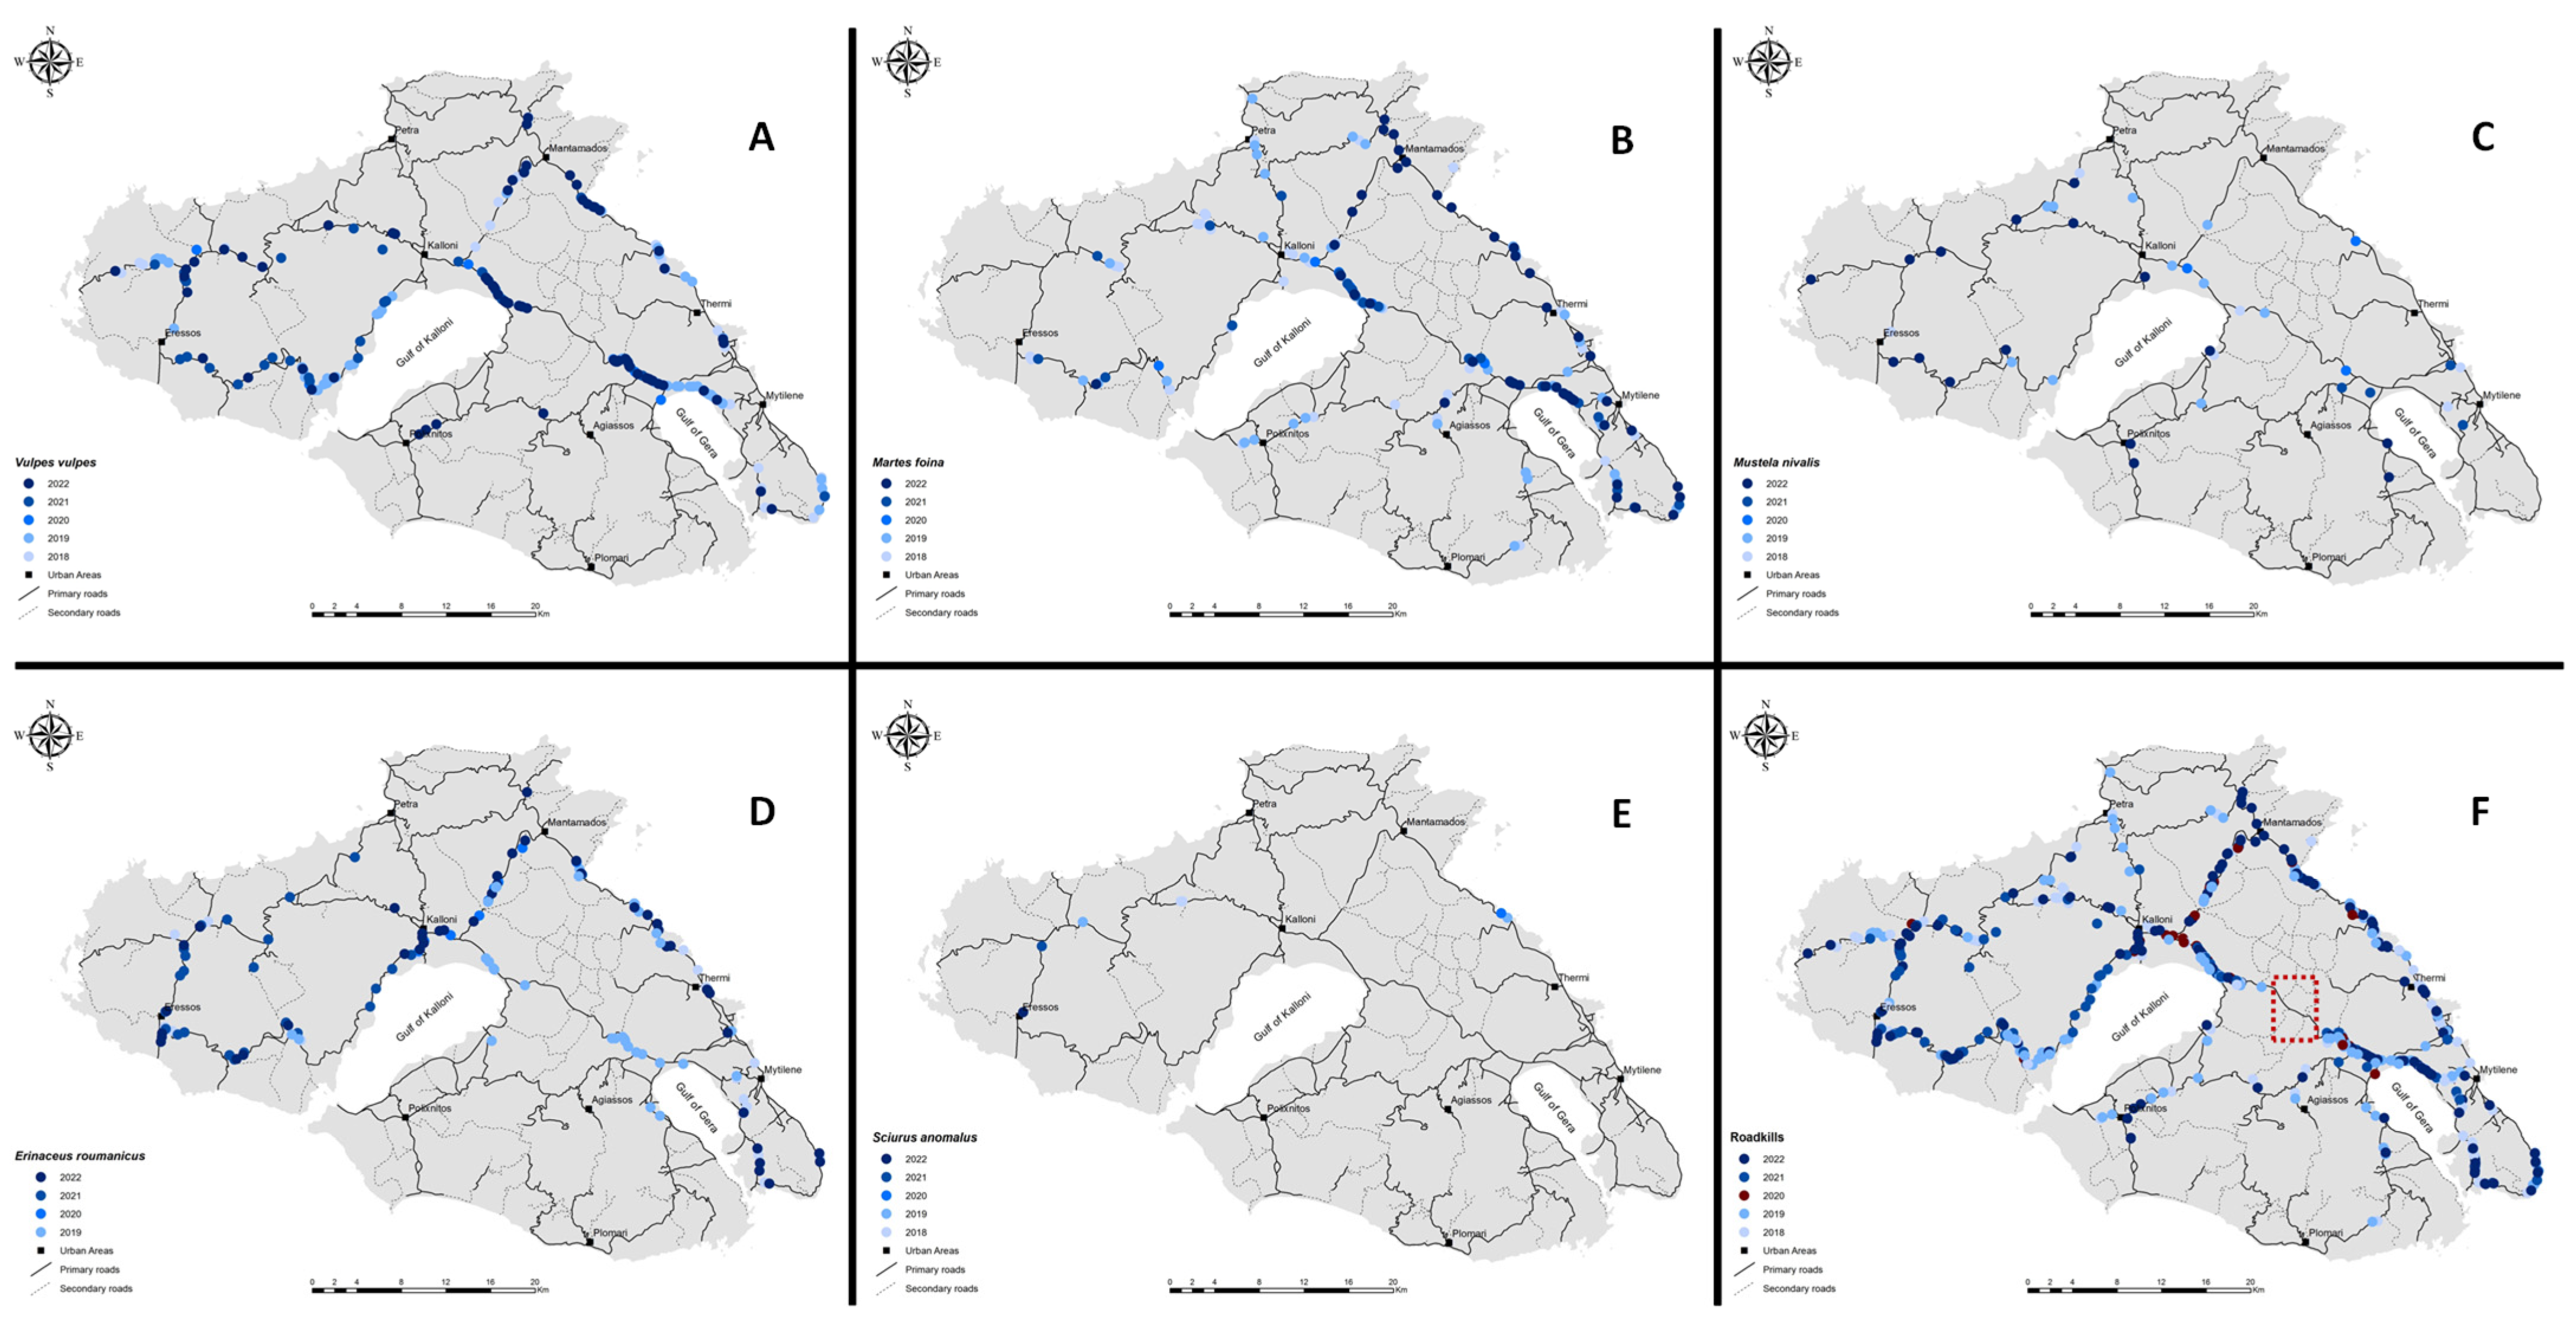
3.1. Spatiotemporal Distribution of WVC (2018–2022)

The geospatial distribution of roadkill events across the island were not randomly distributed but rather concentrated along specific segments of the primary road network (Figure 6). Most major transportation routes, particularly those connecting Mytilene, Kalloni, Eressos, and Mantamados, exhibit repeated detections of road-killed individuals. In contrast, a defined area in the eastern-central part of the island remains consistently devoid of WVC records throughout the monitoring period, across all species examined. This absence is notable and consistently maintained over time.
However, when disaggregated by species, the WVC exhibits pronounced spatial heterogeneity. This variation likely reflects the interaction between species-specific ecological traits—such as population density, home range size, and foraging behavior—and structural characteristics of the road system, including lane width, curvature, traffic volume, and overall road geometry [30]. These intersecting factors collectively shape the landscape of road mortality risk across Lesvos.
Vulpes vulpes exhibits the most extensive road mortality footprint among the studied species. Road mortality events are recorded along all major road corridors, notably in the western and central regions. The species is consistently detected in the five years, indicating a temporally stable interaction pattern with the road network. The species’ ecological plasticity and wide-ranging behavior, coupled with its tolerance for human-altered environments, likely contribute to this pervasive mortality pattern. In contrast, Martes foina (Panel B) shows a more spatially constrained pattern, with mortality events concentrated primarily along the northeastern axis from Mantamados to Mytilene and in segments near Kalloni. While the species is recorded throughout the study period, fewer observations were noted during 2020. As with V. vulpes, the distribution of M. foina roadkills does not extend into the interior forested zone of the island.
The pattern associated with Mustela nivalis (Panel C) is characterized by spatial fragmentation and low overall frequency. Records appear as isolated events, distributed without clear spatial continuity, and are limited primarily to the central and southeastern parts of the island. The low number of detections limits this species’ ability to infer consistent spatial trends. Panel D illustrates the distribution of Erinaceus roumanicus, which displays a more organized presence, particularly in the northern and north-central regions. Repeated records are observed along the Petra–Mantamados and Kalloni–Agia Paraskevi road segments. Although detections are recorded across all five years, a relative reduction in frequency is noted in 2020, followed by an increase in 2021 and 2022.
The spatial distribution of Sciurus anomalus (Panel E) is limited in extent and frequency. WVC events are confined to a few locations in the northern region, with no detections along the central, southern, or eastern road segments. As with other species, the eastern-central area remains consistently records-free, and S. anomalus was not observed in or near this zone throughout the five years. This absence aligns with previous findings [64,68,70,71], which show that the species avoids the pine-dominated habitats characteristic of this area.

3.2. Comparative Assessment of WVC Under Mobility Restriction and Normal Conditions

To assess the influence of human mobility on patterns of WVC, we simulated the expected number of casualties and their associated variability under two contrasting mobility regimes: the lockdown period of 2020 and the surrounding years of regular traffic activity (2018–2019 and 2021–2022), inspired by Markowitz’s theory [69], wherein each species’ contribution to total WVC risk is treated as a discrete component of a multi-species ensemble.
The resulting simulations are visualized in Figure 7, with expected casualties (return) plotted against their standard deviation (risk). During the lockdown period (Figure 7A), the distribution of simulation outputs is tightly clustered and positioned in the lower-left quadrant of the graph. The centroid of this distribution lies at (0.851, 2.393), indicating both reduced collision frequency and lower variance in monthly WVCs. These values reflect a relatively stable period of reduced road mortality coinciding with decreased vehicular movement across the island.
In contrast, the distribution for the period of “normal” mobility (Figure 7B) is widely dispersed and shifts markedly upward and to the right, with a centroid positioned at (10.204, 122.973). This represents an increase by more than an order of magnitude in the mean number of collisions and their associated variability. The broad spread of the simulated outcomes for this period reflects greater temporal inconsistency in WVC incidence, likely driven by the complex and dynamic interactions between species movement, traffic volume, and seasonality. The observed divergence between these two scenarios—quantified here in terms of centroid displacement—suggests a robust relationship between human mobility and the risk landscape of road mortality. These results provide empirical support for the hypothesis that restrictions in vehicular movement during the lockdown substantially suppressed WVC frequency and volatility, producing a transient reduction in anthropogenic pressure on terrestrial fauna. The temporal discontinuity between the two mobility regimes serves as a rare quasi-experimental condition in which the ecological effects of abrupt human withdrawal can be measured with a degree of clarity otherwise difficult to achieve in field-based conservation studies.

3.3. Probabilistic Modeling of Species-Level WVC Occurrence

The temporal probability of species-specific wildlife–vehicle collisions (WVC) was assessed using a Poisson process framework, applying a fixed time interval of one month. This approach enabled estimation of the expected monthly number of roadkill events per species and the probability of observing specific WVC outcomes over time.
Results indicate substantial variation among the five focal species. Vulpes vulpes (6.000) recorded the highest average monthly WVC counts, followed by Martes foina (4.320) and Erinaceus roumanicus (3.294). Mustela nivalis (1.000) and Sciurus anomalus (0.532) had consistently lower monthly frequencies (Table 2). The model produced low mean squared errors and narrow 95% confidence intervals, reflecting reliable estimates for all species.
The probability of exceeding one roadkill per month was lowest for species with high average casualties—e.g., V. vulpes (p > 1 = 0.0035)—because one casualty is well below the mean. Conversely, species with low average casualties showed substantially higher probabilities of exceeding that threshold, such as M. nivalis (p > 1 = 0.3795) and S. anomalus (p > 1 = 0.2985). Similarly, the probability of monthly roadkills exceeding the species-specific average was highest for E. roumanicus (0.5930), followed closely by M. foina and V. vulpes (Table 3). These results reflect consistent collision patterns in species with higher road presence and more variable detection in low-frequency species.
The cumulative probability distributions from Monte Carlo simulations illustrate these interspecific differences (Figure 8). For V. vulpes, M. foina, and E. roumanicus, cumulative probabilities increase gradually across a broader range of monthly values, reflecting a wider distribution of potential WVC counts. These species exhibit both higher expected casualties and greater variability in outcomes. In contrast, M. nivalis and S. anomalus are characterized by sharply rising cumulative functions concentrated within the lower-value domain. More than 90% of simulations for these species resulted in ≤2 casualties per month, indicating low incidence and limited dispersion of monthly WVC events.

4. Discussion

Our results and findings are consistent with empirical evidence from monitoring animal road mortality during COVID-19-related lockdowns across various species in multiple countries. The protocols used in different publications vary in their monitoring strategies, including factors such as the locations (urban versus rural areas), the frequency and duration of observations, the role of citizen science contributions, or the types and lengths of roads involved, ranging from hundreds of meters to highways. Although animal mortality tolls differ between cases, the general pattern is that WVC decreases are associated with lower traffic pressures.
The current case contributes to the contextual differences previously mentioned and explores methodological extensions. The study area is a mid-sized island that supports healthy populations of small mammals. However, as anticipated, the mammalian fauna lacks larger species, such as deer, wild boars, and large carnivores, compared to continental regions. Lesvos Island features a highly diverse landscape with a varied motif (Figure 1), facilitating the distribution of most studied species habitats throughout the island [72]. Aside from Sciurus anomalus, which is closely associated with olive groves [68], the distribution of WVC locations for the other four species serves as retrospective evidence.
The island boasts the largest road network among the Aegean Islands. While it is not yet a top-ranked mass tourist destination, several local attractions appeal to niche tourists. For example, Kalloni Bay is popular among birdwatchers [73], Eressos is renowned as the birthplace of Sappho [74], Sigri is known for its extensive petrified forest [75], and Molyvos is one of the oldest traditional settlements in Greece. The locations of WVC are distributed along the road network that connects these settlements to the capital town of Mytilene and the airport. This arrangement influences traffic loads and seasonal variations, especially when analyzing WVC events through triptych vehicles, motorways, and animal factors (see Appendix A). In that sense, one endangered mammal species on Lesvos Island is, after all, Homo sapiens [76]. The patterns of human road mortality closely align with those of the studied mammals from 2018 to 2022.
Applying Markowitz’s methodology to explore the relationship between casualties (returns) and standard deviation (risk) is an innovative approach in this field. From an epistemic standpoint, this method is justified by the parallels between ecology and economics, particularly from a functionalist perspective [77]. The objective is to identify combinations that yield higher returns with lower risk or the opposite. Using this methodology, we found that the impact of restricted human mobility, combined with significantly reduced traffic congestion, leads to a difference in the magnitude of the wildlife–vehicle collision (WVC) phenomenon, which is on the order of 102 when examining the island’s mammalian fauna as a whole. This methodology provides a top-down perspective on generalization insofar as ecology is essential for addressing practical environmental issues. It gives essence to the Anthropause concept [6], beyond individual species singularities.
A Poisson process is crucial for a probabilistic approach to the WVC phenomenon. This is because it effectively models random and independent events that do not occur simultaneously, all while following a constant average rate over a specified time period. The Poisson simulations’ results indicate that Lesvos Island’s mammalian fauna can be divided into two groups based on their vulnerability to wildlife–vehicle collisions (WVCs). The first group includes species that are highly vulnerable to WVCs: Vulpes vulpes (Red fox), Martes foina (Stone marten), and Erinaceus roumanicus (Northern white-breasted hedgehog). The second group consists of less vulnerable species: Mustela nivalis (Least weasel) and Sciurus anomalus (Persian squirrel). Since traffic conditions across the primary road network are known to be relatively uniform, as confirmed by previous studies [59] and regional transportation data, the observed differences in WVC rates are more likely attributable to species-specific population densities, ecological requirements, and behavioral traits.
Nonetheless, several limitations should be acknowledged to contextualize our findings. First, while our dataset spans five years and employs systematic protocols, surveys were conducted exclusively along the primary road network. As such, WVCs occurring on secondary, rural, or unpaved roads are not captured, potentially underestimating total mortality. Second, although we assumed traffic flow uniformity based on regional evidence and field validation, the absence of direct traffic volume data prevents finer-scale modeling of vehicular pressure. Finally, the exclusion of winter months—though ecologically justified—means that some rare or atypical WVC patterns may go undetected. These limitations do not compromise the validity of our results but should be considered when extrapolating to broader contexts or other road systems.
In the Introduction, we expressed an optimistic view of WVC’s conservation challenge and its effects on animal road mortality. One might argue that our findings contradict this position. The alternative perspective on humanity as caretakers of biodiversity [9,10] in the case of WVCs assumes that the general public should acquire strong environmental awareness and adopt responsible driving behavior. This awareness should be built on a communication framework that outlines cause-and-effect relationships, identifies individual and systemic responsibility or responsibilities, and promotes environmental ethics in contrast to postmodern materialism. As Louder and Wyborn [42] (p. 252) observe, “there is one common thread [in the calls for new narratives in conservation]: the stories of old are not achieving the goals they were meant to, and conservationists need to think critically about the narratives that they deploy”.
In addition to this theoretical critique, which may be seen as insufficient or inadequate regarding the complexity of WVC and traffic accidents generally, we should address the physical aspects of the phenomenon, as detailed in Appendix A. In the WVC triptych, there are at least thirteen complex factors relating to the vehicle and the driver, seven concerning the motorway, and four the animal. This complex triptych’s impact can be alleviated if treated as an ensemble. We maintain an optimistic view precisely because core policies can be enforced if conservationists and the public prioritize demands for action regardless of species’ charismatic or emblematic character. Recent publications show that legal status and law enforcement produce large positive effects globally within protected areas [78], and a large global meta-analysis provides the strongest evidence to date that focused conservation actions are successful but require transformational scaling up to meet global targets [79]. The lesson, if there is any, from such an approach is that conservation policies addressing WVC should be twinned with policies aiming to increase road safety in general. This perspective aligns with growing recognition that roadkill constitutes not merely an incidental outcome of transportation infrastructure, but a systematic and spatially pervasive conservation threat that warrants integrative mitigation efforts within biodiversity strategies [80]. For instance, in 2021, the European Commission introduced the EU road safety policy framework 2021–2030, which consists of the “Vision Zero” policy—zero fatalities and serious injuries on European roads by 2050 [81]. Energizing authorities, establishing monitoring systems, improving road quality, and transferring substantial control capacities and law enforcement to the traffic police will, in parallel to humans, be beneficial to mitigate the WVC phenomenon. To operationalize this integration, we propose a set of context-appropriate mitigation strategies: (1) seasonal or time-specific speed limit reductions in identified WVC areas; (2) warning signage targeting species-rich zones; (3) the establishment of simple, cost-effective fauna passages in areas with persistent WVC events; and (4) incorporation of WVC considerations into regional road planning and maintenance protocols. These recommendations reflect well-documented best practices in road ecology and can be implemented even under the limited budgets typical of island-scale transportation authorities.

5. Conclusions

Investigating the phenomenon of wildlife–vehicle collisions (WVCs) of a multiple species ensemble at a regional scale reveals that animal road mortality is significant and far exceeds the differences in mortality observed at the individual species level. By leveraging methodological similarities between economics and ecology when addressing systemic issues, we may be able to advance conservation action efficiency. Furthermore, integrating WVC considerations into a broader human road safety policy framework could be beneficial for both animals and humans.

Author Contributions

Conceptualization, A.Y.T. and Y.G.Z.; methodology, A.Y.T. and Y.G.Z.; software, A.Y.T. and Y.G.Z.; validation, A.Y.T.; formal analysis A.Y.T.; investigation, Y.G.Z.; resources, A.Y.T. and Y.G.Z.; data curation, A.Y.T. and Y.G.Z.; writing—original draft preparation, A.Y.T. and Y.G.Z.; writing—review and editing, A.Y.T. and Y.G.Z.; visualization, A.Y.T. and Y.G.Z.; All authors have read and agreed to the published version of the manuscript.

Funding

This research received no external funding.

Institutional Review Board Statement

Not applicable.

Informed Consent Statement

Not applicable.

Data Availability Statement

The corresponding authors will make the raw data supporting this article’s conclusions available upon request.

Acknowledgments

We sincerely thank the anonymous reviewers for their constructive comments and valuable suggestions, which improved the quality and clarity of this manuscript. All aspects of this study were conducted in full compliance with Hellenic national law (Presidential Decree 67/81: “On the protection of native flora and wild fauna and the determination of the coordination and control procedure of related research”) on the humane use of animals.

Conflicts of Interest

The authors declare no conflicts of interest.

Appendix A

Table A1. Variables and factors of the Vehicle–Animal–Motorway triptych that interfere with a Wildlife–Vehicle Collision event. The term λ ¯ used in this model refers strictly to the average physical length of vehicles (in km), as required for the geometric calculation of collision probability. Due to the relative uniformity of traffic loads across Lesvos Island’s primary road network, traffic intensity was assumed to be spatially consistent in the probabilistic model. Typical ranges provided are drawn from field observations on Lesvos, published ecological studies of the five focal species (see Table 1 and Section 2.3), and general transport engineering norms. Where precise data were unavailable, conservative ranges were selected to reflect Mediterranean island road conditions.
Variable/FactorExpressionsUnitsTypical Ranges
Vehicle
Vehicle speedsvkm.h−150–90
Distance traveled d in time t d v = s v . t km-
Vehicle lengthλm (km × 10−3)3.8–4.5
Average vehicle fleet length λ ¯ m (km × 10−3)4.2
Human reaction time to troubleτs (h/60)1–1.5
The minimum separation between vehicles V = τ s v km0.02–0.05
Number of vehicles per length of the lane V N = 1 λ + V number-
Congestion factor c f = 1 + ( N 1 d ) ( λ + V ) -
Number of vehicles passing the crossing point per unit of time V N ( t ) = s v λ + V -
The average interval between vehicles I v = d c f km-
Time to transport N vehicles over distance d T N d = d s v ( 1 + ( N 1 ) d ( λ + V ) ) -
Trip speed of N vehicles over distance d S N s = s v 1 + ( N 1 d ) ( λ + V ) -
Vehicular travel capacity V T C = N . S N s = N . s v 1 + ( N 1 d ) ( λ + V ) -
Animal
Roaming animal mean daily speedswkm.h−11–25 (species-specific)
Daily home rangewkm20.01–13
Population at riskR = ind/(LA)Ind/km20.5–15
Daily roaming ratio ρ = r o a m i n g   h o u r s d a y day−10.25–0.5
Motorway
Total lengthLkm488.67
Length in the animal hotspot areadkm1–20
Lanes/directionxnumber1–2
Widthwm5–7
Lethal aread × wkm2-
Critical distance d c = π s w km0.1–0.5
WVC rateWVCrInd.day−1 (or y−1)-

References

  1. Corlett, R.T.; Primack, R.B.; Devictor, V.; Maas, B.; Goswami, V.R.; Bates, A.E.; Koh, L.P.; Regan, T.J.; Loyola, R.; Pakeman, R.J.; et al. Impacts of the coronavirus pandemic on biodiversity conservation. Biol. Conserv. 2020, 246, 108571. [Google Scholar] [CrossRef]
  2. Schwartz, M.W.; Glikman, J.A.; Cook, C.N. The COVID-19 pandemic: A learnable moment for conservation. Conserv. Sci. Pract. 2020, 2, e255. [Google Scholar] [CrossRef]
  3. Troumbis, A.Y. Testing the socioeconomic determinants of COVID-19 pandemic hypothesis with aggregated Human Development Index. J. Epidemiol. Community Health 2021, 75, 414–415. [Google Scholar] [CrossRef]
  4. Bates, A.E.; Primack, R.B.; Moraga, P.; Duarte, C.M. COVID-19 pandemic and associated lockdown as a “Global Human Confinement Experiment” to investigate biodiversity conservation. Biol. Conserv. 2020, 248, 108665. [Google Scholar] [CrossRef]
  5. Perkins, S.E.; Shilling, F.; Collinson, W. Anthropause Opportunities: Experimental Perturbation of Road Traffic and the Potential Effects on Wildlife. Front. Ecol. Evol. 2022, 10, 833129. [Google Scholar] [CrossRef]
  6. Rutz, C.; Loretto, M.-C.; Bates, A.E.; Davidson, S.C.; Duarte, C.M.; Jetz, W.; Johnson, M.; Kato, A.; Kays, R.; Mueller, T.; et al. COVID-19 lockdown allows researchers to quantify the effects of human activity on wildlife. Nat. Ecol. Evol. 2020, 4, 1156–1159. [Google Scholar] [CrossRef] [PubMed]
  7. Hale, T.; Angrist, N.; Goldszmidt, R.; Kira, B.; Petherick, A.; Phillips, T.; Webster, S.; Cameron-Blake, E.; Hallas, L.; Majumdar, S.; et al. A global panel database of pandemic policies (Oxford COVID-19 Government Response Tracker). Nat. Hum. Behav. 2021, 5, 529–538. [Google Scholar] [CrossRef]
  8. Oxford COVID-19 Government Response Tracker. Available online: https://www.bsg.ox.ac.uk/research/covid-19-government-response-tracker (accessed on 19 July 2023).
  9. Primack, R.B.; Bates, A.E.; Duarte, C.M. The conservation and ecological impacts of the COVID-19 pandemic. Biol. Conserv. 2021, 260, 109204. [Google Scholar] [CrossRef] [PubMed]
  10. Bates, A.E.; Primack, R.B.; Biggar, B.S.; Bird, T.J.; Clinton, M.E.; Command, R.J.; Richards, C.; Shellard, M.; Geraldi, N.R.; Vergara, V.; et al. Global COVID-19 lockdown highlights humans as both threats and custodians of the environment. Biol. Conserv. 2021, 263, 109175. [Google Scholar] [CrossRef]
  11. Loh, H.C.; Looi, I.; Ch’ng, A.S.H.; Goh, K.W.; Ming, L.C.; Ang, K.H. Positive global environmental impacts of the COVID-19 pandemic lockdown: A review. GeoJournal 2022, 87, 4425–4437. [Google Scholar] [CrossRef]
  12. Derryberry, E.P.; Phillips, J.N.; Derryberry, G.E.; Blum, M.J.; Luther, D. Singing in a silent spring: Birds respond to a half-century soundscape reversion during the COVID-19 shutdown. Science 2020, 370, 575–579. [Google Scholar] [CrossRef] [PubMed]
  13. Souza, C.N.; Rodrigues, A.C.; Correia, R.A.; Normande, I.C.; Costa, H.C.M.; Guedes-Santos, J.; Malhado, A.C.M.; Carvalho, A.R.; Ladle, R.J. No visit, no interest: How COVID-19 has affected public interest in world’s national parks. Biol. Conserv. 2021, 256, 109015. [Google Scholar] [CrossRef]
  14. Sánchez-Clavijo, L.M.; Martínez-Callejas, S.J.; Acevedo-Charry, O.; Diaz-Pulido, A.; Gómez-Valencia, B.; Ocampo-Peñuela, N.; Ocampo, D.; Olaya-Rodríguez, M.H.; Rey-Velasco, J.C.; Soto-Vargas, C.; et al. Differential reporting of biodiversity in two citizen science platforms during COVID-19 lockdown in Colombia. Biol. Conserv. 2021, 256, 109077. [Google Scholar] [CrossRef] [PubMed]
  15. Hochachka, W.M.; Alonso, H.; Gutiérrez-Expósito, C.; Miller, E.; Johnston, A. Regional variation in the impacts of the COVID-19 pandemic on the quantity and quality of data collected by the project eBird. Biol. Conserv. 2021, 254, 108974. [Google Scholar] [CrossRef]
  16. Asari, Y. Decreased traffic volume during COVID-19 did not reduce roadkill on fenced highway network in Japan. Landsc. Ecol. Eng. 2022, 18, 121–124. [Google Scholar] [CrossRef]
  17. Basak, S.M.; O’Mahony, D.T.; Lesiak, M.; Basak, A.K.; Ziółkowska, E.; Kaim, D.; Hossain, M.S.; Wierzbowska, I.A. Animal-vehicle collisions during the COVID-19 lockdown in early 2020 in the Krakow metropolitan region, Poland. Sci. Rep. 2022, 12, 7572. [Google Scholar] [CrossRef]
  18. Raymond, S.; Spencer, M.; Chadwick, E.A.; Madden, J.R.; Perkins, S.E. The impact of the COVID-19 lockdowns on wildlife–vehicle collisions in the UK. J. Anim. Ecol. 2023, 92, 1244–1255. [Google Scholar] [CrossRef]
  19. García-Martínez-de-Albéniz, Í.; Ruiz-de-Villa, J.A.; Rodriguez-Hernandez, J. Impact of COVID-19 Lockdown on Wildlife-Vehicle Collisions in NW of Spain. Sustainability 2022, 14, 4849. [Google Scholar] [CrossRef]
  20. LeClair, G.; Chatfield, M.W.H.; Wood, Z.; Parmelee, J.; Frederick, C.A. Influence of the COVID-19 pandemic on amphibian road mortality. Conserv. Sci. Pract. 2021, 3, e535. [Google Scholar] [CrossRef]
  21. Stiles, J.; Kar, A.; Lee, J.; Miller, H.J. Lower Volumes, Higher Speeds: Changes to Crash Type, Timing, and Severity on Urban Roads from COVID-19 Stay-at-Home Policies. Transp. Res. Rec. J. Transp. Res. Board 2023, 2677, 15–27. [Google Scholar] [CrossRef]
  22. Łopucki, R.; Kitowski, I.; Perlińska-Teresiak, M.; Klich, D. How Is Wildlife Affected by the COVID-19 Pandemic? Lockdown Effect on the Road Mortality of Hedgehogs. Animals 2021, 11, 868. [Google Scholar] [CrossRef] [PubMed]
  23. Manenti, R.; Mori, E.; Di Canio, V.; Mercurio, S.; Picone, M.; Caffi, M.; Brambilla, M.; Ficetola, G.F.; Rubolini, D. The good, the bad and the ugly of COVID-19 lockdown effects on wildlife conservation: Insights from the first European locked down country. Biol. Conserv. 2020, 249, 108728. [Google Scholar] [CrossRef] [PubMed]
  24. Bíl, M.; Andrášik, R.; Cícha, V.; Arnon, A.; Kruuse, M.; Langbein, J.; Náhlik, A.; Niemi, M.; Pokorny, B.; Colino-Rabanal, V.J.; et al. COVID-19 related travel restrictions prevented numerous wildlife deaths on roads: A comparative analysis of results from 11 countries. Biol. Conserv. 2021, 256, 109076. [Google Scholar] [CrossRef] [PubMed]
  25. Driessen, M.M. COVID-19 restrictions provide a brief respite from the wildlife roadkill toll. Biol. Conserv. 2021, 256, 109012. [Google Scholar] [CrossRef]
  26. Abraham, J.O.; Mumma, M.A. Elevated wildlife-vehicle collision rates during the COVID-19 pandemic. Sci. Rep. 2021, 11, 20391. [Google Scholar] [CrossRef]
  27. Ibisch, P.L.; Hoffmann, M.T.; Kreft, S.; Pe’er, G.; Kati, V.; Biber-Freudenberger, L.; DellaSala, D.A.; Vale, M.M.; Hobson, P.R.; Selva, N. A global map of roadless areas and their conservation status. Science 2016, 354, 1423–1427. [Google Scholar] [CrossRef]
  28. Bíl, M.; Heigl, F.; Janoška, Z.; Vercayie, D.; Perkins, S.E. Benefits and challenges of collaborating with volunteers: Examples from National Wildlife Roadkill Reporting Systems in Europe. J. Nat. Conserv. 2020, 54, 125798. [Google Scholar] [CrossRef]
  29. Grilo, C.; Koroleva, E.; Andrášik, R.; Bíl, M.; González-Suárez, M. Roadkill risk and population vulnerability in European birds and mammals. Front. Ecol. Environ. 2020, 18, 323–328. [Google Scholar] [CrossRef]
  30. Pagany, R. Wildlife-vehicle collisions—Influencing factors, data collection and research methods. Biol. Conserv. 2020, 251, 108758. [Google Scholar] [CrossRef]
  31. Chowdhury, D. Statistical physics of vehicular traffic and some related systems. Phys. Rep. 2000, 329, 199–329. [Google Scholar] [CrossRef]
  32. Nagatani, T. Traffic dispersion and its mapping to one-sided ballistic deposition. Phys. A Stat. Mech. Its Appl. 2007, 376, 641–648. [Google Scholar] [CrossRef]
  33. Olson, D.D.; Bissonette, J.A.; Cramer, P.C.; Bunnell, K.D.; Coster, D.C.; Jackson, P.J. How does variation in winter weather affect deer—Vehicle collision rates? Wildl. Biol. 2015, 21, 80–87. [Google Scholar] [CrossRef]
  34. Santos, R.A.L.; Mota-Ferreira, M.; Aguiar, L.M.S.; Ascensão, F. Predicting wildlife road-crossing probability from roadkill data using occupancy-detection models. Sci. Total Environ. 2018, 642, 629–637. [Google Scholar] [CrossRef]
  35. Gunson, K.E.; Mountrakis, G.; Quackenbush, L.J. Spatial wildlife-vehicle collision models: A review of current work and its application to transportation mitigation projects. J. Environ. Manag. 2011, 92, 1074–1082. [Google Scholar] [CrossRef]
  36. Valerio, F.; Carvalho, F.; Barbosa, A.M.; Mira, A.; Santos, S.M. Accounting for Connectivity Uncertainties in Predicting Roadkills: A Comparative Approach between Path Selection Functions and Habitat Suitability Models. Environ. Manag. 2019, 64, 329–343. [Google Scholar] [CrossRef] [PubMed]
  37. Valerio, F.; Basile, M.; Balestrieri, R. The identification of wildlife-vehicle collision hotspots: Citizen science reveals spatial and temporal patterns. Ecol. Process. 2021, 10, 6. [Google Scholar] [CrossRef]
  38. Kopnina, H.; Washington, H.; Gray, J.; Taylor, B. The ‘future of conservation’ debate: Defending ecocentrism and the Nature Needs Half movement. Biol. Conserv. 2018, 217, 140–148. [Google Scholar] [CrossRef]
  39. Negi, C.S. Religion and biodiversity conservation: Not a mere analogy. Int. J. Biodivers. Sci. Manag. 2005, 1, 85–96. [Google Scholar] [CrossRef]
  40. Millennium. Ecosystem Assessment Ecosystems and Human Well-Being: Opportunities and Challenges for Business and Industry; Island Press: Washington, DC, USA, 2005. [Google Scholar]
  41. Troumbis, A.Y. The circularity entrapment of the ‘Global Human Confinement Experiment’ in conservation culturomics. Biol. Conserv. 2021, 260, 109244. [Google Scholar] [CrossRef]
  42. Louder, E.; Wyborn, C. Biodiversity narratives: Stories of the evolving conservation landscape. Environ. Conserv. 2020, 47, 251–259. [Google Scholar] [CrossRef]
  43. Balmford, A.; Knowlton, N. Why Earth Optimism? Science 2017, 356, 225. [Google Scholar] [CrossRef] [PubMed]
  44. Kitcher, P. Two Approaches to Explanation. J. Philos. 1985, 82, 632. [Google Scholar] [CrossRef]
  45. Shrader-Frechette, K.S.; McCoy, E.D. Method in Ecology; Cambridge University Press: Cambridge, UK, 1993; ISBN 9780521418614. [Google Scholar]
  46. Bostrom, N. Existential Risk Prevention as Global Priority. Glob. Policy 2013, 4, 15–31. [Google Scholar] [CrossRef]
  47. Moynihan, T. Existential risk and human extinction: An intellectual history. Futures 2020, 116, 102495. [Google Scholar] [CrossRef]
  48. Troumbis, A.Y. Did the COVID-19 Crisis Reframe Public Awareness of Environmental Topics as Humanity’s Existential Risks? A Case from the UK. World 2024, 5, 1194–1210. [Google Scholar] [CrossRef]
  49. Kesenheimer, J.S.; Greitemeyer, T. A “Lockdown” of Materialism Values and Pro-Environmental Behavior: Short-Term Effects of the COVID-19 Pandemic. Sustainability 2021, 13, 11774. [Google Scholar] [CrossRef]
  50. Rutz, C. Studying pauses and pulses in human mobility and their environmental impacts. Nat. Rev. Earth Environ. 2022, 3, 157–159. [Google Scholar] [CrossRef]
  51. Young, N.; Kadykalo, A.N.; Beaudoin, C.; Hackenburg, D.M.; Cooke, S.J. Is the Anthropause a useful symbol and metaphor for raising environmental awareness and promoting reform? Environ. Conserv. 2021, 48, 274–277. [Google Scholar] [CrossRef]
  52. Zevgolis, Y.G.; Kamatsos, E.; Akriotis, T.; Dimitrakopoulos, P.G.; Troumbis, A.Y. Estimating Productivity, Detecting Biotic Disturbances, and Assessing the Health State of Traditional Olive Groves, Using Nondestructive Phenotypic Techniques. Sustainability 2021, 14, 391. [Google Scholar] [CrossRef]
  53. Zevgolis, Y.G.; Sazeides, C.I.; Zannetos, S.P.; Grammenou, V.; Fyllas, N.M.; Akriotis, T.; Dimitrakopoulos, P.G.; Troumbis, A.Y. Investigating the effect of resin collection and detecting fungal infection in resin-tapped and non-tapped pine trees, using minimally invasive and non-invasive diagnostics. For. Ecol. Manag. 2022, 524, 120498. [Google Scholar] [CrossRef]
  54. Christopoulos, A.; Zevgolis, Y.G. A New Invasion of the Common Slider on a Mediterranean Island (Lesvos, Greece): A Potential Threat to Native Terrapin Populations? Diversity 2022, 14, 1018. [Google Scholar] [CrossRef]
  55. Zevgolis, Y.G.; ZannetoS, P.S.; Akriotis, T. Physiological response of a wild rodent to experimental manipulations in its natural environment using infrared thermography. Hystrix. Ital. J. Mammal. 2022, 33, 80–91. [Google Scholar] [CrossRef]
  56. Zevgolis, Y.G.; Zotou, S.; Iliou, A.; Christopoulos, A. Subterranean to submarine: Stress-induced locomotor repertoire expansion and aquatic escape in the Anatolian mole rat (Nannospalax xanthodon) under risk of predation. J. Ethol. 2024, 43, 39–43. [Google Scholar] [CrossRef]
  57. HNMS. Climatic Data for Selected Stations in Greece. Available online: https://www.emy.gr/en/climatic-data?tab=statistics-tab (accessed on 15 December 2024).
  58. Kosmas, C.; Danalatos, N.G.; Poesen, J.; Van Wesemael, B. The effect of water vapour adsorption on soil moisture content under Mediterranean climatic conditions. Agric. Water Manag. 1998, 36, 157–168. [Google Scholar] [CrossRef]
  59. Zevgolis, Y.G.; Kouris, A.; Christopoulos, A. Spatiotemporal Patterns and Road Mortality Hotspots of Herpetofauna on a Mediterranean Island. Diversity 2023, 15, 478. [Google Scholar] [CrossRef]
  60. Frafjord, K. Winter range of a red fox (Vulpes vulpes) group in a northern birch forest. Mamm. Biol. 2004, 69, 342–348. [Google Scholar] [CrossRef]
  61. Geiser, F. Seasonal Expression of Avian and Mammalian Daily Torpor and Hibernation: Not a Simple Summer-Winter Affair. Front. Physiol. 2020, 11, 434. [Google Scholar] [CrossRef]
  62. Rutovskaya, M.V.; Diatroptov, M.E.; Kuznetzova, E.V.; Anufriev, A.I.; Feoktistova, N.Y.; Surov, A.V. The Dynamics of Body Temperature of the Eastern European Hedgehog (Erinaceus roumanicus) during Winter Hibernation. Biol. Bull. 2019, 46, 1136–1145. [Google Scholar] [CrossRef]
  63. Enukidze, G.P. On the biology of the Transcaucasian squirrel. Soobshcheniia Akad. Nauk Gruz. 1960, 17, 101–123. [Google Scholar]
  64. Zevgolis, Y.G.; Kouris, A.D.; Christopoulos, A.; Leros, M.; Loupou, M.; Rammou, D.-L.; Youlatos, D.; Troumbis, A.Y. Where to Protect? Spatial Ecology and Conservation Prioritization of the Persian Squirrel at the Westernmost Edge of Its Distribution. Land 2025, 14, 876. [Google Scholar] [CrossRef]
  65. Herr, J.; Schley, L.; Engel, E.; Roper, T.J. Den preferences and denning behaviour in urban stone martens (Martes foina). Mamm. Biol. 2010, 75, 138–145. [Google Scholar] [CrossRef]
  66. Zub, K.; Sönnichsen, L.; Szafrańska, P.A. Habitat requirements of weasels Mustela nivalis constrain their impact on prey populations in complex ecosystems of the temperate zone. Oecologia 2008, 157, 571–582. [Google Scholar] [CrossRef]
  67. Kidawa, D.; Kowalczyk, R. The effects of sex, age, season and habitat on diet of the red fox Vulpes vulpes in northeastern Poland. Acta Theriol. 2011, 56, 209–218. [Google Scholar] [CrossRef]
  68. Zevgolis, Y.G.; Sazeides, C.I.; Bintsi-Frantzi, E.; Kouris, A.D.; Christopoulos, A. Ecological implications of deep pruning: A case report on Persian squirrel nesting in a centennial olive grove on the island of Lesvos, Greece. Hist. Nat. Bulg. 2024, 46, 89–97. [Google Scholar] [CrossRef]
  69. Markowitz, H.M. Portfolio Selection: Efficient Diversification of Investments, 2nd ed.; Basil Blackwell: Oxford, UK, 1959; ISBN 978-1-55786-108-5. [Google Scholar]
  70. Zannetos, S.P.; Zevgolis, Y.G.; Christopoulos, A.; Akriotis, T. Assessing habitat suitability of the Persian Squirrel in the island of Lesvos, Greece. Hystrix Ital. J. Mammal. 2022, 33, 193–197. [Google Scholar]
  71. Zevgolis, Y.G.; Christopoulos, A.; Kalargalis, I.I.; Zannetos, S.P.; Botetzagias, I.; Dimitrakopoulos, P.G. An (Un)Expected Threat for a Regionally Near-Threatened Species: A Predation Case of a Persian Squirrel on an Insular Ecosystem. Animals 2022, 13, 24. [Google Scholar] [CrossRef]
  72. Loumou, A.; Giourga, C.; Dimitrakopoulos, P.; Koukoulas, S. Tourism Contribution to Agro-Ecosystems Conservation: The Case of Lesbos Island, Greece. Environ. Manag. 2000, 26, 363–370. [Google Scholar] [CrossRef]
  73. Gaganis, C.M.; Troumbis, A.Y. Bayesian Inference of Human-Made Hazards in Networks of Island Wetlands: The Case of the Aegean Archipelago. Diversity 2025, 17, 54. [Google Scholar] [CrossRef]
  74. Mosse, C. Sappho of Lesbos. Histoire 1984, 63, 20–23. [Google Scholar]
  75. Zouros, N.C. The Miocene Petrified Forest of Lesvos, Greece: Research and Geoconservation Activities. Geoconservation Res. 2021, 4. [Google Scholar] [CrossRef]
  76. ELSTAT. Human Road Mortality Toll 2007–2022. Available online: https://www.statistics.gr/el/statistics/-/publication/SDT03/-A2102_STD04_TS_MM_00_2007_00-2023_F_GR (accessed on 8 February 2025).
  77. Lantremange, H. Functionalism in ecology and economics: Epistemological affinities and temptations. Biol. Conserv. 2024, 298, 110762. [Google Scholar] [CrossRef]
  78. Geldmann, J.; Coad, L.; Barnes, M.; Craigie, I.D.; Hockings, M.; Knights, K.; Leverington, F.; Cuadros, I.C.; Zamora, C.; Woodley, S.; et al. Changes in protected area management effectiveness over time: A global analysis. Biol. Conserv. 2015, 191, 692–699. [Google Scholar] [CrossRef]
  79. Langhammer, P.F.; Bull, J.W.; Bicknell, J.E.; Oakley, J.L.; Brown, M.H.; Bruford, M.W.; Butchart, S.H.M.; Carr, J.A.; Church, D.; Cooney, R.; et al. The positive impact of conservation action. Science 2024, 384, 453–458. [Google Scholar] [CrossRef] [PubMed]
  80. Grilo, C.; Borda-de-Água, L.; Beja, P.; Goolsby, E.; Soanes, K.; le Roux, A.; Koroleva, E.; Ferreira, F.Z.; Gagné, S.A.; Wang, Y.; et al. Conservation threats from roadkill in the global road network. Glob. Ecol. Biogeogr. 2021, 30, 2200–2210. [Google Scholar] [CrossRef]
  81. European Commission. Road Safety Statistics in the EU. Available online: https://ec.europa.eu/eurostat/statistics-explained/index.php?oldid=630784 (accessed on 8 February 2025).
Figure 1. A map of Lesvos Island illustrating the main ecosystem types—land uses as well as the primary and secondary road network. Surveys for animal casualties were performed on the primary road network depicted by a solid black line.
Ecologies 06 00042 g001
Figure 2. (A) Evolution of wildlife–vehicle collision data by species, month, and year from 2018 to 2022. Values on the vertical axis represent the number of individuals recorded as wildlife–vehicle collisions during the road surveys. The green background represents the period of strict interdistrict human mobility restrictions imposed to contain the spread of SARS-CoV-2. (B) Comparative trend of total mammal WVC counts versus human road fatalities during the same period. Values represent raw monthly counts.
Ecologies 06 00042 g002
Figure 3. Data on human inter-district mobility prohibition in Greece (and Lesvos Island) according to the Oxford COVID-19 Government Response database.
Ecologies 06 00042 g003
Figure 4. The procedure for calculating the expected casualties and the casualty risk (standard deviation) of animal road mortality during wildlife–vehicle collision (WVC) events on Lesvos Island. The data used are real and correspond to the lockdown period of 2020 (see the text for details). Panel (a) presents actual mortality data for five species: Vulpes vulpes (Vv), Martes foina (Mf), Erinaceus roumanicus (Er), Mustela nivalis (Mn), and Sciurus anomalus (Sa) over each of the six months of strict human mobility restrictions in 2020. These data provide specific weights per species for calculating the realized casualties and the realized standard deviation (risk). Panel (b) displays randomized weights per species using a similar procedure. Excel functions used to calculate the randomized weights, variance-covariance matrix, expected casualties, and standard deviation are included in the figure with a gray background under each procedural step.
Ecologies 06 00042 g004
Figure 5. The procedure for calculating the expected casualties, the confidence limits, and the point estimate of a probability (peP) range of confidence (expressed in %) of a casualty risk of animal road mortality during wildlife–vehicle collision (WVC) events on Lesvos Island. The data used are real and correspond to the average value of road-killed Vulpes vulpes (Vv) during a year without traffic restrictions.
Ecologies 06 00042 g005
Figure 6. WVC maps for individual mammalian species in Lesvos Island, during the observation period 2018–2022. (A): Vulpes vulpes; (B): Martes foina; (C): Mustela nivalis; (D): Erinaceus roumanicus; (E): Sciurus anomalus. Panel (F) presents the synthesis of the five species, indicating in red the cold-spot area where no WVC have been recorded (following our monitoring method). All panels reflect survey data collected across the full 488.67 km of the primary road network during each of the 135 surveys (2018–2022); spatial coverage was constant across years.
Ecologies 06 00042 g006
Figure 7. Simulation results of expected monthly WVC versus associated variability for the multi-species mammalian assemblage recorded on Lesvos Island (2018–2022). Panel (A) depicts simulation outputs during the national lockdown period (2020), while Panel (B) reflects the period of normal human mobility (2018–2019, 2021–2022). Each blue point represents a simulated outcome. Red lines intersect at the centroid of each distribution, marking the mean expected casualties and their mean variability across simulations. The marked shift in centroid location illustrates the increased frequency and volatility of WVC events when mobility restrictions were lifted.
Ecologies 06 00042 g007
Figure 8. The results of 103 simulations of the Poisson process for wildlife–vehicle collisions (WVCs) involving mammalian species on Lesvos Island from 2018 to 2022 are presented. Panel (A) shows the cumulative relative frequency distribution for species that are highly vulnerable to WVCs, while Panel (B) displays the cumulative relative frequency distribution for species with low vulnerability to WVCs. The time unit used for these Poisson process simulations is one month.
Ecologies 06 00042 g008
Table 1. Mammalian species of Lesvos Island (scientific and common names) and their main behavioral traits. Data were compiled from peer-reviewed sources, species-specific ecological studies, and—where explicitly noted—from personal field observations by the authors *.
Scientific NameCommon NameAverage Habitat Range * (km2)Distance of Roaming * (km)Speed (km/h)Population Density *
(ind/km2)
References
Vulpes vulpesRed fox5.5–13 (rich habitats)
21–52 (poorer habitats)
10–15~50 (bursts)5–6
3–5
[60,67]
Martes foinaStone marten1.3–5.2 (females)
2.6–13 (males)
Several km/night~24 (bursts)10–12[65]
Erinaceus roumanicusNorthern White-breasted
Hedgehog
0.1–0.2Several km/night~610–15[62]
Mustela nivalisWeasel0.01–0.1Several km (diurnal)~250.5–1[66]
Sciurus anomalusPersian squirrel0.01–0.020.5 (diurnal)~202–4[64,68]
Table 2. Summary statistics from Poisson process models estimating monthly WVC events per species on Lesvos Island (2018–2022), including the mean number of monthly WVCs, model error, and 95% confidence intervals.
SpeciesAverageMSELow 95% CIHigh 95% CI
Vulpes vulpes60.07786.07156.224
Martes foina4.320.06734.18814.320
Erinaceus roumanicus3.2940.05713.18213.294
Mustela nivalis10.03250.93631.000
Sciurus anomalus0.5320.02400.48490.532
Table 3. Predicted probabilities and ranges based on the Poisson process simulations. Reported values include the probability of more than one WVC in a given month (p > 1) and the probability of exceeding the species-specific average (p > average), with associated 95% predicted ranges (PR).
Speciesp > 1Low 95% PRHigh 95% PRp > AverageLow 95% PRHigh 95% PR
Vulpes vulpes0.00356.22396.22410.56500.56440.5656
Martes foina0.0114.31984.32020.56900.56840.5696
Erinaceus roumanicus0.03253.29373.29400.59300.59240.5936
Mustela nivalis0.37950.99931.00000.37950.37880.3802
Sciurus anomalus0.29850.53120.53200.29850.29770.2993
Disclaimer/Publisher’s Note: The statements, opinions and data contained in all publications are solely those of the individual author(s) and contributor(s) and not of MDPI and/or the editor(s). MDPI and/or the editor(s) disclaim responsibility for any injury to people or property resulting from any ideas, methods, instructions or products referred to in the content.

