Article

Assessing Habitat Suitability and Overlap for South China Sika Deer and Sympatric Ungulates

1
School of Resources and Environmental Engineering, Anhui University, Hefei 230601, China
2
School of Life Science, Jiangxi Normal University, Nanchang 330022, China
3
Anhui Province Key Laboratory of Wetland Ecosystem Protection and Restoration, Anhui University, Hefei 230601, China
*
Author to whom correspondence should be addressed.
Ecologies 2025, 6(2), 41; https://doi.org/10.3390/ecologies6020041
Submission received: 14 April 2025 / Revised: 15 May 2025 / Accepted: 17 May 2025 / Published: 3 June 2025

Abstract

:
Identifying suitable habitats and quantifying the spatial overlap among sympatrically distributed ungulates is essential for safeguarding their long-term survival. We deployed infrared cameras to capture the distribution sites of sika deer (Cervus nippon), Reeve’s muntjac (Muntiacus reevesi), and wild boar (Sus scrofa) in the Taohongling Sika Deer National Nature Reserve (TNNR) and measured nine environmental factors. Based on this, we applied MaxEnt modeling to assess the species’ habitat suitability and applied the Pianka index to evaluate niche overlap. The results showed that the sika deer occupied the smallest area of high-suitability habitat (53.85 km2, 11.13% of the study area), primarily concentrated in the core zone of the TNNR. Specifically, 37.86% of the sika deer’s high-suitability habitat overlapped with wild boar and 29.06% overlapped with Reeve’s muntjac. Pianka index analysis revealed substantial spatial niche overlap between sika deer and Reeve’s muntjac (0.487) but limited overlap between sika deer and wild boar (0.160). Our findings indicate substantial overlap between sika deer and sympatric species. To effectively protect the sika deer in the TNNR, we recommend increasing the number of monitoring sites, implementing habitat improvement measures (e.g., vegetation restoration and water supplementation stations), and establishing isolation corridors to enhance habitat connectivity.

1. Introduction

Habitat is crucial for wildlife’s reproduction and development and closely linked to species extinction rates [1]. It is defined as the environment in which a species can survive and reproduce and is fundamental to maintaining the life activities of individual organisms, populations, and communities [2,3]. However, the ongoing fragmentation of habitats has led to a marked increase in the threat to biodiversity. Haddad’s experiments showed habitat fragmentation causes a lasting loss of biodiversity and ecosystem dysfunction, with effects persisting for decades [4]. Habitat loss and fragmentation negatively impact biodiversity by causing food shortages and increasing inbreeding and reproductive isolation [5,6]. Animal habitat assessments are critical to wildlife conservation, as assessment results are essential for informing effective conservation management efforts [7,8].
Different species exhibit varied patterns of habitat use based on their unique habits and breeding patterns [9]. The probability of habitat overlap between species with analogous ecological niches is notably increased by their concurrent distribution within the same geographical area. In terms of resource use, sympatric species may face competition for critical resources such as food and water, which may require some species to adjust their foraging strategies, such as changing the time or place of foraging [10]. From the perspective of population dynamics, habitat overlap may cause corresponding changes in population growth rates, mortality rates, and migration patterns [11]. For species with analogous ecological niches, this habitat overlap can reflect the potential pressures and challenges they face in their struggle for survival [12,13].
In recent years, habitat suitability modeling (e.g., MaxEnt) has become a standard tool for predicting species distributions based on environmental variables and evaluating habitat suitability [14,15]. Previous studies have used the MaxEnt model to examine the effects of food availability, food quality, and animal size on habitat selection, thereby elucidating the mechanisms of resource allocation and coexistence among species sharing the same habitat [16]. Additionally, some researchers have integrated future climate projections with species distribution models to analyze and predict potential habitat shifts under changing environmental conditions [17].
As a Key Protected Wild Animal Species in China, the sika deer plays a crucial ecosystem role by browsing understory vegetation and thereby shaping plant communities, promoting forest regeneration, and creating microhabitats [18]. Originally, six wild sika deer subspecies existed in China, but only the Northeast (Cervus nippon mandarinus), Sichuan (Cervus nippon sichuanicus), and South China (Cervus nippon kopschi) remain [19,20]. As the largest distribution area of South China sika deer, the Taohongling Sika Deer National Nature Reserve (TNNR) has supported local population recovery through core-zone protection and the restoration of vegetation [10]. As a result, the sika deer population in the TNNR has increased from approximately 60 individuals in 1983 to 674 in 2023 [21,22].
However, non-targeted conservation policies may indirectly promote the population growth of sympatric ungulates, intensifying habitat overlap. Focusing solely on keystone species is insufficient for comprehensive conservation; sympatric species must also be considered [23]. Habitat selection differences underpin the coexistence of sympatric species, which often exhibit divergent diets and activity patterns to minimize competition [24]. Various interactions that exist between species are likely to affect the population size and distribution of keystone species [25]. Thus, understanding the status of habitat selection between target species and sympatric species is essential for designing effective management strategies [26].
In this study, we used MaxEnt modeling and niche overlap analysis to evaluate habitat suitability and spatial distribution overlap among sympatric ungulates, including sika deer, Reeves’s muntjac (Muntiacus reevesi), and wild boar (Sus scrofa). We hypothesize that sika deer may occupy relatively smaller areas of high-suitability habitat compared to Reeves’s muntjac and wild boars in and around the TNNR, given their sensitivity to human disturbance and environmental variability [27]. Additionally, considering that the core area of the reserve typically represents an optimal habitat capable of supporting the survival requirements of multiple species, we hypothesize that the reserve’s core area is likely to have significant habitat overlap among these species [28].

2. Materials and Methods
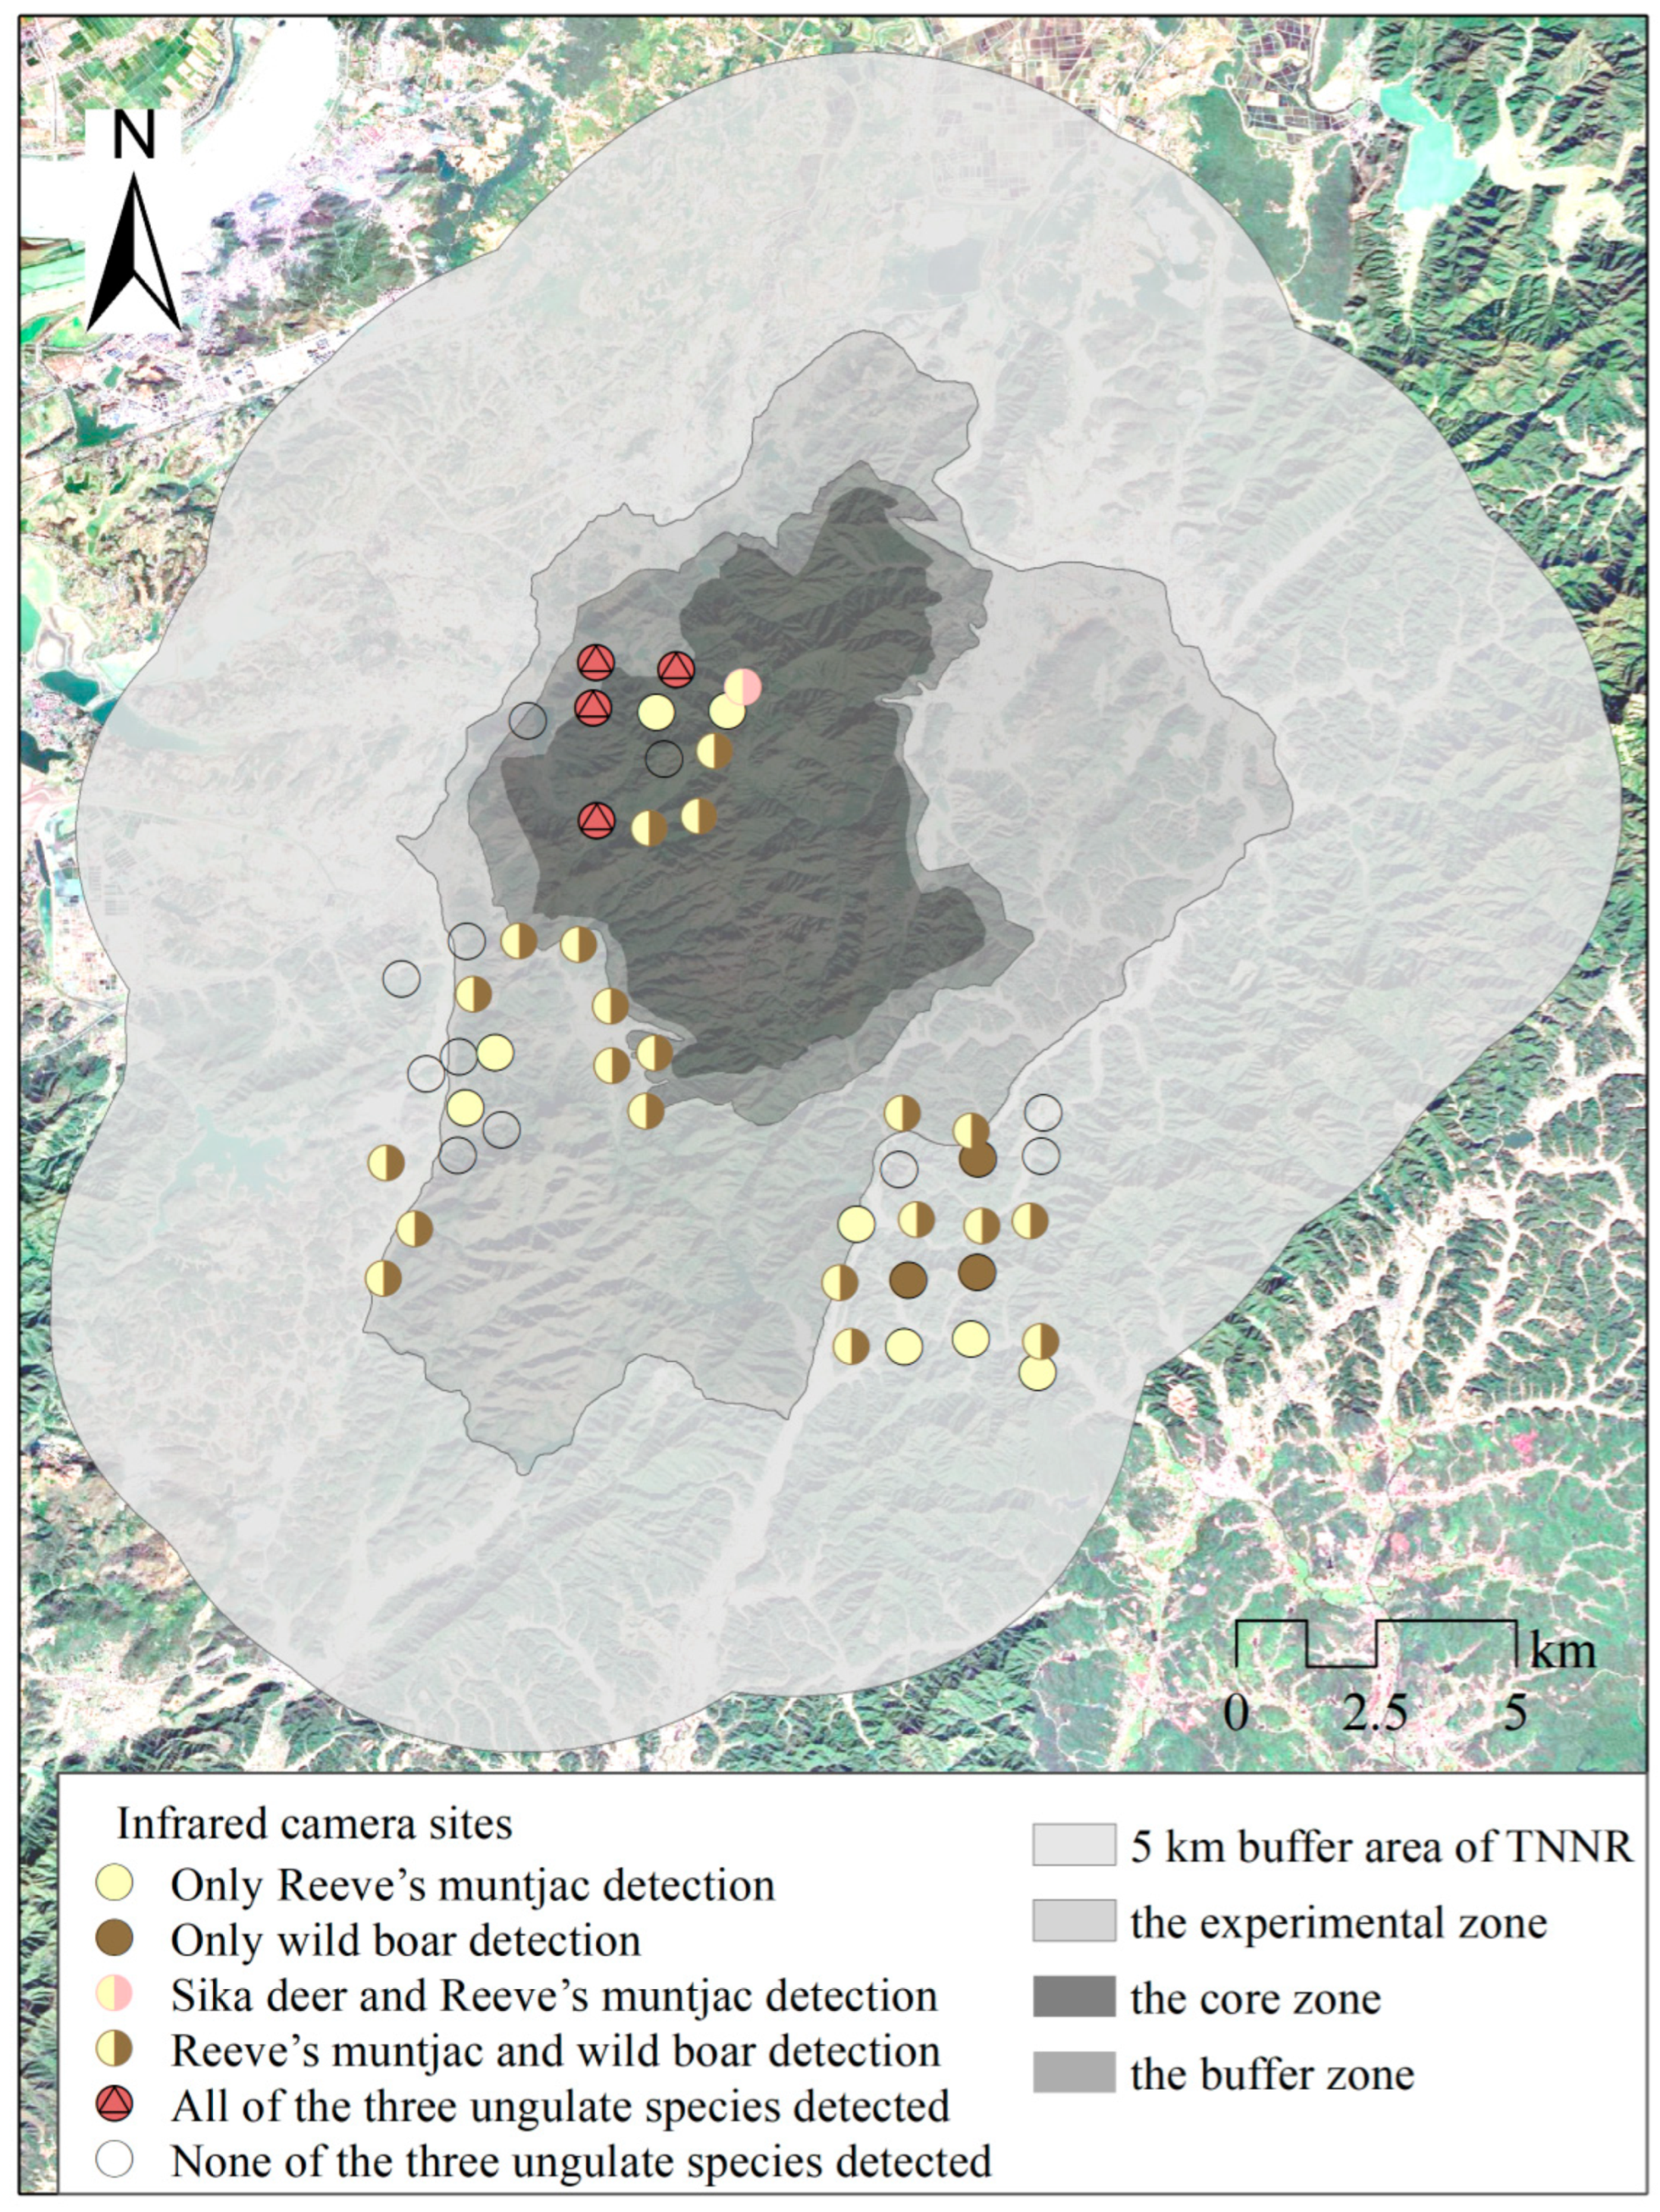
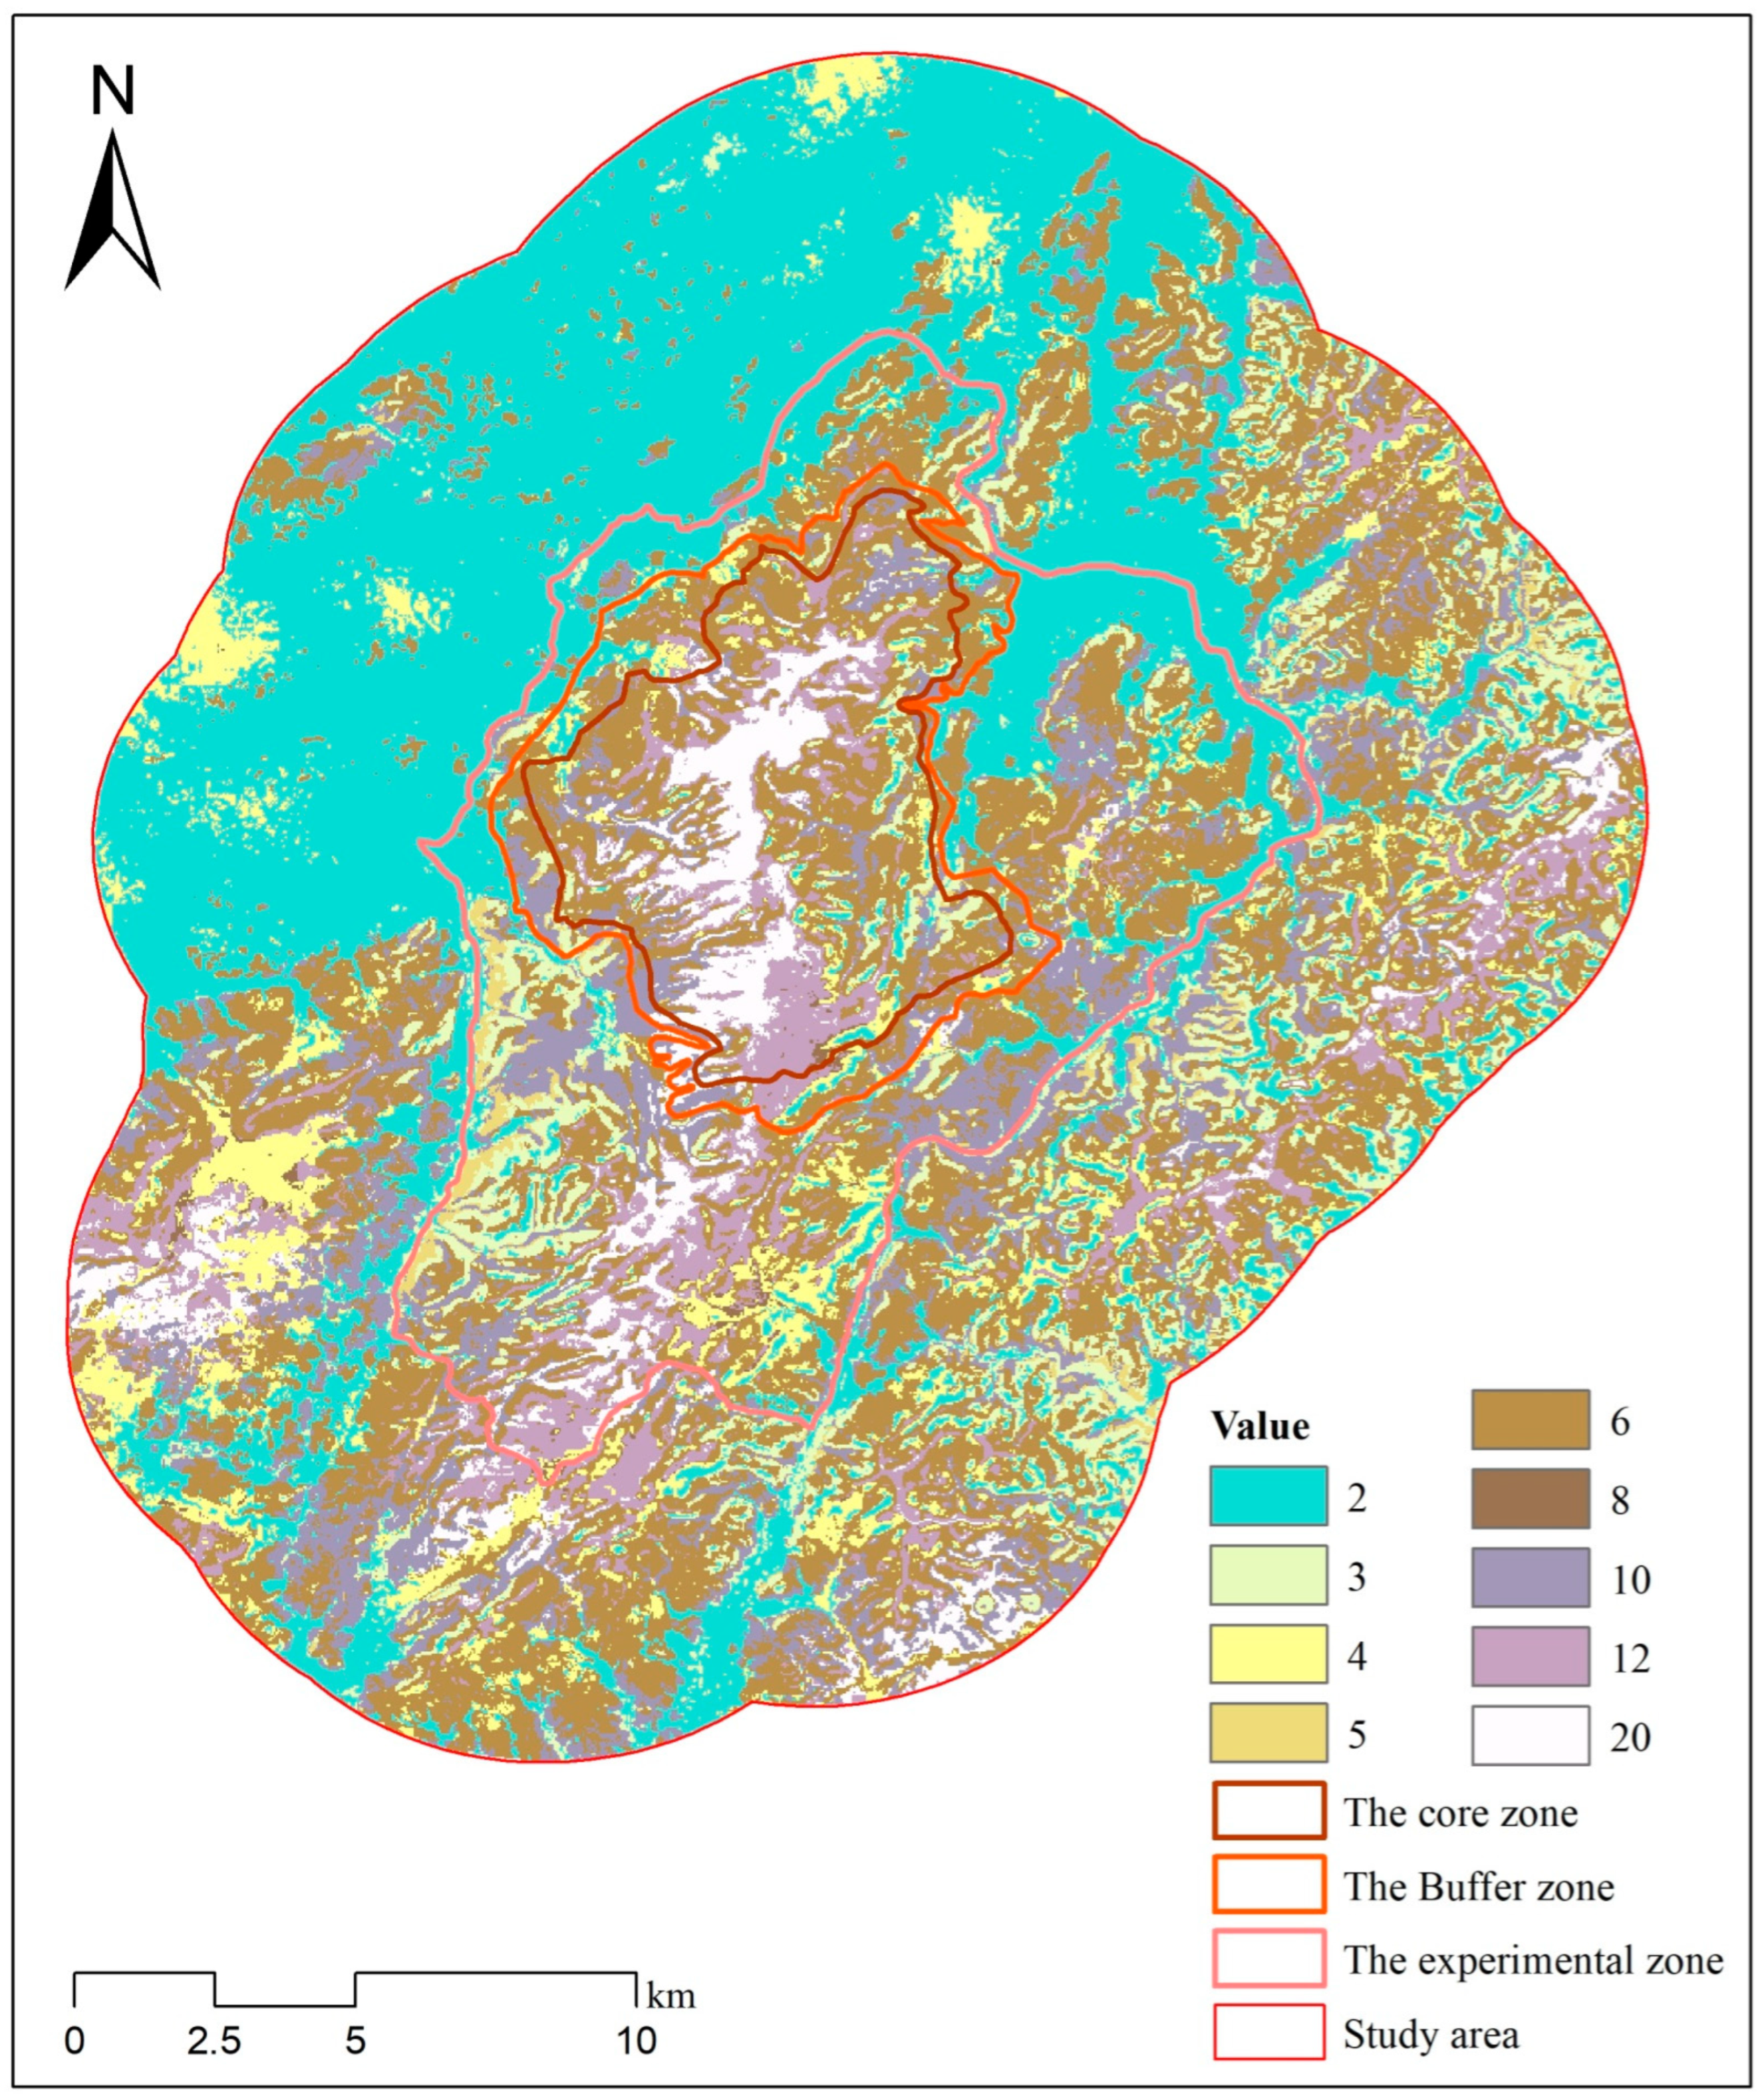
2.1. Study Area

This study was conducted in the TNNR and within a 5 km radius of its boundaries, located in Pengze County on the southern shore of the middle to lower reaches of the Yangtze River (Figure 1). The TNNR belongs to the national nature reserve of wild animals type, and it mainly protects the southern subspecies of sika deer and its habitat. The South China sika deer is an endangered subspecies, and the TNNR is its largest remaining habitat. The total area of the TNNR is 1.25 × 10⁴ ha, including 2.67 × 10³ ha in the core zone, which is strictly protected as an undisturbed wildlife habitat; 1.83 × 10³ ha in the buffer zone, which surrounds the core zone and allows for limited research and monitoring activities; and 8.00 × 10³ ha in the experimental zone, where educational and sustainable resource use activities are permitted. The area is predominantly mountainous, with elevations ranging from 300 to 500 m and the highest peak, Maoyingwo, reaching 536.6 m. The area lies within the subtropical monsoon climate zone, characterized by four distinct seasons, diverse plant resources, and complex zonal vegetation; the dominant vegetation is shrub–grassland [22].

2.2. Species Occurrences

In the study area, we used a Geographic Information System (GIS) and kilometer grid method to divide it into a 1 km × 1 km grid. Considering factors such as elevation, vegetation type, human disturbance, and species distribution, we selected locations for infrared camera deployment. We identified three observation areas, each consisting of 20 consecutive grids; each grid was equipped with one infrared camera, with a minimum distance of 500 m between cameras in different grids. Among them, 40 cameras were placed within the protected area and 20 around it, yielding 49 effective species detection sites (Figure 2). Among them, 13 infrared cameras were deployed in the core zone and buffer area, which were well protected, and 11 valid detection sites were obtained. More detailed information on the survey method can be found in [10]. This method ensures that the data collected comprehensively reflect the environmental variation, such as elevation gradients, thereby minimizing potential biases from the data collection. After filtering invalid data, 7376 photos of the three ungulates were captured by the infrared cameras, including 1704 independent detections.
The collected species occurrence sites were summarized separately, divided into three columns according to the order of species name, longitude, and latitude, and entered into Excel tables successively and saved in the CSV format required for MaxEnt modeling.

2.3. Environmental Factors

We followed previous studies on ungulates’ habitat selection and spatial distribution to determine the factors used in the habitat suitability analysis [29,30]. Specifically, 10 variables were selected and were categorized into three groups: terrain factor, human disturbance factor, and vegetation factor [31].
Elevation data were derived from a Digital Elevation Model (DEM) with a 30 m resolution, downloaded from the Geospatial Data Cloud (http://www.gscloud.cn, accessed on 12 September 2024). The variables of slope, aspect, curvature, and topographic relief (RFi) were extracted from DEM data using the surface analysis tool of spatial analysis in ArcGIS 10.8. The land cover data are from the China Land Cover Dataset from 1990 to 2020 on the Google Earth Engine platform. The pixel size is 30 m, and the land cover types are divided into 7 categories: farmland, forest, shrub, grassland, water body, bare land, and impervious surface [32]. Landsat 8 OLI remote sensing images, downloaded from the Geospatial Data Cloud (http://www.gscloud.cn/, accessed on 12 September 2024), were radiometrically calibrated using ENVI 5.3, and Band Math was applied to calculate the Normalized Difference Vegetation Index (NDVI). Vector data of the water system (1:250,000) were downloaded from the National Geographic Information Resources Catalog Service system (http://www.webmap.cn/, accessed on 13 September 2024), and the corresponding Euclidean distance was extracted by the ArcGIS 10.8 spatial analysis tool to obtain the distance of the water source. The human footprint index (HPF) was obtained from the Global Human Footprint (GHF) dataset released by the Urban Environmental Monitoring and Modeling (UEMM) team of the College of Land Science and Technology, China Agricultural University. Road network data were downloaded from OpenStreetMap (http://www.openstreetmap.org, accessed on 13 September 2024), and the road distance was calculated using the Euclidean distance tool in ArcGIS 10.8.
Many environmental factors are spatially correlated. Linear correlations between independent factors, known as multicollinearity, can lower the predictive accuracy of models. To address this, we used the Band Collection Statistics tool in ArcGIS 10.8 to perform a spatial correlation analysis on all environmental variables. For pairs of variables with a correlation coefficient r exceeding 0.8 in absolute value, we discarded the less relevant variable to the habitat suitability model, such as topographic relief. Ultimately, 9 environmental factors were selected for subsequent analysis (Table 1). ArcGIS 10.8 was used to standardize the coordinate system of all raster datasets to WGS 1984 UTM Zone 50N with a cell size of 30 m × 30 m and to convert the raster to ASCII format [29].

2.4. Habitat Suitability

MaxEnt is a Java-based species distribution model widely used for ecological niche modeling, especially when occurrence data are limited, as it performs well even with small sample sizes [14,33,34]. We fitted habitat suitability models (HSMs) for sika deer, Reeve’s muntjac, and wild boar under the present scenario using MaxEnt v3.4.4 (https://www.cs.princeton.edu/academics, accessed on 20 September 2024). The species occurrence sites and environmental variables that had been processed and screened were imported into MaxEnt, and the environmental variables were classified according to continuous type and categorical type. In order to ensure the stability of the model, the random test percentage was set to 25%, and the model was repeated 10 times by the bootstrapping method [14]. The output format was set to logistic, while all other settings were set by default: regularization multiplier, 1; max number of background points, 10,000; replicated run type, cross-validate; maximum iterations, 500; and convergence threshold, 0.00001.
The jackknife method and contribution rate of MaxEnt were used to measure the importance of each environmental variable and identify key factors influencing the spatial distribution of sika deer, Reeve’s muntjac, and wild boar. The area under the receiver operating characteristic curve (AUC) was calculated by MaxEnt, and the closer its value was to 1, the higher the accuracy of the model [14].
The MaxEnt output, represented by the Habitat Suitability Index (HSI), ranges from 0 to 1, with higher values indicating a better habitat quality. To better distinguish the level of suitability, the thresholds for classifying suitable and less-suitable habitats were determined using the maximum training sensitivity plus specificity (MTSS) and balance training omission, predicted area, and threshold value (BTPT) methods [15]. Based on species distribution, habitat suitability was classified into three categories—unsuitable, moderately suitable, and highly suitable—using the Reclassify tool in ArcGIS Spatial Analyst [29].

2.5. Spatial Niche Overlap Analysis

2.5.1. Pianka Index

We assessed the spatial overlap among sika deer, Reeve’s muntjac, and wild boar using the Pianka index, which ranges from 0 (no overlap) to 1 (complete overlap) [35,36]. The calculation formula is as follows:
O j k = i = 1 n p i j × p i k i = 1 n p i j 2 × i = 1 n p i k 2
where Pij represents the proportion of independent detection times of species j at camera site i, and Pik represents the proportion of independent detection times of species k at camera site i. In our camera-trap analysis, consecutive images of the same species at a given site are considered independent detections only if they occur at least 30 min apart [37]. We compiled valid photos of different species from all the sites and analyzed the data in R using the “spaa” package to calculate the Pianka index.

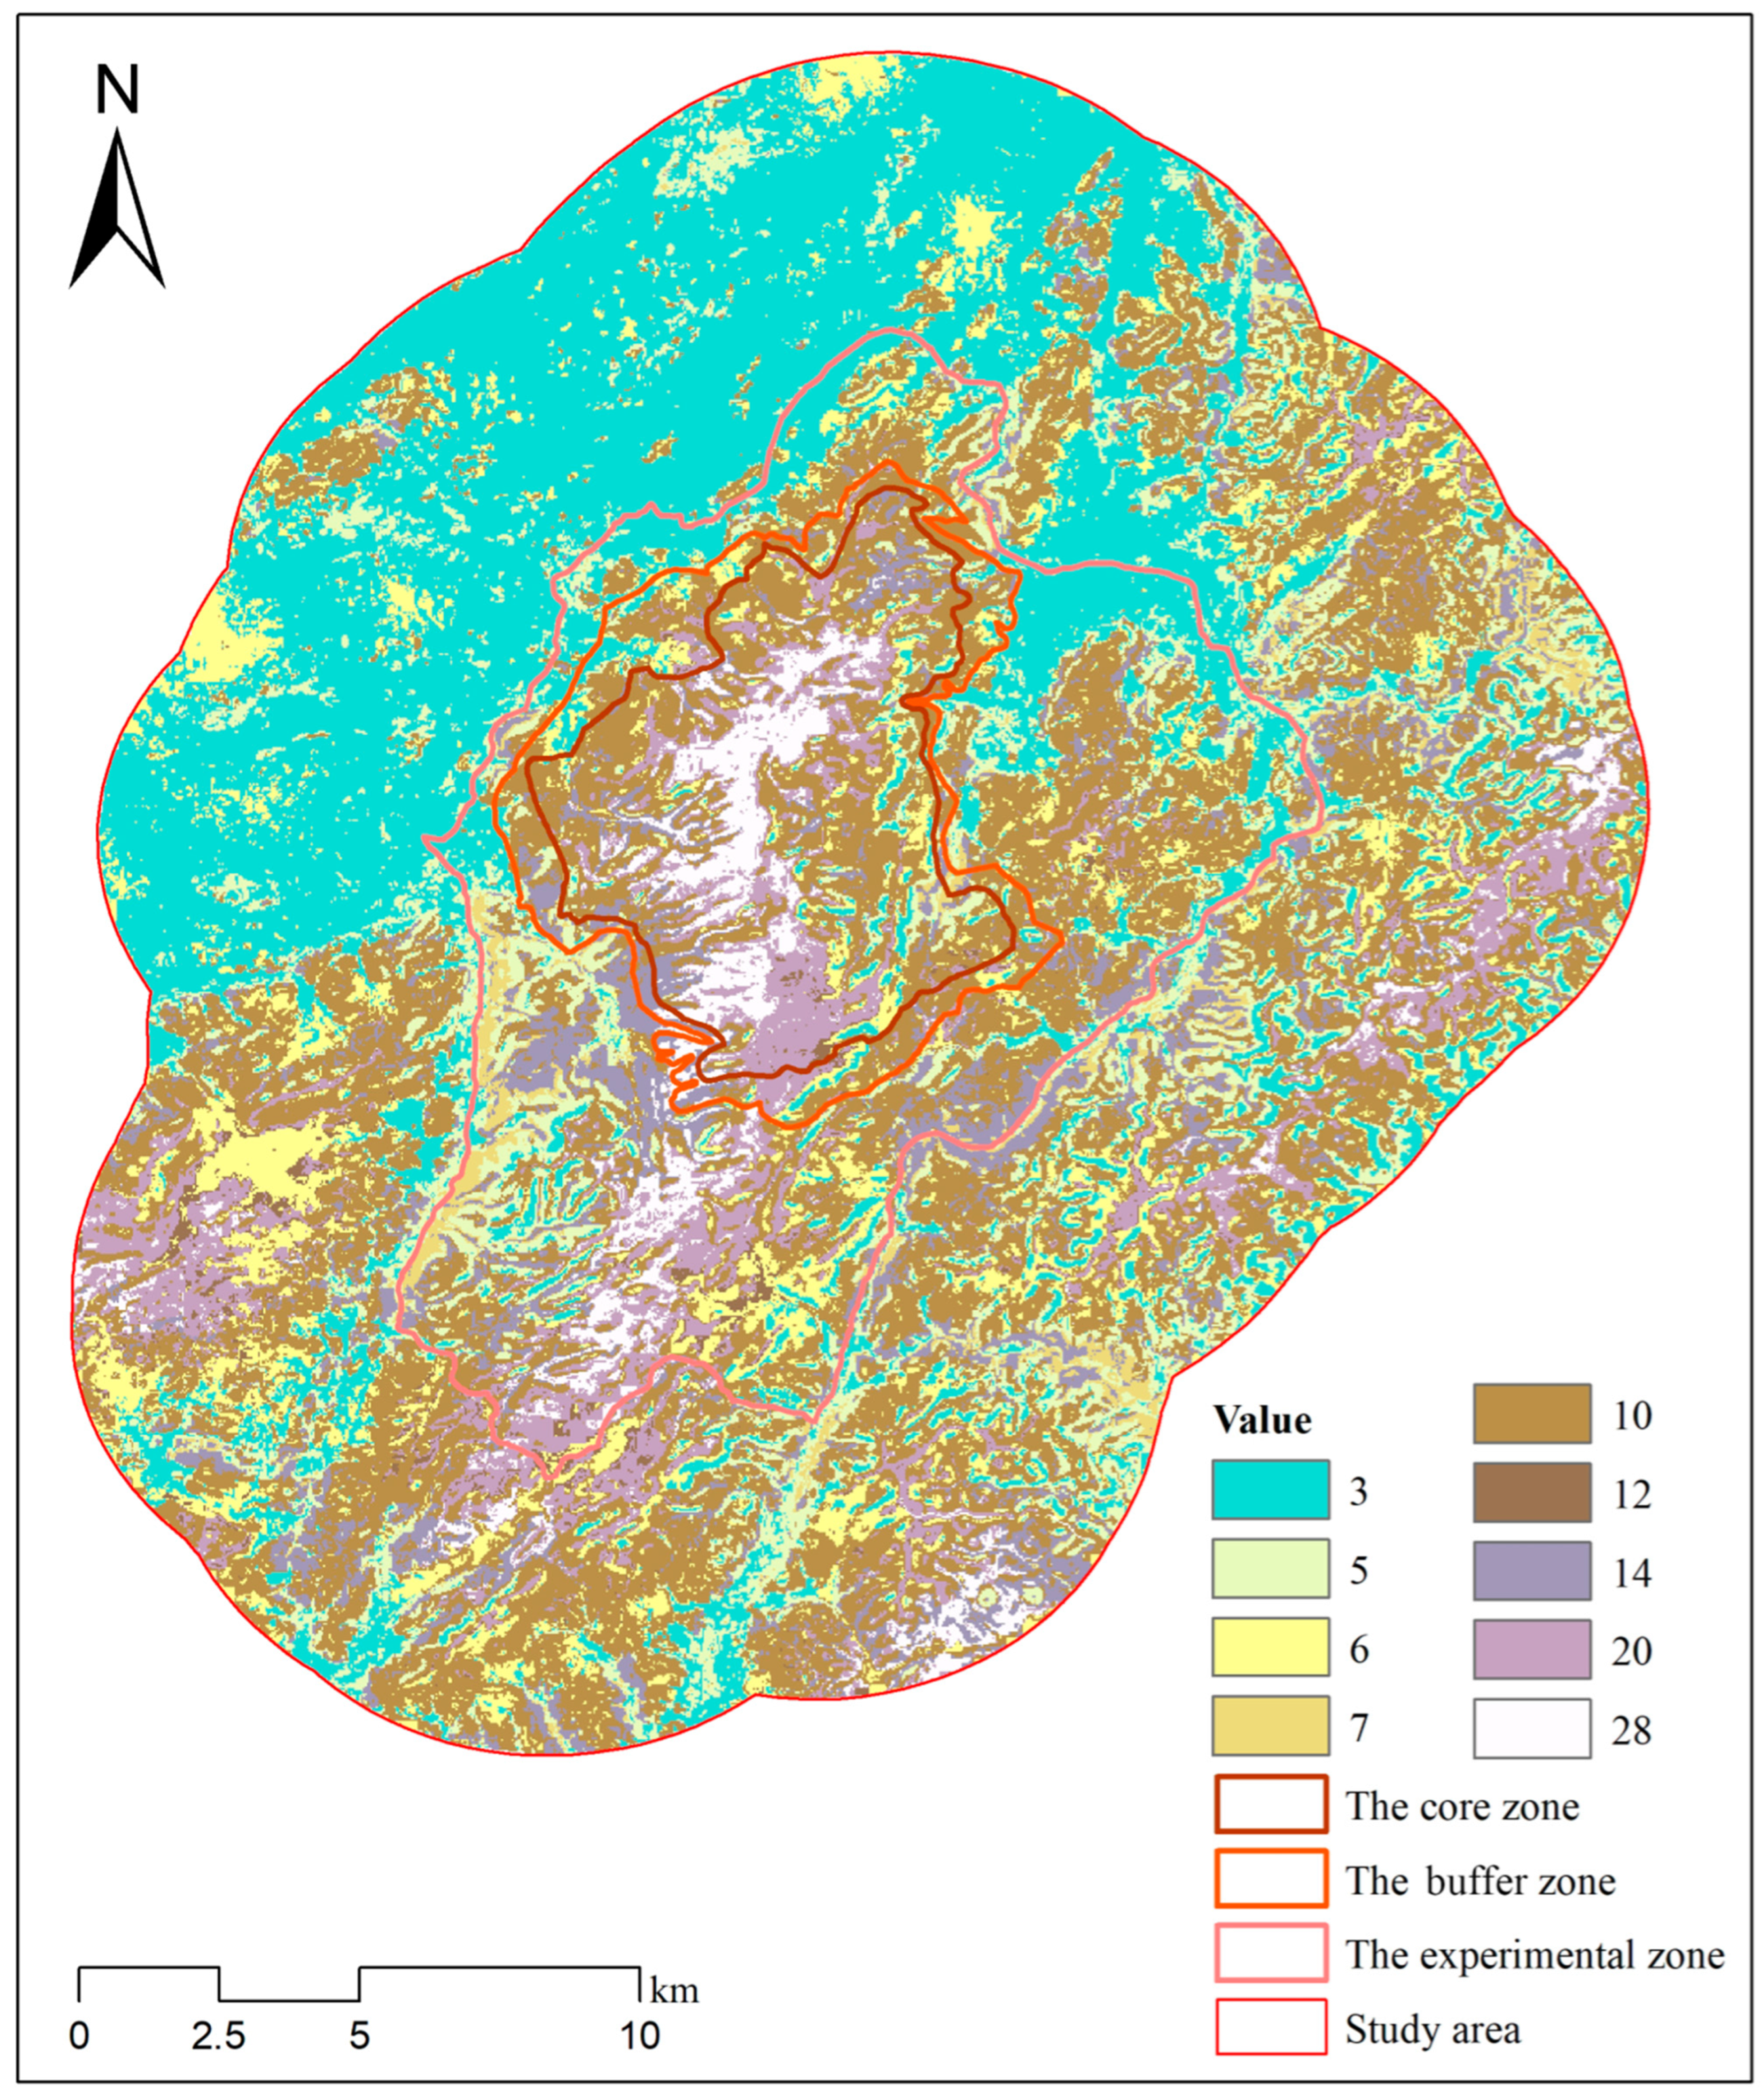
2.5.2. Analysis of Overlapping Habitats with Different Suitability

The sympatric distribution of each ungulate species was analyzed using ArcGIS 10.8. To identify overlapping habitats of a different quality for sika deer, Reeve’s muntjac, and wild boar, suitable habitat types for each species were first classified using the reclassification tool in ArcGIS 10.8. By employing the Raster Calculator toolset in ArcGIS 10.8, we executed multiplicative combinations of habitat suitability layers between sika deer and two sympatric ungulates: Reeve’s muntjac and wild boar.
To avoid numerical ambiguity from multiplicative operations, we developed an independent coding system that ensures each product of habitat values yields a unique identifier for each species pair. We implemented this coding system with a hierarchical habitat suitability classification, assigning distinct prime numbers to each taxon: for sika deer, unsuitable habitat = 1, moderately suitable habitat = 2, highly suitable habitat = 4; for Reeve’s muntjac, unsuitable habitat = 3, moderately suitable habitat = 5, highly suitable habitat = 7; and for wild boar, unsuitable habitat = 2, moderately suitable habitat = 3, highly suitable habitat =5. Therefore, these unique combined values derived from pairwise species multiplications represent overlapping habitats of varying quality. For example, multiplying sika deer’s unsuitable habitat (1) by Reeve’s muntjac’s unsuitable habitat (3) results in a value of 3, indicating areas where both species occupy a low-quality habitat.

3. Result

3.1. Model Performance

After 10 runs of the MaxEnt model, the mean AUCs of the training data sets of sika deer, Reeve’s muntjac, and wild boar were 0.904, 0.916, and 0.906, respectively (Figure 3). The AUC values, all exceeding 0.9, indicate that the MaxEnt model performed well in this analysis and effectively reflects the habitat suitability distribution patterns of the three species in the study area [38,39].

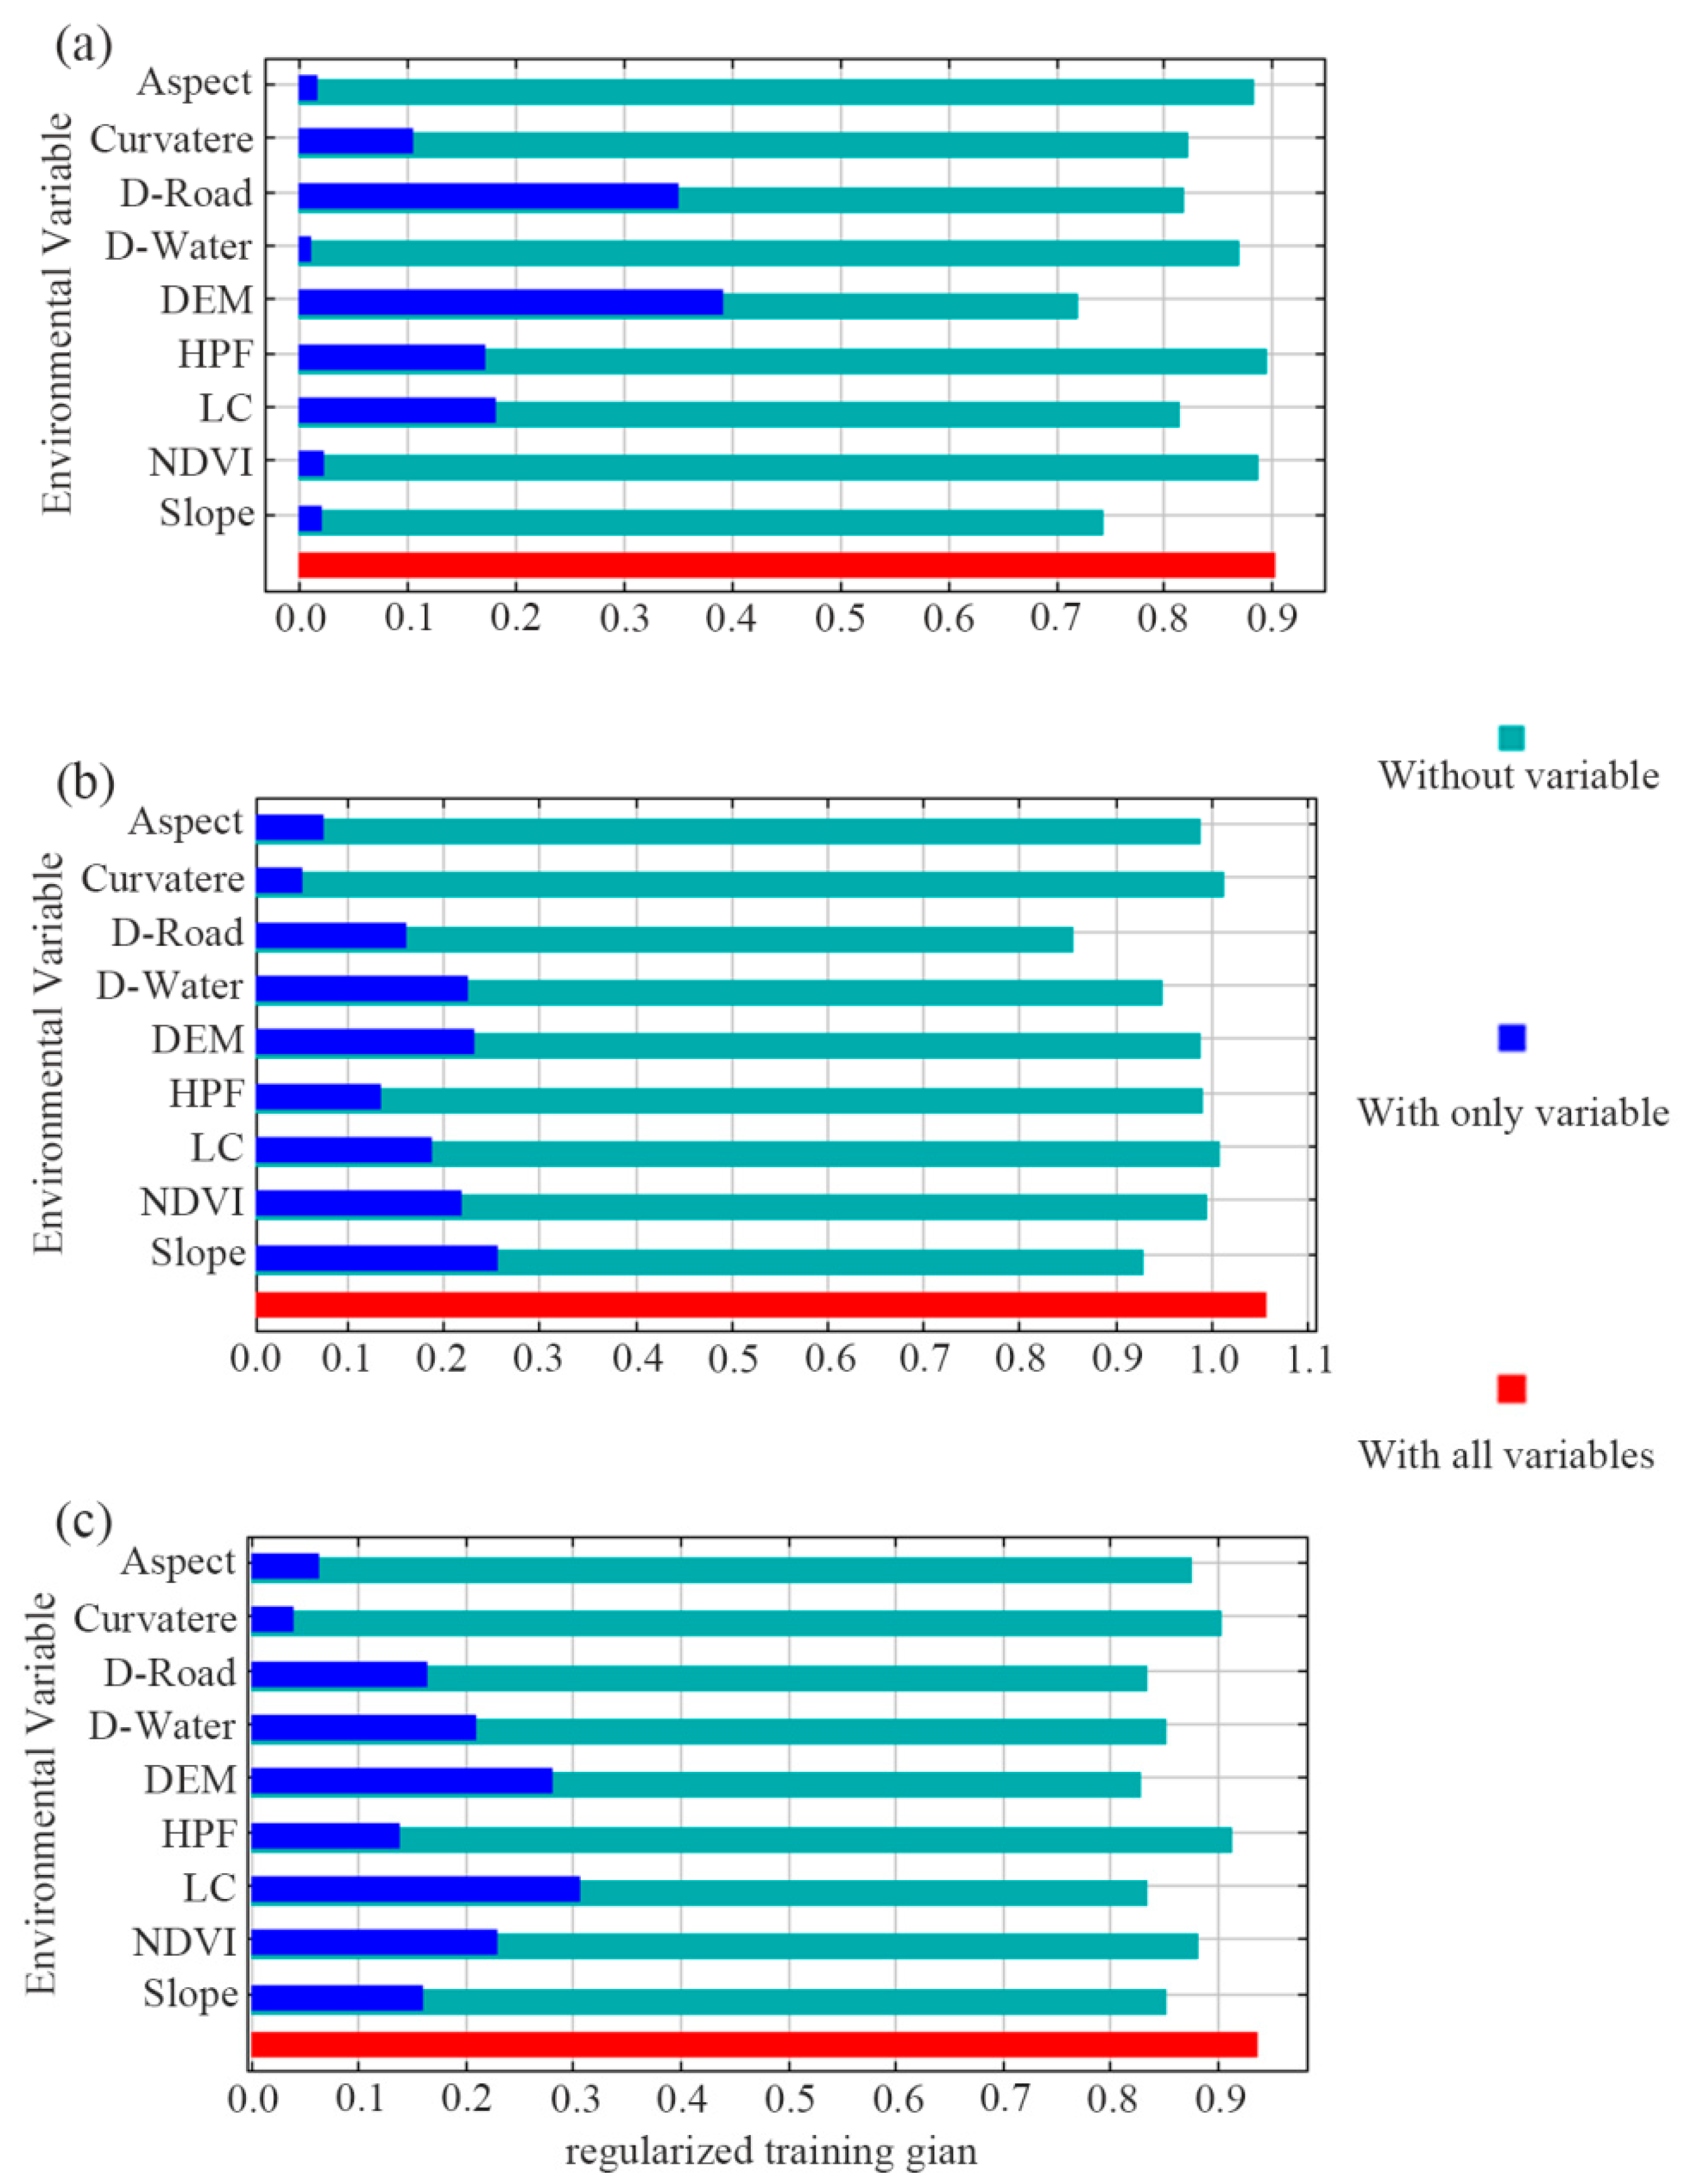
3.2. Effects of Environmental Variables

The variable importance analysis of the MaxEnt model showed that D-Road and DEM contributed more than 20% to the sika deer habitat suitability model. In the habitat suitability analysis of Reeve’s muntjac, slope had the highest contribution. For wild boars, LC showed the greatest contribution compared to other factors. In the habitat suitability models for each species, DEM and D-Road had higher contributions for the sika deer than for Reeve’s muntjac and wild boar, while aspect had a lower contribution. Specifically, in the Sika deer model, DEM contributed 2.5 times more than in Reeve’s muntjac and 1.8 times more than in wild boar. The contribution of D-Road was 1.4 times that in Reeve’s muntjac and 2.2 times that in wild boar. Conversely, aspect’s contribution was only 26% that in Reeve’s muntjac and 28% that in wild boar (Table 2).
The model results tested using a jackknife analysis are shown in the bar chart with only one variable (Figure 4). For sika deer, when the variables were added independently, DEM and D-Road had the highest returns, ranked as DEM > D-Road, with training gains exceeding 0.3. For Reeve’s muntjac, the most informative variables were ranked as slope > DEM > D-Water > NDVI, all with training gains over 0.2. For wild boar, the ranking was LC > DEM > NDVI > D-Water, where LC had a training gain surpassing 0.3.
Conversely, the bar chart titled “without variable” shows that removing DEM, D-Road, and DEM, respectively, caused the largest drop in model performance for sika deer, Reeve’s muntjac, and wild boar (Figure 4). This suggests these variables may contain more unique information than others.
The response curves for individual environmental variables vividly reveal the threshold relationships between these variables and the probability of species occurrence. The peak of each curve denotes the optimal habitat conditions for the species. By integrating the contribution rates of environmental factors to the model and the variables’ benefits to the model, we analyzed the single-factor response curves of the four primary environmental variables (Figure 5). The response curves indicate that not only sika deer but also Reeve’s muntjac and wild boar prefer altitudes ranging from 300 to 500 m. In addition to that, Reeve’s muntjac and wild boar show similar altitudinal preferences, favoring areas between 50 and 200 m above sea level. Habitat suitability for sika deer, Reeve’s muntjac, and wild boar all increases with distance from roads—plateauing beyond 4.2 km—while Reeve’s muntjac additionally exhibits a distinct suitability peak at 200 m. Sika deer show the highest probability of occurrence on gentle slopes, which declines as the slopes’ steepness increases. Meanwhile, Reeve’s muntjac’s and wild boar’s probability of occurrence peaks when slopes range between 5° and 20°. All three species show a marked preference for forest land over other land cover types, yet unlike Reeve’s muntjac and wild boar, sika deer show no particular affinity for grassland.

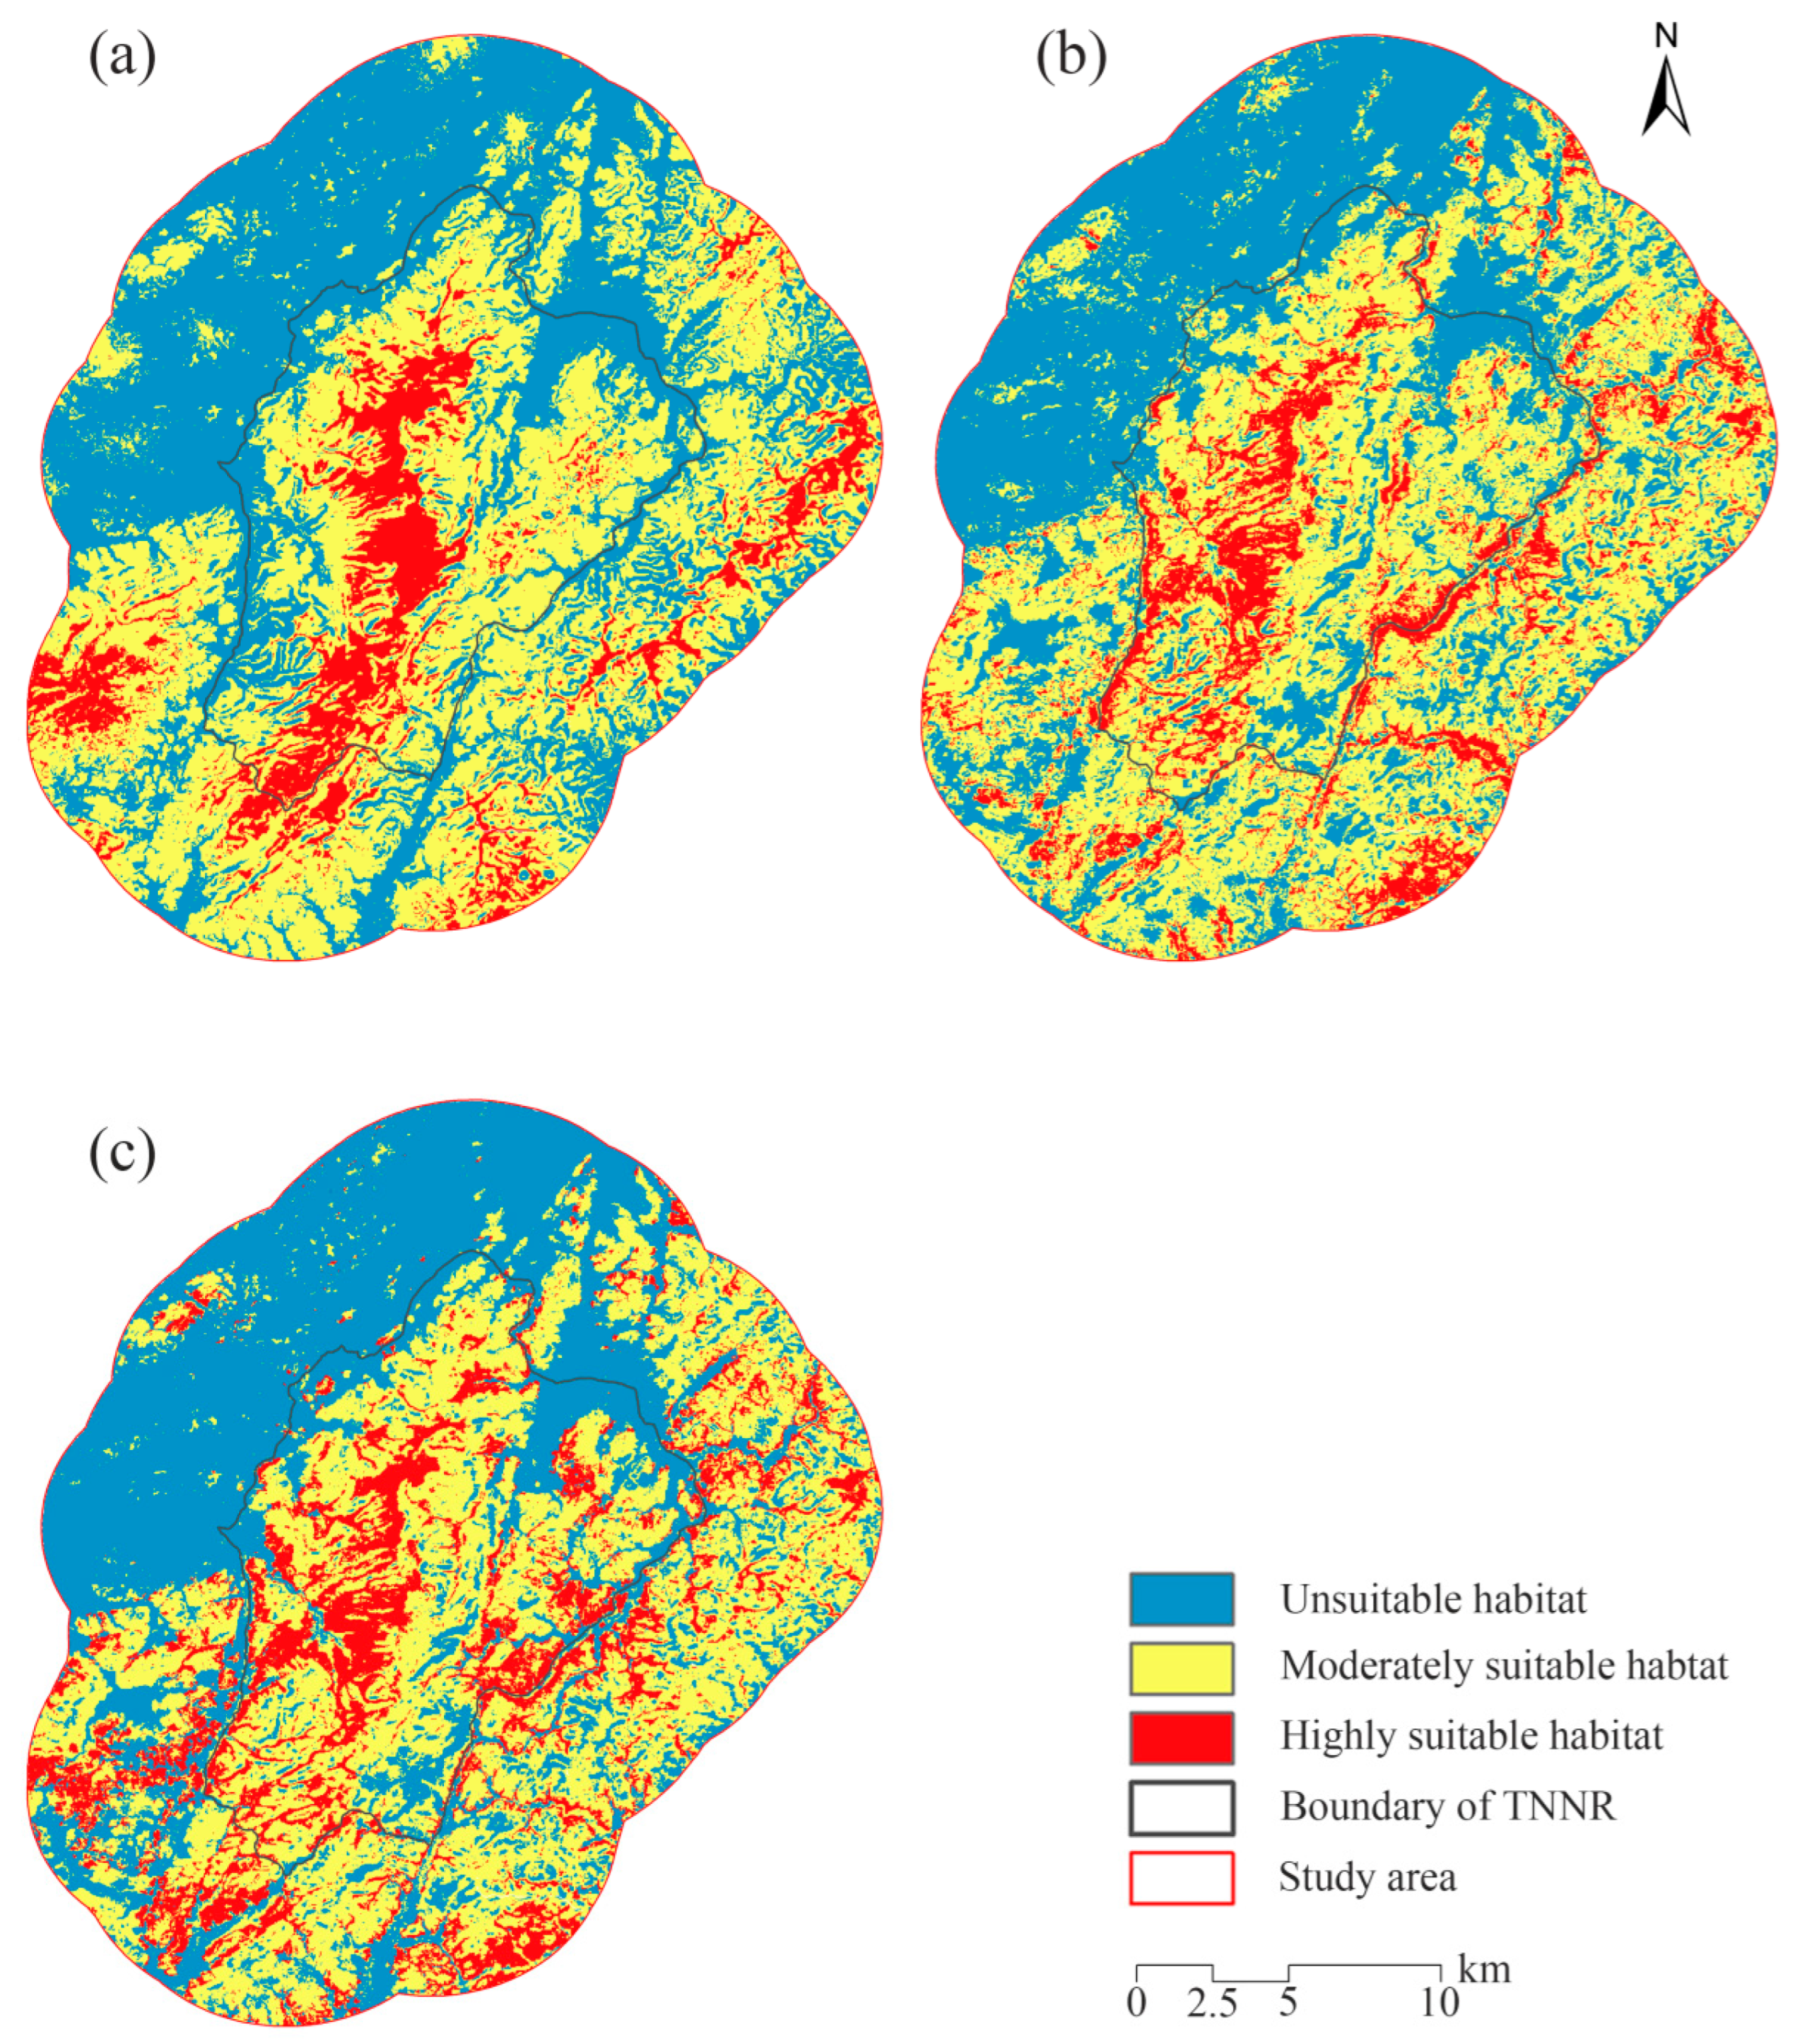
3.3. Habitat Suitability Assessment Results

According to the MaxEnt model, the MTSS and BTPT values for sika deer are 0.3948 and 0.1375; for Reeve’s muntjac, they are 0.3803 and 0.1057, and for wild boar they are 0.3752 and 0.1109, respectively. For sika deer, a highly suitable habitat is defined as HSI ≥ 0.3948, moderately suitable as 0.3948 > HSI > 0.1375, and unsuitable as HSI < 0.1375. For Reeve’s muntjac, a highly suitable habitat is defined as HSI ≥ 0.3803, moderately suitable as 0.3803 > HSI > 0.1057, and unsuitable as HSI < 0.1057. For wild boar, a highly suitable habitat is defined as HSI ≥ 0.3752, moderately suitable as 0.3752 > HSI > 0.1109, and unsuitable as HSI < 0.1109.
These thresholds were applied to reclassify the potential habitats of sika deer, muntjac, and wild boar. Consequently, habitat suitability distribution maps for the three species within the study area were generated (Figure 6).
The prediction results of the MaxEnt model indicate that the areas of highly suitable habitat, moderately suitable habitat, and unsuitable habitat for sika deer in the study area are 53.85 km2, 228.91 km2, and 201.11 km2, respectively. These areas account for 11.13%, 47.31%, and 41.56% of the total study area. For Reeve’s muntjac, the areas of highly suitable habitat, moderately suitable habitat, and unsuitable habitat are 58.03 km2, 235.77 km2, and 190.07 km2, corresponding to 11.99%, 48.73%, and 39.28% of the total study area, respectively. Additionally, for wild boar, the areas of highly suitable habitat, moderately habitat, and unsuitable habitat are 78.04 km2, 210.14 km2, and 195.69 km2, accounting for 16.13%, 43.43%, and 40.44% of the total study area, respectively.

3.4. Habitat Overlap Among the Three Ungulates

The Pianka index indicates that the spatial overlap between sika deer and wild boar is low (0.160), while the overlap between Reeve’s muntjac and sika deer, and between Reeve’s muntjac and wild boar, is relatively high (0.487 and 0.485, respectively).
Using the Raster Calculator in ArcGIS 10.8, the habitat suitability raster data for each species were multiplied to generate overlapping raster layers that represent habitats of varying quality. We generated two composite raster layers representing the combined habitat suitability of sika deer and Reeve’s muntjac (Figure 7), and sika deer and wild boar (Figure 8), respectively. The resulting composite raster layers contained unique product values, each representing a specific combination of habitat suitability for sika deer and the other species. The product values and their corresponding habitat suitability areas are listed (Table 3 and Table 4).
The overlap area between the moderately suitable habitat of sika deer and the moderately and highly suitable habitats of Reeve’s muntjac is 183.78 km2, accounting for 80.28% of the moderately suitable habitat of sika deer and more than three-quarters of its highly suitable habitat (Table 3). The total overlapping area between the highly suitable habitat of sika deer and the moderately and highly suitable habitat of Reeve’s muntjac is 49.3 km2, which represents 91.55% of the highly suitable habitat of sika deer, indicating a substantial overlap in their optimal habitats.
The combined overlapping area among the moderately suitable for sika deer and the moderately and highly suitable for wild boar is 196.35 km2, representing 85.78% of the moderately suitable area of sika deer (Table 4). Similarly, the overlapping area between the highly suitable habitat of sika deer and the moderately and highly suitable habitats of wild boar is 52.39 km2, accounting for 97.31% of the highly suitable habitat of sika deer. Based on the results, the overlapping area deemed unsuitable for all three species is 136.2 km2, which constitutes 28.15% of the study area. The overlapping area of sub-suitable habitats shared by all three species measures 120.61 km2, representing 24.93% of the total study area. Notably, these highly suitable habitats are primarily found within the core region of the TNNR.

4. Discussion

The habitat selection preferences of sika deer and sympatric species are influenced by different environmental factors. The cumulative contribution rate of DEM, slope, curvature, and aspect in the sika deer model is 50.9%, indicating that topographic factors are the primary determinants of habitat selection for this species. This highlights the significance of terrain in shaping sika deer habitat preferences [40]. Sika deer, Reeve’s muntjac, and wild boar show similar selection trends with respect to DEM: their occurrence generally increases with elevation. However, sika deer predominantly inhabit areas above 300 m, while Reeve’s muntjac and wild boar exhibit broader elevation ranges, mainly occupying areas below 50 m. This pattern may reflect the ecological adaptations of sika deer, which favor higher elevations and dense vegetation cover [31]. The variable D-Water is a key factor for Reeve’s muntjac, indicating that proximity to water sources is crucial for habitat suitability. This finding aligns with previous studies emphasizing water availability as a critical factor for ungulates, particularly in regions with pronounced seasonal variations [37]. For wild boar, LC is also a key factor, suggesting that the type and distribution of vegetation play an important role in determining suitable habitats.
The habitat suitability maps generated by the MaxEnt model reveal clear differences in suitability patterns for the three ungulate species within the study area. Sika deer occupy a relatively smaller area of highly suitable habitat than wild boar and Reeve’s muntjac. In terms of spatial distribution, sika deer are concentrated in the core area of the reserve, likely due to the vegetation types and terrain conditions in these areas being more suitable for their survival and reproduction. As a result, their population remains primarily distributed in the northern part of this core area. The larger area of moderately suitable habitat for sika deer suggests that while extensive areas exist with an intermediate suitability, the availability of highly suitable habitat is limited. This finding emphasizes the need for targeted conservation efforts to enhance the quality of existing habitats and expand areas of high suitability for sika deer.
Sika deer’s habitat shows a variable overlap with Reeve’s muntjac and wild boar, and notably, its high-quality habitat shows a substantial overlap with both species. Sika deer’s habitat overlaps to varying degrees with those of Reeve’s muntjac and wild boar, and notably, its high-quality habitats show a substantial overlap with both species. The relatively low spatial overlap index between sika deer and wild boar (0.160) may result from different habitat preferences, with sika deer preferring higher elevations and dense vegetation, while wild boar favor lower elevations and more open areas. Reeve’s muntjac exhibits relatively high spatial overlap indices with both sika deer (0.487) and wild boar (0.485), suggesting that it may have more generalized habitat preferences, allowing it to coexist with both species in areas of overlap. As noted by Bagchi et al., when sympatric ungulates exhibit niche overlap, they often differentiate along other ecological dimensions to reduce a multidimensional niche overlap, thereby facilitating species coexistence [41]. Spatial niche overlap analysis corroborated that optimal habitats common to all three species are limited to a small area within the core region of the TNNR. This highlights that the core area is critical for the coexistence of these ungulate species. Conserving this core area is essential to maintain the ecological integrity of the reserve and support the survival of multiple ungulate species [42]. The limited area of highly suitable habitat for sika deer, coupled with the higher overlap with Reeve’s muntjac, suggests that competition for resources may be a significant factor affecting the survival and population dynamics of sika deer [1].
The spatial niche analysis reveals that the highly suitable habitat of sika deer is not only limited in area but also substantially overlaps with that of Reeve’s muntjac and wild boar. Given the potential for interspecific interactions among these ungulates, transitioning from single-species management to an integrated, multi-species conservation strategy is imperative. First, the quality of the sika deer’s habitat can be improved by optimizing resource allocation through microhabitat modifications within core conservation zones. For example, shrubs and herbs that are preferred by sika deer at a high altitude in dense forest areas (DEM > 400 m) can be selectively planted to enhance the habitat’s carrying capacity [5]. Meanwhile, seasonal resource supply points should be established around water sources (D-Water < 500 m) to redistribute Reeve’s muntjac activity hotspots and reduce direct competition with sika deer [37]. As for wild boar, their preference for low-altitude open areas may create barriers to the migration of sika deer, so it is necessary to designate exclusive channels in the buffer zone to avoid habitat fragmentation [5]. Additionally, the implementation of a dynamic monitoring system (a real-time infrared camera network) can quantify the effect of management measures and provide data support for adaptive management [22]. Such targeted strategies not only alleviate interspecific competition but also improve the ecosystem service functions of protected areas. To protect South China sika deer, it is of vital importance to protect the existing habitats and populations through a reduction in human disturbances and a restoration of natural vegetation [20,43].

5. Conclusions

Terrain factors were identified as the primary drivers of habitat selection for sika deer, with elevation emerging as the most influential variable. Sika deer prefer areas at higher elevations with gentler slopes. While slope significantly influenced the habitat suitability for Reeve’s muntjac, LC and DEM were the key factors shaping habitat suitability for wild boar. The distribution of habitat suitability among the three species varied markedly. Sika deer occupy a relatively limited area of highly suitable habitat, while wild boar and Reeve’s muntjac have a wider range of suitable habitat. A substantial portion of sika deer’s optimal habitat overlaps with that of wild boar and Reeve’s muntjac. This overlap may lead to competition for food and habitat space, with sika deer being particularly vulnerable to such pressures.
The core zone of the TNNR has been identified as a vital area for the coexistence of multiple species, including sika deer, Reeve’s muntjac, and wild boar. This area represents the optimal habitat for all three species, underscoring the need for spatially explicit management to balance their ecological requirements. Although competition between sika deer and wild boar appears limited due to niche differentiation, the pronounced overlap with Reeve’s muntjac highlights the necessity for targeted conservation measures to mitigate potential competition.

Author Contributions

Conceptualization, Y.L. and C.L.; formal analysis, J.Z. and C.L.; investigation, J.Z., Z.W., G.W., S.H. and Y.Z.; data curation, J.Z., Z.W., G.W., S.H. and Y.Z.; writing—original draft preparation, J.Z.; writing—review and editing, Y.L. and C.L All authors have read and agreed to the published version of the manuscript.

Funding

This research was funded by the National Natural Science Foundation of China (grants 31970500 and 31770571) and the Excellent Youth Project of the Anhui Natural Science Foundation (grant 2108085Y09).

Institutional Review Board Statement

Not applicable.

Informed Consent Statement

Not applicable.

Data Availability Statement

Data contained in the study are available from the authors upon reasonable request.

Conflicts of Interest

These authors have no conflicts of interest.

Abbreviations

The following abbreviations are used in this manuscript:
TNNRJiangxi Taohongling Sika Deer National Nature Reserve
GISGeographic Information System
DEMDigital Elevation Model
RFiRelief
LCLand cover
NDVINormalized Vegetation Index Values
HPFHuman Footprint Index
GHFGlobal Human Footprint
UEMMUrban Environmental Monitoring and Modeling
D-RoadDistance to nearest road
D-WaterDistance to nearest water
HSMsHabitat suitability models
AUCArea under the receiver operating characteristic curve
MTSSMaximum training sensitivity plus specificity
BTPTBalance training omission, predicted area, and threshold value
HSIHabitat Suitability Index

References

  1. Hofmann, M.M.; Zohner, C.M.; Renner, S.S. Narrow habitat breadth and late-summer emergence increases extinction vulnerability in Central European bees. Proc. R. Soc. B-Biol. Sci. 2019, 286, 20190316. [Google Scholar] [CrossRef] [PubMed]
  2. Block, W.M.; Brennan, L.A. The Habitat Concept in Ornithology. In Current Ornithology; Power, D.M., Ed.; Springer: Boston, MA, USA, 1993; Volume 11. [Google Scholar]
  3. Grinnell, J. Field Tests of Theories Concerning Distributional Control. Am. Nat. 1917, 51, 115–128. [Google Scholar] [CrossRef]
  4. Haddad, N.M.; Brudvig, L.A.; Clobert, J.; Davies, K.F.; Gonzalez, A.; Holt, R.D.; Lovejoy, T.E.; Sexton, J.O.; Austin, M.P.; Collins, C.D.; et al. Habitat fragmentation and its lasting impact on Earth’s ecosystems. Sci. Adv. 2015, 1, e1500052. [Google Scholar] [CrossRef]
  5. Podgórski, T.; Baś, G.; Jędrzejewska, B.; Sönnichsen, L.; Śnieżko, S.; Jędrzejewski, W.; Okarma, H. Spatiotemporal behavioral plasticity of wild boar (Sus scrofa) under contrasting conditions of human pressure: Primeval forest and metropolitan area. J. Mammal. 2013, 94, 109–119. [Google Scholar] [CrossRef]
  6. Sáyago, R.; Quesada, M.; Aguilar, R.; Ashworth, L.; Lopezaraiza-Mikel, M.; Martén-Rodríguez, S. Consequences of habitat fragmentation on the reproductive success of two Tillandsia species with contrasting life history strategies. AoB Plants 2018, 10, ply038. [Google Scholar] [CrossRef]
  7. Bennington, S.; Rayment, W.; Currey, R.; Oldridge, L.; Henderson, S.; Guerra, M.; Brough, T.; Johnston, D.; Corne, C.; Slooten, L.; et al. Long-term stability in core habitat of an endangered population of bottlenose dolphins (Tursiops truncatus): Implications for spatial management. Aquat. Conserv.-Mar. Freshw. Ecosyst. 2021, 31, 665–676. [Google Scholar] [CrossRef]
  8. Keinath, D.A.; Doak, D.F.; Hodges, K.E.; Prugh, L.R.; Fagan, W.; Sekercioglu, C.H.; Buchart, S.H.M.; Kauffman, M. A global analysis of traits predicting species sensitivity to habitat fragmentation. Glob. Ecol. Biogeogr. 2017, 26, 115–127. [Google Scholar] [CrossRef]
  9. Kazemi, E.; Kaboli, M.; Khosravi, R.; Khorasani, N. Evaluating the importance of environmental variables on spatial distribution of caspian cobra naja oxiana (Eichwald, 1831) in Iran. Asian Herpetol. Res. 2019, 10, 129–138. [Google Scholar] [CrossRef]
  10. Kong, F.; Shen, B.; Li, X.; Zhou, Y.X.; Li, Y.K.; Li, J.Q.; Wan, Y.Q.; Zhan, J.W.; Liu, W.H.; Hu, H.J.; et al. The difference of activity rhythm of synchro-distributed ungulates in Taohongling Reserve, Jiangxi Province. Chin. J. Wildl. 2024, 45, 242–250. (In Chinese) [Google Scholar] [CrossRef]
  11. Moll, R.J.; Killion, A.K.; Montgomery, R.A.; Tambling, C.J.; Hayward, M.W. Spatial patterns of African ungulate aggregation reveal complex but limited risk effects from reintroduced carnivores. Ecology 2016, 97, 1123–1134. [Google Scholar] [CrossRef]
  12. Bukombe, J.; Kittle, A.; Senzota, R.; Mduma, S.; Fryxell, J.; Sinclair, A.R. Resource selection, utilization and seasons influence spatial distribution of ungulates in the western Serengeti National Park. Afr. J. Ecol. 2018, 56, 3–11. [Google Scholar] [CrossRef]
  13. Mamo, Y.; Asefa, A.; Mengesha, G. Habitat use of ungulates in bale mountains national Park, Ethiopia. Afr. J. Ecol. 2015, 53, 512–520. [Google Scholar] [CrossRef]
  14. Phillips, S.J.; Dudík, M. Modeling of species distributions with Maxent: New extensions and a comprehensive evaluation. Ecography 2008, 31, 161–175. Available online: https://www.jstor.org/stable/30244563 (accessed on 20 June 2024). [CrossRef]
  15. Sun, X.; Long, Z.; Jia, J. A multi-scale Maxent approach to model habitat suitability for the giant pandas in the Qionglai mountain, China. Glob. Ecol. Conserv. 2021, 30, e01766. [Google Scholar] [CrossRef]
  16. Bukombe, J.; Kittle, A.; Senzota, R.B.; Kija, H.; Mduma, S.; Fryxell, J.M.; Magige, F.; Mligo, C.; Sinclair, A.R.E. The influence of food availability, quality and body size on patch selection of coexisting grazer ungulates in western Serengeti National Park. Wildl. Res. 2019, 46, 54–63. [Google Scholar] [CrossRef]
  17. Ebrahimi, A.; Farashi, A.; Rashki, A. Habitat suitability of Persian leopard (Panthera pardus saxicolor) in Iran in future. Environ. Earth Sci. 2017, 76, 697. [Google Scholar] [CrossRef]
  18. Zhong, L.; Zhang, W.; Yang, M.; Wu, S.; Zhi, X.; Zhang, M. Winter diet variation and overlap of sympatric red deer and sika deer in Northeast China. Pol. J. Ecol. 2020, 67, 354–366. [Google Scholar] [CrossRef]
  19. Ellerman, J.R.; Morrison-Scott, T.C.S. Checklist of Palaearctic and Indian Mammals—Amendments. J. Mammal. 1953, 34, 516–518. [Google Scholar] [CrossRef]
  20. Mccullough, D.R.; Jiang, Z.G.; Li, C.W. Sika Deer in Mainland China. In Sika Deer; McCullough, D.R., Takatsuki, S., Kaji, K., Eds.; Springer: Tokyo, Japan, 2009. [Google Scholar]
  21. Yan, L. Jiangxi Pengze discovered sika deer. Wildlife 1983, 3, 40. (In Chinese) [Google Scholar] [CrossRef]
  22. Zhou, Y. Diversity of Mammals and Birds, Ungulates Activity Rhythm and Habitat Selection by Camera Trapping in the Taohongling. Master’s Thesis, Jiangxi Normal University, Nanchang, China, 2019. [Google Scholar]
  23. Wu, W.; Li, Y.; Hu, Y. Simulation of potential habitat overlap between red deer (Cervus elaphus) and roe deer (Capreolus capreolus) in northeastern China. PeerJ 2016, 4, e1756. [Google Scholar] [CrossRef]
  24. Estevo, C.A.; Nagy-Reis, M.B.; Nichols, J.D. When habitat matters: Habitat preferences can modulate co-occurrence patterns of similar sympatric species. PLoS ONE 2017, 12, e0179489. [Google Scholar] [CrossRef] [PubMed]
  25. Petroelje, T.R.; Kautz, T.M.; Beyer, D.E., Jr.; Belant, J.L. Interference competition between wolves and coyotes during variable prey abundance. Ecol. Evol. 2021, 11, 1413–1431. [Google Scholar] [CrossRef] [PubMed]
  26. Pokharel, K.P.; Ludwig, T.; Storch, I. Spatial niche partitioning in sub-tropical solitary ungulates: Four-horned antelope and barking deer in Nepal. PLoS ONE 2015, 10, e0117917. [Google Scholar] [CrossRef] [PubMed]
  27. Zhao, C.; Li, Y.; Li, D.; Guan, J.; Xiong, Y.; Hu, J. Habitat suitability assessment of Sichuan sika deer in Tiebu Nature Reserve during periods of green and dry grass. Acta Ecol. Sin. 2014, 34, 135–140. [Google Scholar] [CrossRef]
  28. Bai, W.; Zhang, J.; He, K.; Zhao, S.; Gu, X.; Hu, J.; Songer, M.; Zhou, C.; Dong, X.; Huang, Q. Implications of habitat overlap between giant panda and sambar for sympatric multi-species conservation. Wildl. Res. 2022, 50, 820–826. [Google Scholar] [CrossRef]
  29. Liu, T.; Jiang, Z.; Wang, W.; Wang, G.; Song, X.; Xu, A.; Li, C. Changes in habitat suitability and population size of the endangered Przewalski’s gazelle. Glob. Ecol. Conserv. 2023, 43, e02465. [Google Scholar] [CrossRef]
  30. Morrison, M.L.; Marcot, B.; Mannan, W. Wildlife-habitat relationships: Concepts and applications. Condor Ornithol. Appl. 2012, 109, 980–981. [Google Scholar] [CrossRef]
  31. Endo, Y.; Takada, H.; Takatsuki, S. Comparison of the food habits of the sika deer (Cervus nippon), the Japanese serow (Capricornis crispus), and the wild boar (Sus. scrofa), sympatric herbivorous mammals from Mt. Asama, central Japan. Mammal Study 2017, 42, 131–140. [Google Scholar] [CrossRef]
  32. Huang, X.; Yang, J. The 30 m annual land cover datasets and its dynamics in China from 1985 to 2022 [dataset]. Earth Syst. Sci. Data 2023, 13, 3907–3925. [Google Scholar] [CrossRef]
  33. Chen, X.; Lei, Y. Effects of sample size on accuracy and stability of species distribution models: A comparison of GARP and MaxEnt. In Recent Advances in Computer Science and Information Engineering; Qian, Z., Cao, L., Su, W., Wang, T., Yang, H., Eds.; Springer: Berlin Heidelberg, Germany, 2012; Volume 2, pp. 601–609. [Google Scholar] [CrossRef]
  34. Qian, Z.; Cao, L.; Su, W.; Wang, T.; Yang, H. (Eds.) Recent Advances in Computer Science and Information Engineering; Lecture Notes in Electrical Engineering; Springer: Berlin/Heidelberg, Germany, 2012; Volume 125. [Google Scholar]
  35. Pianka, E.R. The structure of lizard communities. Annu. Rev. Ecol. Syst. 1973, 4, 53–74. Available online: http://www.jstor.org/stable/2096804 (accessed on 20 June 2024). [CrossRef]
  36. Pianka, E.R. Niche overlap and diffuse competition. Proc. Natl. Acad. Sci. USA 1974, 71, 2141–2145. [Google Scholar] [CrossRef] [PubMed]
  37. Yasuda, M. Monitoring diversity and abundance of mammals with camera traps: A case study on Mount Tsukuba, central Japan. Mammal Study 2004, 29, 37–46. [Google Scholar] [CrossRef]
  38. Xu, W.; Ouyang, Z.; Jiang, Z.; Zheng, H.; Liu, J. Assessment of giant panda habitat in the Daxiangling Mountain Range, Sichuan, China. Biodivers. Sci. 2006, 14, 223–231. (In Chinese) [Google Scholar] [CrossRef]
  39. Yan, W.; Wang, Q.; Wang, C. Evaluation of potential breeding habitat distribution with Maxent model for crested ibis in the Qinling-Bashan region. Chin. J. Zool. 2015, 50, 185–193. (In Chinese) [Google Scholar] [CrossRef]
  40. Duncan, N.P.; Kahl, S.S.; Gray, S.S.; Salice, C.J.; Stevens, R.D. Pronghorn habitat suitability in the Texas Panhandle. J. Wildl. Manag. 2016, 80, 1471–1478. [Google Scholar] [CrossRef]
  41. Bagchi, S.; Goyal, S.; Sankar, K. Niche relationships of an ungulate assemblage in a dry tropical forest. J. Mammal. 2003, 84, 981–988. [Google Scholar] [CrossRef]
  42. Newbold, T.; Hudson, L.N.; Hill, S.L.; Contu, S.; Lysenko, I.; Senior, R.A.; Börger, L.; Bennett, D.J.; Choimes, A.; Collen, B.; et al. Global effects of land use on local terrestrial biodiversity. Nature 2015, 520, 45–50. [Google Scholar] [CrossRef]
  43. Zhang, L.; Dong, L.; Lin, L.; Feng, L.; Yan, F.; Wang, L.; Guo, X.; Luo, A. Asian elephants in China: Estimating population size and evaluating habitat suitability. PLoS ONE 2015, 10, e0124834. [Google Scholar] [CrossRef]
Figure 1. Study area located in Pengze County on the southern bank of the middle and lower reaches of the Yangtze River. TNNR = the Taohongling Sika Deer National Nature Reserve.
Ecologies 06 00041 g001
Figure 2. Study area camera trap sites for the three ungulates. TNNR = the Taohongling Sika Deer National Nature Reserve. Camera traps were placed at 60 sites to monitor sika deer, Reeve’s muntjac, and wild boar.
Ecologies 06 00041 g002
Figure 3. Receiver operating characteristic curve of MaxEnt models for sika deer (a), Reeve’s muntjac (b), and wild boar (c).
Ecologies 06 00041 g003
Figure 4. Jackknife test of variables’ importance in MaxEnt modeling for sika deer (a), Reeve’s muntjac (b), and wild boar (c). It shows how the model is affected when the variable is used in isolation (with only variable, dark blue) and when the variable is omitted (Without variable, light blue). The red bar (with all variables) displays the total gain when all the variables are included in the model. The environmental variables are described in Table 1.
Ecologies 06 00041 g004
Figure 5. Response curves of some environmental factors for sika deer (a,d,g,j), Reeve’s muntjac (b,e,h,k) and wild boar (c,f,i,l). In the graph representing the response curve of land cover-type environmental factors, the horizontal coordinate 1 represents cropland, 2 represents forest, 4 represents grassland, 5 represents water, and 8 represents impervious.
Ecologies 06 00041 g005
Figure 6. Habitat suitability maps of sika deer (a), Reeve’s muntjac (b), and wild boar (c). TNNR = the Taohongling Sika Deer National Nature Reserve.
Ecologies 06 00041 g006
Figure 7. Composite raster map representing the combined habitat suitability for sika deer and Reeve’s muntjac. The values in the raster correspond to specific combinations of habitat suitability for the two species, as detailed in Table 3.
Ecologies 06 00041 g007
Figure 8. Composite raster map representing the combined habitat suitability for sika deer and wild boar. The values in the raster correspond to specific combinations of habitat suitability for the two species, as detailed in Table 4.
Ecologies 06 00041 g008
Table 1. Selected environmental variables for assessing habitat suitability of three ungulate species.
CategoryCodeDescriptionSource
Terrain FactorAspecthttp://www.gscloud.cn/ (accessed on 12 September 2024)
Curvaturehttp://www.gscloud.cn/ (accessed on 12 September 2024)
DEMDigital Elevation Modelhttp://www.gscloud.cn/ (accessed on 12 September 2024)
Slopehttp://www.gscloud.cn/ (accessed on 12 September 2024)
Human Disturbance FactorD-Road Distance to nearest road
D-Water Distance to nearest waterhttp://www.webmap.cn/ (accessed on 13 September 2024)
HPF Human Pressure Footprinthttps://wcshumanfootprint.org/ (accessed on 15 September 2024)
Vegetation FactorLCLand coverhttp://www.gscloud.cn/ (accessed on 12 September 2024)
NDVINormalized Difference Vegetation Indexhttp://www.gscloud.cn/ (accessed on 12 September 2024)
Table 2. Factor importance for habitat suitability of three ungulate species.
Environment VariableContribution Rate (%)
The Sika DeerReeve’s Muntjac Wild Boar
Aspect1.967.336.96
Curvature7.573.342.39
D-Road24.9217.6611.22
D-Water3.3513.599.96
DEM24.419.5513.29
HPF0.846.033.47
LC18.4018.0736.75
NDVI1.695.595.08
Slope16.8618.849.89
D-Road: distance to nearest road; D-Water: distance to nearest water; HPF: Human Pressure Footprint; LC: land cover; NDVI: Normalized Difference Vegetation Index.
Table 3. Habitat suitability overlap values of sika deer and Reeve’s muntjac.
Sika Deer SuitabilityReeve’s Muntjac SuitabilityProduct ValueArea (km2)
1 (Unsuitable)3 (Unsuitable)3140.38
1 (Unsuitable)5 (Moderately suitable)552.55
1 (Unsuitable)7 (Highly suitable)78.18
2 (Moderately suitable)3 (Unsuitable)645.13
2 (Moderately suitable)5 (Moderately suitable)10149.58
2 (Moderately suitable)7 (Highly suitable)1434.20
4 (Highly suitable)3 (Unsuitable)124.55
4 (Highly suitable)5 (Moderately suitable)2033.65
4 (Highly suitable)7 (Highly suitable)2815.65
Table 4. Habitat suitability overlap values of sika deer and wild boar.
Sika Deer SuitabilityWild Boar SuitabilityProduct ValueArea (km2)
1 (Unsuitable)2 (Unsuitable)2161.67
1 (Unsuitable)3 (Moderately suitable)334.43
1 (Unsuitable)5 (Highly suitable)55.01
2 (Moderately suitable)2 (Unsuitable)432.56
2 (Moderately suitable)3 (Moderately suitable)6143.71
2 (Moderately suitable)5 (Highly suitable)1052.64
4 (Highly suitable)2 (Unsuitable)81.45
4 (Highly suitable)3 (Moderately suitable)1232.00
4 (Highly suitable)5 (Highly suitable)2020.39
Disclaimer/Publisher’s Note: The statements, opinions and data contained in all publications are solely those of the individual author(s) and contributor(s) and not of MDPI and/or the editor(s). MDPI and/or the editor(s) disclaim responsibility for any injury to people or property resulting from any ideas, methods, instructions or products referred to in the content.

