1. Introduction
Various applications, including hydrology and water resources management [
1,
2,
3,
4], rely on accurate precipitation data to support urban resilience and sustainable development initiatives [
5]. The aim is to mitigate natural hazards occurring from extreme precipitation events, including floods and droughts [
6]. However, the presence of errors in measuring instruments, along with spatial and temporal challenges in different areas, hinders the acquisition of precise precipitation data [
7,
8]. Traditional precipitation gauging stations still measure and provide ground-based precipitation today. This ground-based precipitation data is utilized to assess the accuracy of precipitation data obtained from other sources such as satellites and radar [
9,
10,
11,
12]. The precipitation data collected from traditional gauges is specific to a single point on the ground, and the uneven distribution of gauging stations in an area poses challenges in determining the overall precipitation distribution across that area [
9,
10]. These limitations highlight the need for alternative solutions, such as satellite-based precipitation products (SbPPs), which can enhance data reliability for environmental analysis and decision-making [
13].
Precipitation is measured by radars on the ground by making reflectivity measurements in larger areas [
14,
15,
16]. Advanced technologies such as the integration of dual polarization are used to increase the accuracy of these estimates [
17,
18]. However, since the radar systems are set up in land areas, the coverage is reduced due to the lack of coverage in the oceans. This limitation highlights the importance of satellites equipped with remote sensors for comprehensive precipitation coverage, particularly in regions where ground-based methods fall short.
On the other hand, special satellites with remote sensors are equipped in space to obtain comprehensive precipitation coverage of the earth [
19]. These satellites offer a broader view and effectively cover the entire world, including specific regions, thus providing a solution to the challenges posed by traditional precipitation measurement methods and radar [
9,
20,
21]. This global perspective is crucial for urban planners, civil engineers, and policymakers who rely on comprehensive environmental monitoring for informed decision-making. Satellite retrieval algorithms for precipitation data can be divided into four categories based on the sensor type: visible/infrared (VIS/IR), passive microwave (PMW), active microwave, and multisensory combination. The VIS/IR method, though providing extensive area coverage, often overestimates data, while the PMW method offers more accurate data by detecting raindrops penetrating through clouds. These distinctions are critical for evaluating the effectiveness of different satellite methods in urban settings like Norfolk, Virginia.
Several studies have used different SbPPs in various regions and countries, highlighting the critical role of understanding regional variability in precipitation data for urban resilience and climate adaptation strategies [
22,
23,
24,
25,
26]. TRMM 3B42 V7, an SbPP fusion dataset developed in collaboration with NASA and the National Space Development Agency of Japan [
27], corrects Tropical Rainfall Measuring Mission (TRMM) microwave imager data and integrates it with special sensor microwave/imager data, forming a comprehensive precipitation dataset. This data is further calibrated with infrared radiation data and validated with ground-based precipitation data, demonstrating the integration of multiple data sources, which is crucial for enhancing decision-making in urban planning and water management [
28]. According to [
29], TRMM precipitation data has been more effective than Climate Prediction Center (CPC) MORPHing technique (CMORPH) and precipitation estimation from Remotely Sensed Information using Artificial Neural Networks (PERSIANN) in regions like Nepal [
30], North Brazil [
31], and Africa [
32], providing valuable insights for adapting hydrological models in diverse geographical conditions. In Singapore, Integrated Multisatellite Retrievals for Global Precipitation Measurements (IMERG) has shown better performance than TRMM [
33], while TRMM has outperformed Climate Hazards Group InfraRed Precipitation with Station (CHIRPS) in the lower Mekong River basin [
34], and in the southwestern Pacific regions, CHIRPS has performed better than IMERG [
35]. These comparisons highlight the necessity to select and evaluate remote sensing data based on specific environmental challenges faced by urban planners and policy-makers. Zhang et al. (2020) [
36] have extensively studied how TMPA and PERSIANN function in the humid areas of northeastern China, and PERSIANN-CDR, CHIRPS, and multisource weighted-ensemble precipitation (MSWEP) have been used to monitor drought conditions in northwest China [
37,
38]. This variety in SbPP performance depending on location emphasizes the need for adaptable methods in environmental management and urban planning.
SbPPs using multiple bias adjustments are significant in hydrometeorology, remote sensing, and civil engineering applications. With advancements in satellite technology, higher-resolution precipitation data have been obtained, expanding research in weather forecasting, hydrology, and environmental management [
39]. This progress is vital for urban resilience and climate adaptation strategies, making the teaching of contemporary remote sensing techniques and data analysis methods crucial not just in academia but also for practicing professionals. The main purpose of applying bias adjustments is to align satellite precipitation data with ground-observed data, improving satellite data consistency and reliability.
This research assesses the effectiveness of three widely utilized satellite-based precipitation products (SbPPs) and corresponding bias adjustment methods in Norfolk, Virginia, USA, covering the period from 2003 to 2022. By comparing these products with observed precipitation data from Norfolk International Airport (NIA), this case study aims to identify the most effective methods for enhancing the accuracy and reliability of precipitation data in urban settings. This research highlights the potential for SbPPs to supplement ground-based observations in areas with limited data, paving the way for future research on integrative techniques that could enhance urban hydrological models and decision-making processes.
2. Materials and Methods
The study employs a point-to-pixel approach for comparing satellite-based precipitation with ground-based observed precipitation. In this context, “points” refer to precipitation gauges, and “pixels” signify the grids used in satellite-based precipitation data. The spatial mismatch between point-based ground observations and grid-based satellite data was addressed using this approach, where precipitation data from ground gauges were compared to the corresponding satellite grid cells. Bias adjustment methods, including ABC, MBC, and DTN, were employed to align satellite data with observed values by correcting systematic errors, normalizing relative differences, and matching statistical distributions. This method enables a detailed comparison between localized observations and broader satellite-based measurements. The accuracy of bias-adjusted satellite-based precipitation was investigated and compared with observed precipitation using detection capability indices, statistical measures, and graphical methods. These methods offer practical insights into data analysis and interpretation, essential skills in civil engineering. Additionally, the use of various comparative methods emphasizes the value of thorough analysis in addressing complex engineering challenges.
2.1. Study Area
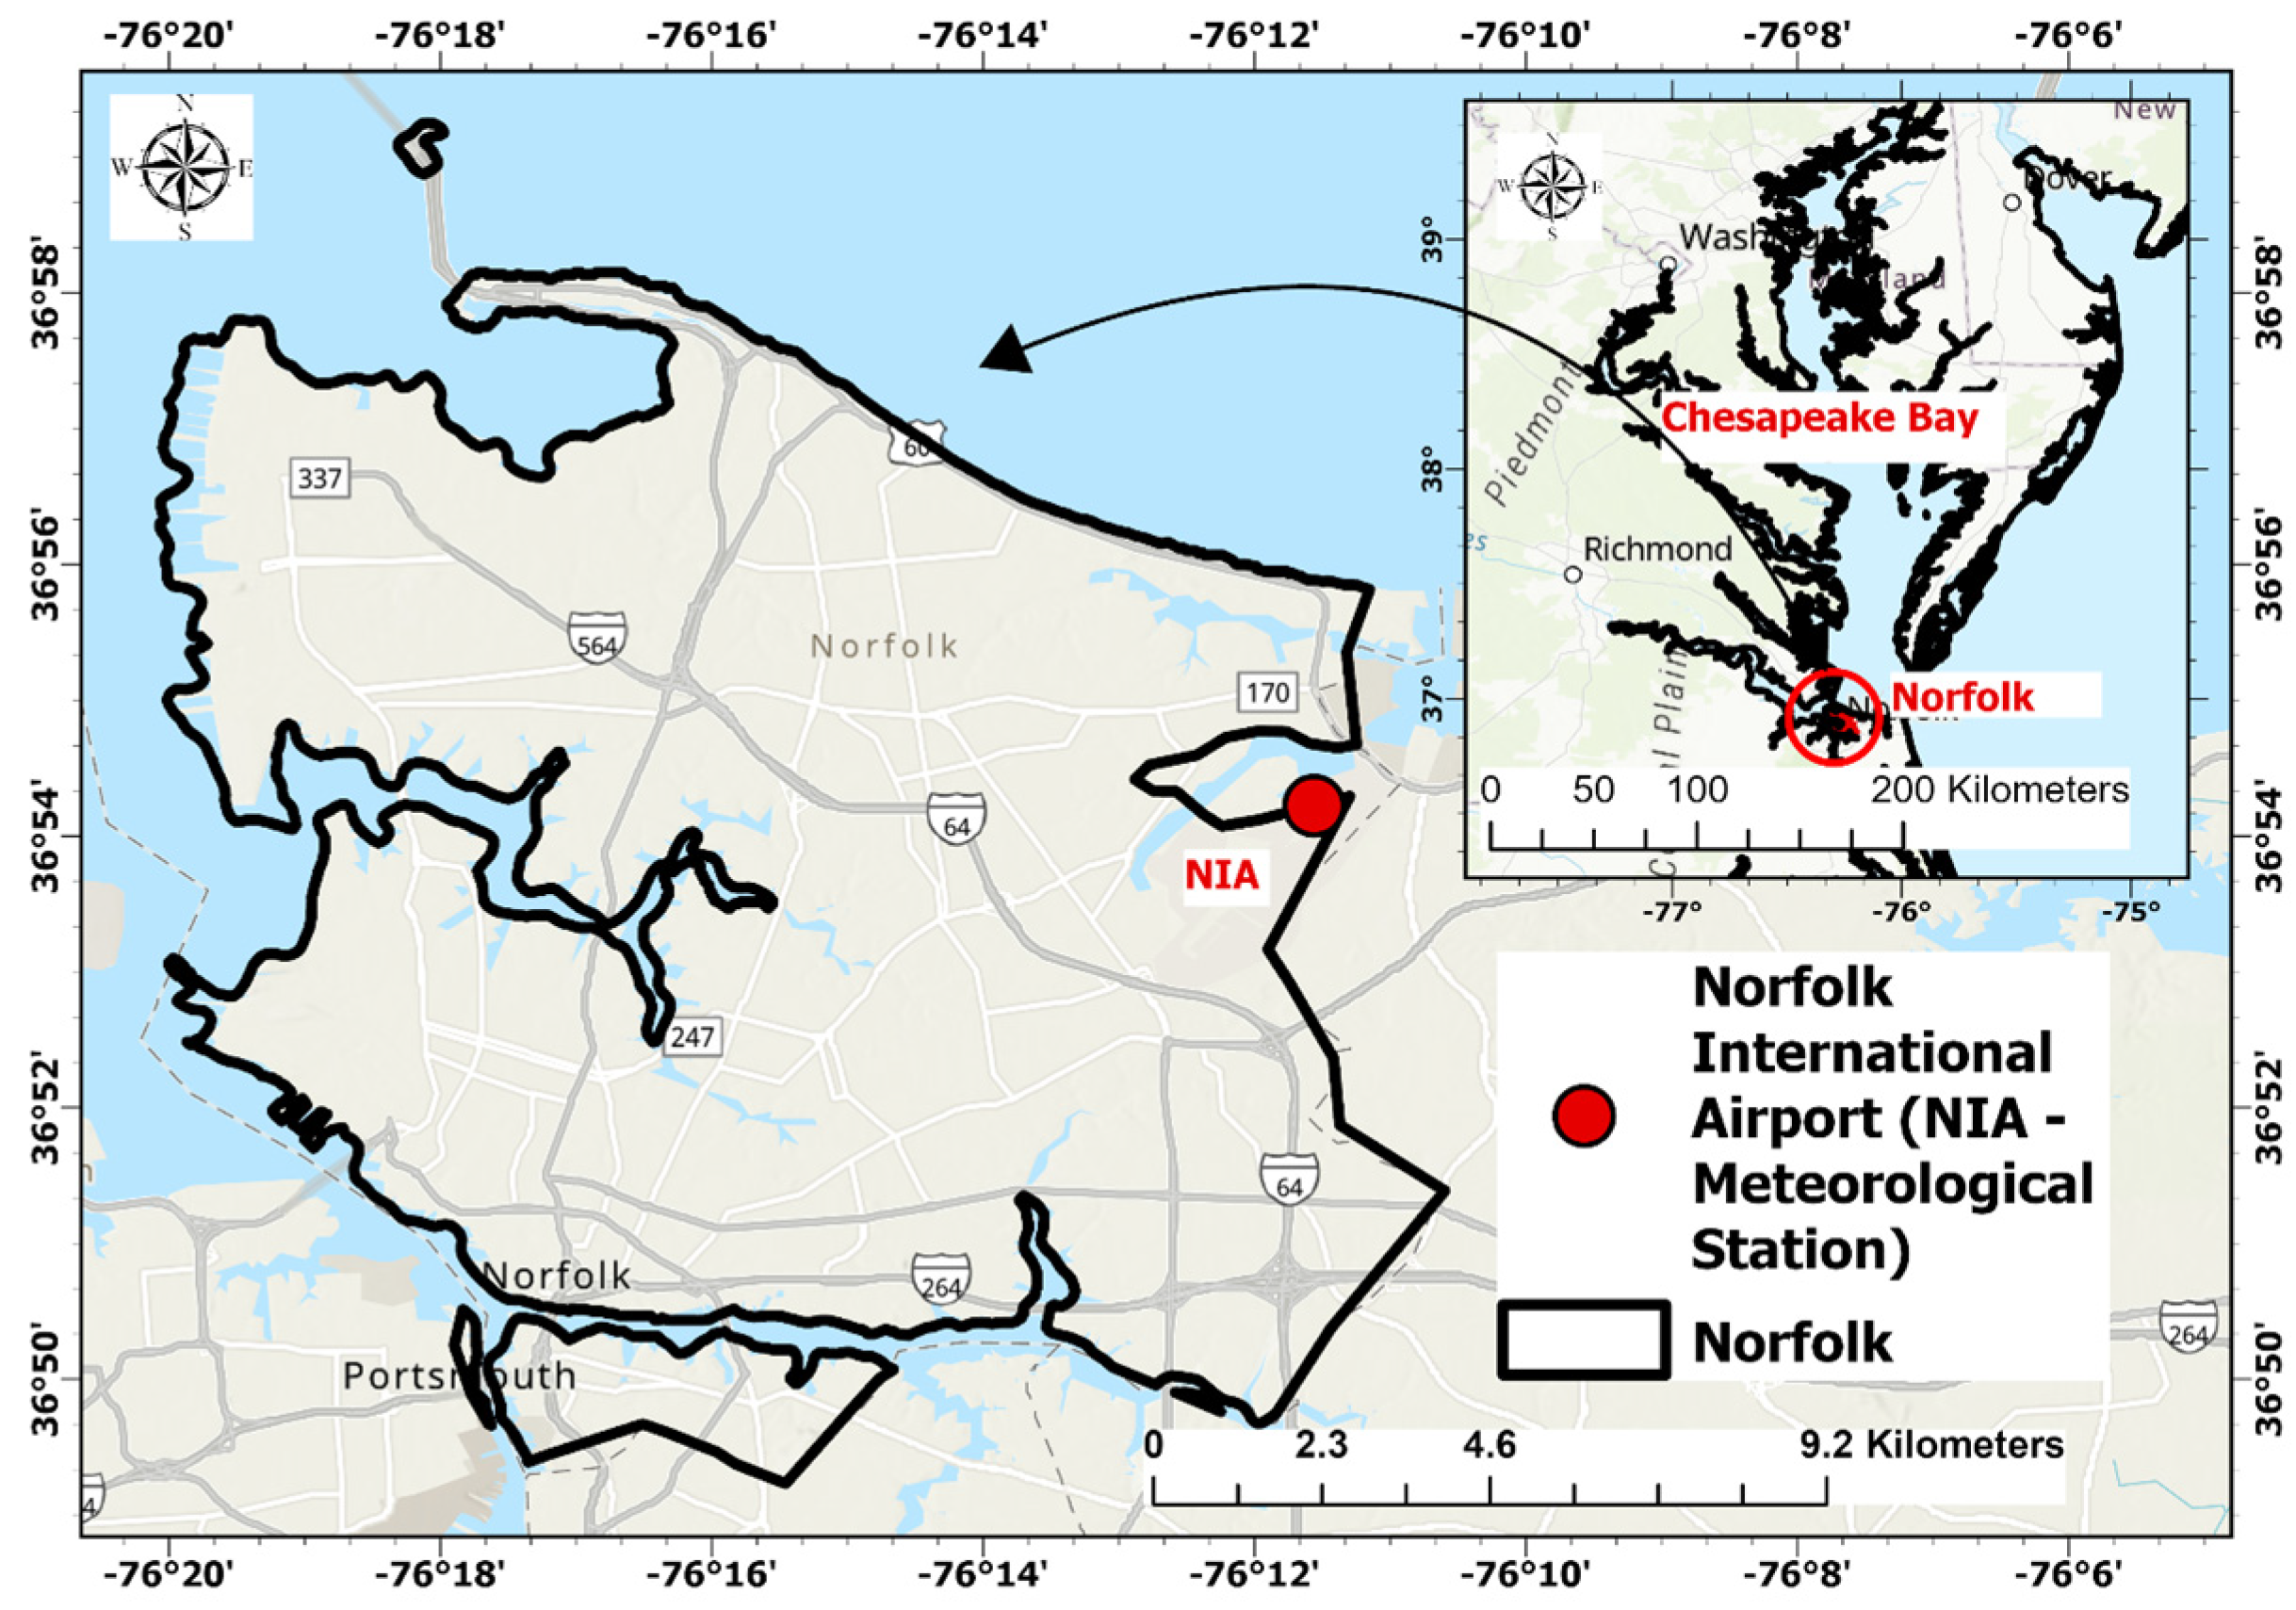
The city of Norfolk is located in southeastern Virginia near the point where the Elizabeth River flows into the Chesapeake Bay (
Figure 1). Known for tourism, Norfolk is a commercial area characterized by its lower elevations and extensive coastline. The region has experienced sinking land due to sea level rises caused by climate change, leading to frequent flooding during high tides. Notably, the highest annual sea level rise reported on the east coast of the USA is at Sewells Point in Norfolk, with an increase of 4.5 mm per year [
40]. Over the last 80 years, the relative sea level has risen by 0.37 m, and projections for 2100 estimate and an increase of 0.39 m to 1.6 m [
40]. These conditions make Norfolk an important case study for evaluating the effectiveness of satellite-based precipitation products (SbPPs) because the city faces significant challenges related to flooding, sea level rise, and urban water management. Accurate and reliable precipitation data are crucial for developing strategies to enhance urban resilience and manage water resources effectively. Globally, the Norfolk–Virginia Beach area ranks 10th for coastal flooding due to sea level rise. NIA is the sole gauging station providing ground-based precipitation data for understanding the impacts of storms and the development of coastal flooding in the area. NIA is located at 36.903° N and −76.193° E with an elevation of 3.3 m above mean sea level (MSL).
Norfolk’s humid subtropical climate brings four distinct seasons: winter, spring, summer, and autumn. In the 21st century, there has been an observed increase in overall annual precipitation and precipitation intensity, contributing to storm surges and severe flooding. The rise in intense precipitation events has led to increased runoff and changes in water quality. These climate trends emphasize the need for accurate precipitation data to inform urban planning and flood mitigation efforts. According to climate change projections, the temperature of Chesapeake Bay is likely to increase by 1.7–2.1 °C in 2050 and 2.0–5.0 °C in 2100 [
40]. These projections necessitate proactive planning and adaptation measures to mitigate the long-term impacts of climate change on Norfolk’s infrastructure and communities.
2.2. Data Collection
The ground-based observed precipitation data for this study were obtained daily from the National Climate Data Center [
40]. This data covers the period from 1 January 2003 to 31 December 2022, specifically for NIA (Network ID: GHCND:USW00013737). Using data from the NCDC ensures the reliability and consistency of ground-based observations. No missing data were identified during the study period for the NIA meteorological station. As an airport station, it ensures precise ground-based precipitation measurements, which are critical for its operations. The NCDC website is a widely trusted resource for meteorological research in the USA. The station utilized a “Tipping Bucket Rain Gauge” from 2003 to 2005 and an “All Weather Precipitation Accumulation Gauge” from 2007 onwards. Errors related to the use of different instruments were considered negligible due to the high accuracy of the instruments and standardized measurement practices. Additionally, satellite precipitation data from the PERSIANN family were acquired through
https://chrsdata.eng.uci.edu/accessed on 28 January 2025. PERSIANN, PERSIANN-Cloud Classification System (CCS), and PERSIANN-Climate Data Record (CDR) satellite precipitation datasets for the period of 2003–2022 were used in this study. These three SbPPs were selected due to their widespread application in various temperate regions, as well as their suitable spatial and temporal resolutions. The choice of the 2003–2022 period for the study stemmed from the availability of CCS data from 2003 onward and the absence of observed precipitation data before 2003. This selection highlights the importance of data availability and continuity in environmental research. While a 30-year period is typically preferred for climatological trend analyses [
41,
42,
43], some studies have used shorter periods to evaluate the suitability of SbPPs and bias correction techniques in regions with limited ground-based precipitation records [
44,
45,
46,
47]. The 20-year dataset provides adequate temporal coverage to assess the effectiveness of these methods in addressing data gaps and improving precipitation estimates. Additionally, previous research has demonstrated the feasibility of climate assessments using datasets shorter than 30 years.
Table 1 presents general information about these SbPPs.
2.3. Methodology
The methodology for this study ensures a rigorous assessment of bias correction techniques and detection capabilities, enhancing the reliability of SbPPs for precipitation estimation and environmental monitoring. Three bias adjustment methods, ABC, MBC, and DTN, were applied to correct systematic errors and align statistical distributions. Their effectiveness was evaluated using statistical metrics such as RMSE, PBias, NOF, and R2. Additionally, the detection capability of PERSIANN, CDR, and CCS datasets was assessed using POD, CSI, FAR, and PC, which measure rainfall detection accuracy and errors. A 1 mm/day threshold was set to distinguish rainfall from non-rainfall days, ensuring accurate validation of SbPPs for hydrological applications.
2.3.1. Bias Adjustment Using Different Approaches
Precipitation data from NCDC and PERSIANN family products were extracted in Excel format. Three methods were employed to adjust biases in various selected SbPPs: 1. multiplicative bias correction (MBC); 2. additive bias correction (ABC); and 3. distribution transformation (DTN). Exploring these different methods provides an excellent opportunity for engineering students to learn about and apply various statistical techniques in real-world data correction scenarios. In the ABC approach, mean values of satellite and observed precipitation data were calculated separately to identify systematic errors. Subsequently, this error was subtracted from each satellite data point to align the two mean values, as represented in Equation (1). This method emphasizes the importance of correcting systematic errors in data analysis.
In the MBC method, a ratio was calculated using the mean values of satellite and observed datasets, and this ratio was then multiplied with each satellite data point, as presented in Equation (2). This approach illustrates the process of normalizing relative differences between datasets.
The DTN approach compares statistical distributions of daily observed and SbPP datasets at a specific gauging station. It aligns the SbPP distribution with the observed distribution, correcting differences in mean and variation. Equations (3) and (4) provide correction factors for mean and variation, demonstrating the significance of aligning statistical distributions in bias adjustment. These were then applied to compute the corrected SbPP using Equation (5).
where
µf,
µOBS,
µSbPP,
τf,
τOBS,
τSbPP,
SbPPc, and
SbPPo are the correction factor for mean, the mean of observed data, the mean of SbPP data, the correction factor for variation, the standard deviation of observed data, the standard deviation of SbPP data, the corrected SbPP, and the uncorrected SbPP, respectively.
2.3.2. Statistical Evaluation of SbPPs
Statistical indices and detection capability indices were used to evaluate the accuracy of PERSIANN, CDR, and CCS datasets. The ground-based precipitation detection capability in selected SbPPs was assessed by calculating the probability of detection (POD), critical success index (CSI), false alarm ratio (FAR), and proportion correct (PC) [
55,
56,
57,
58]. These indices are crucial for understanding the practical aspects of data validation and error analysis in hydrological studies. POD assesses the likelihood of correctly detecting rainfall, while CSI measures accurate rain estimation and mitigates false negatives. FAR evaluates the proportion of falsely diagnosed satellite events, and PC signifies the overall accuracy of detected rainfall. The equations used to calculate these indices, POD, CSI, FAR, and PC, are represented by Equations (6)–(9), respectively.
The symbols of hits (number of times both observed and satellite rainfall data correctly indicate rainfall), misses (number of times observed rainfall occurred, but the satellite data did not detect it), false alarms (number of times the satellite data indicates rainfall, but no rainfall is observed), and correct negatives (number of times both observed and satellite data correctly indicate the absence of rainfall) are detailed in
Table 2. Understanding these concepts enhances understanding of the complexities involved in real-world data analysis and the importance of accuracy in environmental monitoring. In this study, a threshold of 1 mm/day was set to differentiate between rainfall days and non-rainfall days [
58,
59,
60].
The accuracy in precipitation estimates of SbPPs was determined by root mean square error (RMSE), percent bias (PBias), coefficient of correlation (R
2), and normalized objective function (NOF) using Equations (10)–(13) [
61].
Si, Oi, n, Omean, and Smean are satellite-based precipitation, ground-based precipitation, total number of observations, mean of ground-based precipitation and mean of satellite-based precipitation, respectively.
3. Results and Discussion
3.1. Bias Adjustments Applicability for Mean Monthly Precipitation
Figure 2 presents the magnitudes of mean monthly precipitation for PERSIANN, CCS, and CDR SbPPs compared to observed precipitation before and after applying different bias adjustment methods for NIA. It was found that SbPPs, both before bias adjustment and after the application of the ABC, tend to overestimate when compared to observed mean monthly precipitation. The ABC method tends to overestimate precipitation because it applies a constant offset to align mean values, failing to account for variations in bias across different rainfall intensities. This limitation arises from the method’s simplicity, which does not address the non-uniform distribution of precipitation or variability in systematic errors. This overestimation emphasizes the critical need for bias adjustment prior to utilizing SbPPs in hydrological studies and suggests that the ABC method may not be suitable for NIA. The MBC and DTN methods offer more accurate monthly precipitation estimates when compared to observed data. Specifically, the average mean monthly precipitation for CCS, CDR, and PERSIANN SbPPs is adjusted to increase the magnitude by 0.09%, 0.10%, and 0.15% using the MBC method, and by 21.36%, 31.74%, and 19.27% using the DTN method. These findings highlight the effectiveness of both MBC and DTN methods in hydro-meteorological studies, with MBC providing slightly more precise estimations. CCS, after bias adjustment using the MBC method, provides the best estimates compared to observed mean monthly precipitation data. However, when considering both the MBC and DTN methods, the DTN method for CDR yields the poorest estimation.
The maximum observed mean monthly precipitation is recorded in September 2016. However, the bias-corrected SbPPs through MBA and DTN methods show maximum values in July 2016. The adjustments in maximum mean monthly precipitation for CCS, CDR, and PERSIANN SbPPs were +0.96%, −24.78%, and −6.65%, respectively, using the MBC method, and +30.18%, +11.56%, and +16.11% respectively using the DTN method, demonstrating significant alterations compared to the observed maximum monthly precipitation. Consequently, CCS, when adjusted using the MBC method, emerges as the most aligned with the observed maximum monthly precipitation, underscoring its efficacy in capturing peak precipitation events.
The minimum observed mean monthly precipitation was recorded in November 2007, and interestingly, the CCS product, when adjusted using both MBC and DTN methods, mirrored this observation in the same month and year. The adjustments in minimum mean monthly precipitation for CCS, CDR, and PERSIANN were −0.19%, +1.18%, and +1.07% respectively using the MBC method, and −0.70%, +0.63%, and +1.04% using the DTN method. These adjustments highlight the CCS product’s precision, particularly with the MBC method, as the best fit. Overall, CCS data, when adjusted using the MBC method, is recommended for use in hydro-meteorological studies due to its consistent performance in aligning with both maximum and minimum observed monthly precipitation values.
3.2. Evaluation of Detection Capability
Table 3 provides the detection capability obtained for CCS, CDR, and PERSIANN SbPPs, both before and after bias adjustments. This evaluation is fundamental for understanding the effectiveness of different bias adjustment methods in improving the accuracy of satellite-based precipitation products. The table compares the capabilities of each SbPP in accurately detecting precipitation events, which is critical in hydro-meteorological studies. Analyzing these results helps determine which SbPPs, coupled with specific bias adjustments, offer the most reliable precipitation detection, a vital component for accurate weather forecasting and water resource management. The detection capability assessment includes metrics such as the probability of detection (POD), critical success index (CSI), false alarm ratio (FAR), and proportion correct (PC). These metrics collectively provide a comprehensive understanding of the strengths and limitations of each SbPP under various meteorological conditions. This detailed evaluation is crucial not only for researchers and practitioners in the field but also offers a tangible example for engineering students, illustrating the importance of statistical analysis in environmental monitoring and decision-making.
According to
Table 3, POD and FAR results decreased after bias adjustment, while the CSI and PC indices improved. Ideally, POD values should show increments after bias adjustments, aiming for a perfect score of 1 [
62]. However, none of the selected SbPPs and bias adjustment methods fully met this requirement. Despite this, the CSI, FAR, and PC detection capability indices demonstrated notable improvements post-bias adjustments. A perfect score for CSI and PC indices is 1, and for FAR, it is 0. PC index values for all detection capability indices, considering ABC, MBC, and DTN, as well as before bias adjustment scenarios, provided satisfactory values above 0.5. Specifically, the PC index showed the best scores with the MBC method for all SbPPs, although the DTN method also yielded satisfactory PC values close to those obtained with the MBC method.
Overall, after bias adjustment, all detection capability indices considering the three bias adjustment methods indicated PERSIANN as the best SbPP, except in the case of the FAR index in the MBC method. The values obtained for each detection capability index vary slightly, depending on the SbPPs and bias adjustment methods used. Furthermore, POD, CSI, FAR, and PC indices work best with ABC, DTN, MBC, and MBC methods, respectively. Thus, both MBC and DTN methods are recommended for use, considering detection capability indices with PERSIANN SbPP, due to their overall effectiveness in improving the accuracy of satellite precipitation data.
3.3. Statistical Evaluation of Suitability of SbPPs
This study utilized monthly satellite-based precipitation and ground-based observed precipitation to calculate various statistical indices. The rationale for using monthly precipitation data to evaluate NOF, PBias, R
2, and RMSE values includes several key factors. Firstly, smoothing variability aids in achieving a stable representation of overall precipitation patterns, which is crucial for easily identifying long-term trends and patterns. This approach is particularly effective for reducing the impacts caused by short-term uncertainties. Secondly, the hydrological relevance of monthly data is significant as hydrological processes, such as groundwater recharge and streamflow, are most often impacted by precipitation through monthly variations. Thirdly, using monthly data enhances computational efficiency and ensures statistical stability. Finally, this method aligns better with seasonal variations in precipitation, making monthly comparisons more meaningful and insightful for understanding the broader climatic and environmental context [
63]. Incorporating these statistical evaluations offers a comprehensive view of the accuracy and reliability of SbPPs in hydro-meteorological research, providing a methodical approach for analyzing precipitation data that can be valuable in both academic and practical applications.
Table A1 in the
Appendix A demonstrates the performance of statistical indices for NIA: NOF, PBias, RMSE, and R
2 for CCS, CDR, and PERSIANN SbPPs on both a monthly and seasonal basis (winter: December-February, spring: March–May, summer: June–August, and autumn: September–November) within the period 2003–2022. According to
Figure 2, MBC and DTN methods show satisfactory results compared to pre-bias adjustment for CCS, CDR, and PERSIANN SbPPs, except in a few cases for R
2 during monthly, winter, and summer analyses for PERSIANN and CCS SbPPs. Ideal values for NOF, PBias, RMSE, and R
2 are 0, 0, 0, and 1, respectively. Autumn and spring seasons yield satisfactory results across all statistical indices for the three SbPPs. The values of NOF, PBias, RMSE, and R
2 for all SbPPs, considering MBC and DTN bias adjustment methods monthly, ranged between 0.38 and 0.75, 0.09% and 31.74%, 0.05 and 0.10, and 0.40–0.79, respectively. The CDR SbPP displayed the best performance for both monthly and all seasonal analyses using both MBC and DTN bias adjustment methods, generally followed by the PERSIANN SbPP as the second-best performer. Seasonal variations can influence bias correction effectiveness, particularly in regions with distinct wet and dry seasons. In Virginia, August days are typically hot and humid, while January days are generally cold and dry, which can impact the accuracy of bias adjustment methods.
The findings of this study, while specific to Norfolk, Virginia, offer significant potential for application in other coastal regions facing similar urban challenges, such as flood management and urban resilience under changing precipitation patterns. This analysis revealed that the ABC method tended to overestimate mean monthly precipitation, which may limit its effectiveness in accurately representing local precipitation dynamics. In contrast, the CCS, adjusted using the MBC method, was identified as the most accurate bias-adjusted model for Norfolk. These results highlight the importance of carefully evaluating and selecting bias correction techniques based on local climatic and hydrological characteristics to achieve optimal results. By tailoring these methods to the unique conditions of other regions, this framework can be adopted to enhance urban planning, infrastructure design, and disaster management strategies. Furthermore, the comparative evaluation of bias correction techniques presented in this study provides critical insights for practitioners and researchers into the performance and limitations of different adjustment methods, depending on the quality and availability of precipitation data. Future research should focus on extending this methodology to other regions with varying climatic and topographical characteristics to further enhance the understanding of precipitation variability and the practical application of SbPPs. This adaptable and robust approach strengthens the study’s relevance beyond Norfolk, enabling its application to diverse urban areas worldwide with similar topographical and climatic patterns.
3.4. Uncertainities in SbPPs After Bias Adjustments and Future Recommendations
This analysis indicates that before adjustment and when using the ABC method, SbPPs consistently overestimated precipitation compared to observed values. However, the MBC and DTN methods provided more precise adjustments, reducing bias and improving alignment with observed data. The mean monthly precipitation adjustments for CCS, CDR, and PERSIANN SbPPs using MBC were +0.09%, +0.10%, and +0.15%, respectively, while DTN adjustments were +21.36%, +31.74%, and +19.27%, respectively. These findings suggest that MBC provides a more refined correction, whereas DTN results in larger adjustments, particularly for CDR. For extreme precipitation events, while the maximum observed mean monthly precipitation occurred in September 2016, bias-adjusted SbPPs shifted the peak to July 2016, with MBC adjustments of +0.96% (CCS), −24.78% (CDR), and −6.65% (PERSIANN) and DTN corrections of +30.18% (CCS), +11.56% (CDR), and +16.11% (PERSIANN), demonstrating MBC’s closer alignment with observed peak precipitation, particularly for CCS.
The evaluation of detection capability shows that while POD values decreased after bias adjustment from 0.89–0.93 (before) to 0.19–0.82 (after), CSI improved, increasing from 0.07–0.10 (before) to 0.12–0.23 (after). Additionally, FAR values reduced from 0.90–0.93 (before) to 0.58–0.88 (after), and PC improved from 0.55–0.71 (before) to 0.78–0.96 (after). Among the SbPPs, PERSIANN demonstrated the best detection capability after bias adjustment, except for minor inconsistencies in FAR under the MBC method. The MBC and DTN methods effectively reduced errors across most indices, making them the preferred bias correction techniques. However, the variability in detection performance across SbPPs highlights inherent uncertainties in bias correction, suggesting that method selection should be tailored to the precipitation characteristics and hydrological applications of a given study area.
The uncertainty analysis of bias-adjusted SbPPs was assessed using statistical indices NOF, PBias, RMSE, and R2 for CCS, CDR, and PERSIANN on a monthly and seasonal basis from 2003 to 2022, with post-adjustment error ranges of NOF: 0.38–0.75, PBias: 0.09–31.74%, RMSE: 0.05–0.10, and R2: 0.40–0.79. These results demonstrate satisfactory improvements with MBC and DTN methods, although R2 inconsistencies in monthly, winter, and summer analyses for PERSIANN and CCS highlight prolonged uncertainties that necessitate further enhancement in bias correction techniques.
While SbPPs offer valuable information for various applications, uncertainties persist even after bias-correction [
64]. Bias adjustment methods correct systematic errors in SbPPs, but their effectiveness varies depending on study areas, seasons, and precipitation event characteristics. SbPPs often feature coarser spatial and temporal resolutions than ground-based measurements, introducing significant uncertainties in small-scale and short-duration precipitation events. This limitation is particularly crucial in flash flood event-related applications. Additionally, uncertainties often arise in satellite precipitation estimates created from algorithms using infrared and microwave observations, especially in areas with complex terrains and mixed phase precipitations.
Topography also introduces uncertainties in satellite-based precipitation estimates, with orographic effects in mountainous areas significantly impacting precipitation patterns. Cloudy conditions further complicate satellite observations, increasing uncertainties, particularly during extreme precipitation events. Therefore, users of SbPPs must be aware of these limitations and apply them cautiously in decision-making and research.
Due to the aforementioned reasons, it is crucial for users relying on SbPPs to be cognizant of these uncertainties and employ them judiciously for decision-making and research purposes. Mitigating these uncertainties is essential, and this can be achieved through validation processes using both satellite data and ground-based observations. Recommendations for future research encompass conducting similar studies in diverse locations, including Virginia and other geographically distinct areas. Additionally, similar investigations using alternative SbPPs such as the Tropical Rainfall Measuring Mission Multi-Satellite Precipitation Analysis (TMPA) and IMERG available at
https://disc.gsfc.nasa.gov/ accessed on 15 January 2025 are warranted. Investigating temporal trends in precipitation biases over extended periods and incorporating hydrological models to assess the impact of bias-adjusted SbPPs on hydrological simulations will offer a more comprehensive understanding of the implications of bias adjustments.
Norfolk’s coastal, flat, and low-lying topography both challenges and benefits the accuracy of satellite-based precipitation estimates. On one hand, coastal regions experience highly localized precipitation patterns due to land-sea interactions and mixed precipitation types from subtropical systems, which can complicate satellite detection and increase uncertainties. On the other hand, the relatively uniform landscape reduces complications associated with complex terrain, such as signal interference or precipitation shadowing, enabling more consistent satellite measurements. These factors highlight the importance of bias correction methods to enhance the reliability of satellite-based precipitation products in Norfolk.
This study acknowledges the limitation of using a single weather station (NIA) for validating SbPPs in Norfolk, VA, due to the absence of other long-term stations with reliable precipitation records. While multiple station comparisons could enhance robustness, surrounding stations have different geographic and climatic conditions, limiting their relevance to Norfolk’s unique hydrological challenges. Future research should focus on integrating additional meteorological data sources while also developing methods to incorporate short-term or temporary stations and leveraging high-resolution remote sensing and machine learning techniques to enhance SbPP validation, refine precipitation estimates, and improve bias-correction methods for coastal urban environments. Despite this limitation, SbPPs are crucial for regions like Norfolk, where ground-based measurements are constrained by sparse rain gauge networks. By providing broad spatial coverage and indirect precipitation estimates, SbPPs support rainfall monitoring and flood management. With advancements in data quality and retrieval algorithms, they will play an increasingly vital role in addressing coastal cities’ hydrometeorological challenges.
3.5. Enhancing Urban Resilience: The Significance of Implementing Improved Bias Adjustment Methods in SbPPs
This study holds significant importance for the field of civil and environmental engineering, particularly in urban resilience and climate adaptation planning. The reasons for this are manifold. Primarily, by identifying reliable SbPPs and understanding the variability of bias adjustment methods across different geographical locations, these findings become applicable to a wide range of urban planning and civil engineering scenarios. Accurate precipitation data is crucial for infrastructure planning and design, ensuring that structures are capable of withstanding environmental impacts like floods and erosions. Thus, the implementation of improved bias adjustment methods is essential in creating well-designed, resilient structures and in minimizing errors when utilizing SbPPs.
For urban planners and civil engineers, precise precipitation estimates are indispensable for effective decision-making in water resource management, playing a significant role in developing sustainable urban environments. These professionals are at the forefront of developing adaptive strategies to mitigate the impacts of climate change. Through the use of reliable SbPPs and improved bias adjustment methods, professionals, researchers, and policymakers gain a comprehensive understanding necessary to identify precipitation patterns and develop resilient infrastructure and sustainable practices. In Norfolk, a flood-prone area, the best-performing satellite-based precipitation product (CCS with MBC) can be applied to improve flood management and urban planning, particularly for areas with missing data stations. Bias-corrected precipitation data can be integrated into early warning systems and flood forecasting models to enhance prediction accuracy. This data is also valuable for optimizing urban drainage systems, conducting flood risk assessments, and planning climate-resilient infrastructure, such as retention basins and flood barriers. Furthermore, incorporating corrected SbPP data into GIS-based tools can improve decision-making processes, while training programs for engineers and planners can ensure effective application in urban planning and disaster preparedness. These steps can enhance Norfolk’s resilience to extreme weather events and address data gaps effectively.
Importantly, this study contributes directly to the improvement of practices in urban resilience by illustrating the practical application of contemporary methods in satellite-based precipitation analysis. It emphasizes the importance of adapting techniques to specific contexts, a critical skill in the evolving field of urban planning and civil engineering. The identification of improved bias adjustment methods and the reliability of SbPPs are crucial for professionals to recognize and address real-world challenges, equipping them with advanced tools and techniques essential for modern urban resilience strategies.
The PERSIANN family of satellite products was selected over alternatives, like GPM-IMERG, TRMM, TMPA-3B42, and TMPA-3B42-RT, due to its adaptability across various spatial and temporal scales, its established track record in hydrology and climate studies, and its suitability for comprehensive evaluation of performance in relation to bias adjustment methods in a coastal urban area like Norfolk. However, future studies could explore the use of other satellite products, such as GPM-IMERG, TRMM, TMPA-3B42, and TMPA-3B42-RT, to assess their suitability for coastal regions like Norfolk, potentially offering further insights into precipitation estimation and bias adjustment effectiveness in such environments.
4. Conclusions
This study contributes to enhancing knowledge by familiarizing learners with widely used methods in satellite-based precipitation analysis. The identification of improved bias adjustment methods and reliable SbPPs is crucial for future engineers tasked with addressing real-world challenges using advanced tools. In this research, three SbPPs (PERSIANN, CCS, and CDR) and three bias adjustment methods (additive bias correction (ABC), multiplicative bias correction (MBC), and distribution transformation (DTN)) were evaluated to determine the most suitable combinations in comparison to ground-based precipitation data.
The ABC method was found to be unsuitable for Norfolk, Virginia, as it consistently overestimated mean monthly precipitation for all three SbPPs. Conversely, the MBC method resulted in modest increases (0.09%, 0.10%, and 0.15%), while the DTN method showed more substantial changes (21.36%, 31.74%, and 19.27%) in aligning with observed precipitation. The CCS, when adjusted using the MBC method, was identified as the best bias-adjusted combination, considering averages, minimums, and maximums in mean monthly precipitation. Similarly, they alter maximum mean monthly precipitation estimates, with the MBC method adjusting CCS, CDR, and PERSIANN SbPPs by +0.96%, −24.78%, and −6.65%, respectively, while the DTN method results in larger adjustments of +30.18%, +11.56%, and +16.11%, underscoring MBC’s superior accuracy in capturing peak precipitation events. For minimum mean monthly precipitation, adjustments using the MBC method were −0.19%, +1.18%, and +1.07% for CCS, CDR, and PERSIANN, respectively, while the DTN method resulted in −0.70%, +0.63%, and +1.04%, further reinforcing CCS, particularly with MBC, as the most reliable for hydro-meteorological studies.
Detection capability indices suggested PERSIANN as the most effective SbPP, with MBC and DTN methods recommended for optimal use. While POD values decreased from 0.89–0.93 to 0.19–0.82 after bias adjustment, CSI and PC indices improved from 0.07–0.10 to 0.12–0.23 and from 0.55–0.71 to 0.78–0.96, respectively, with FAR values also reducing from 0.90–0.93 to 0.58–0.88, confirming that MBC and DTN effectively enhance detection capability, particularly for PERSIANN, despite some inconsistencies in FAR under MBC. Additionally, statistical indices for NOF, PBias, RMSE, and R2 after MBC and DTN adjustments ranged between 0.38 and 0.75, 0.09% and 31.74%, 0.05 and 0.10, and 0.40 and 0.79, respectively, with CDR demonstrating the best performance across both monthly and seasonal analyses, followed by PERSIANN, reinforcing their reliability for hydro-meteorological applications. The CDR demonstrated the highest performance across all seasons and monthly assessments with both MBC and DTN methods, suggesting the applicability of these methods for PERSIANN, CCS, and CDR SbPPs in the context of Norfolk, Virginia.
The study also highlights the uncertainties in SbPPs, influenced by factors such as systematic errors, topography, characteristics of precipitation, and cloudy conditions. Future research should include conducting similar studies with various SbPPs for different regions, including Virginia, to gain a broader understanding of precipitation pattern changes across diverse areas. Future studies are suggested to explore advanced spatial interpolation methods, such as Kriging or multiple linear regression, for further improvement. This research contributes to advancing the practical applications of urban resilience and climate adaptation strategies, offering valuable insights and guidance for future research in this critical field.


