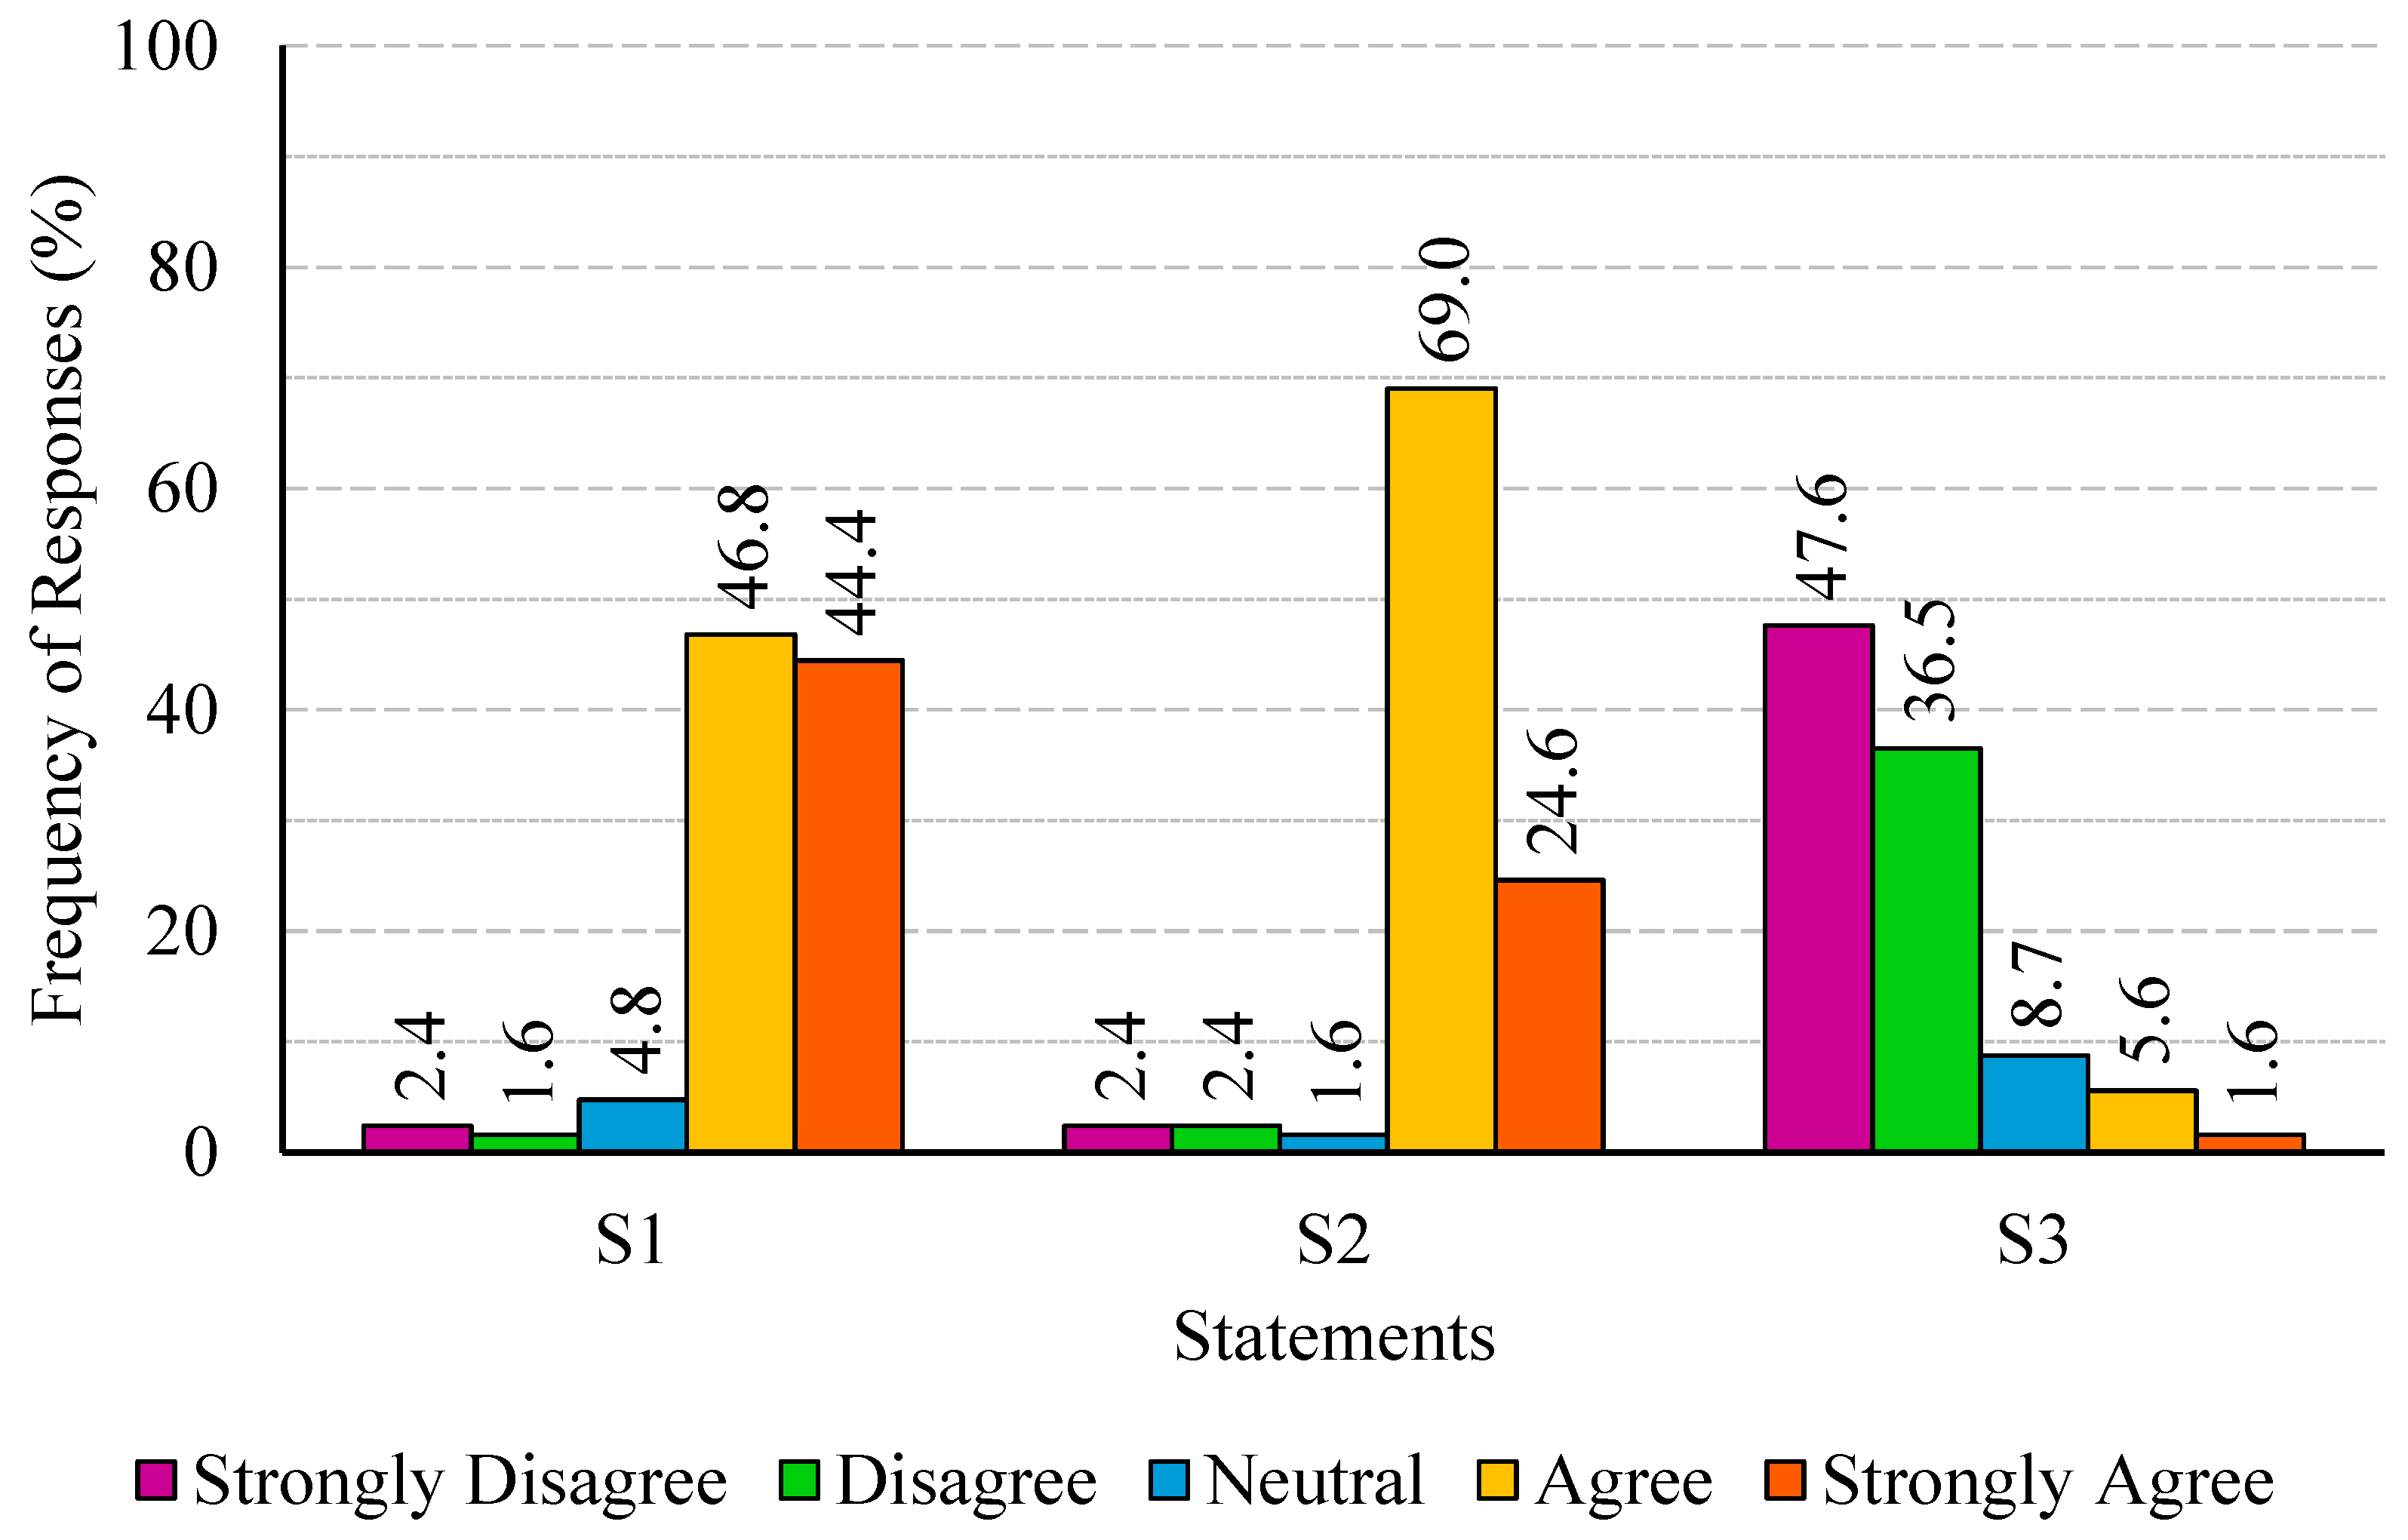
Figure 1.
Percentage distribution of responses regarding job satisfaction (statements S1 to S3).
Figure 1.
Percentage distribution of responses regarding job satisfaction (statements S1 to S3).
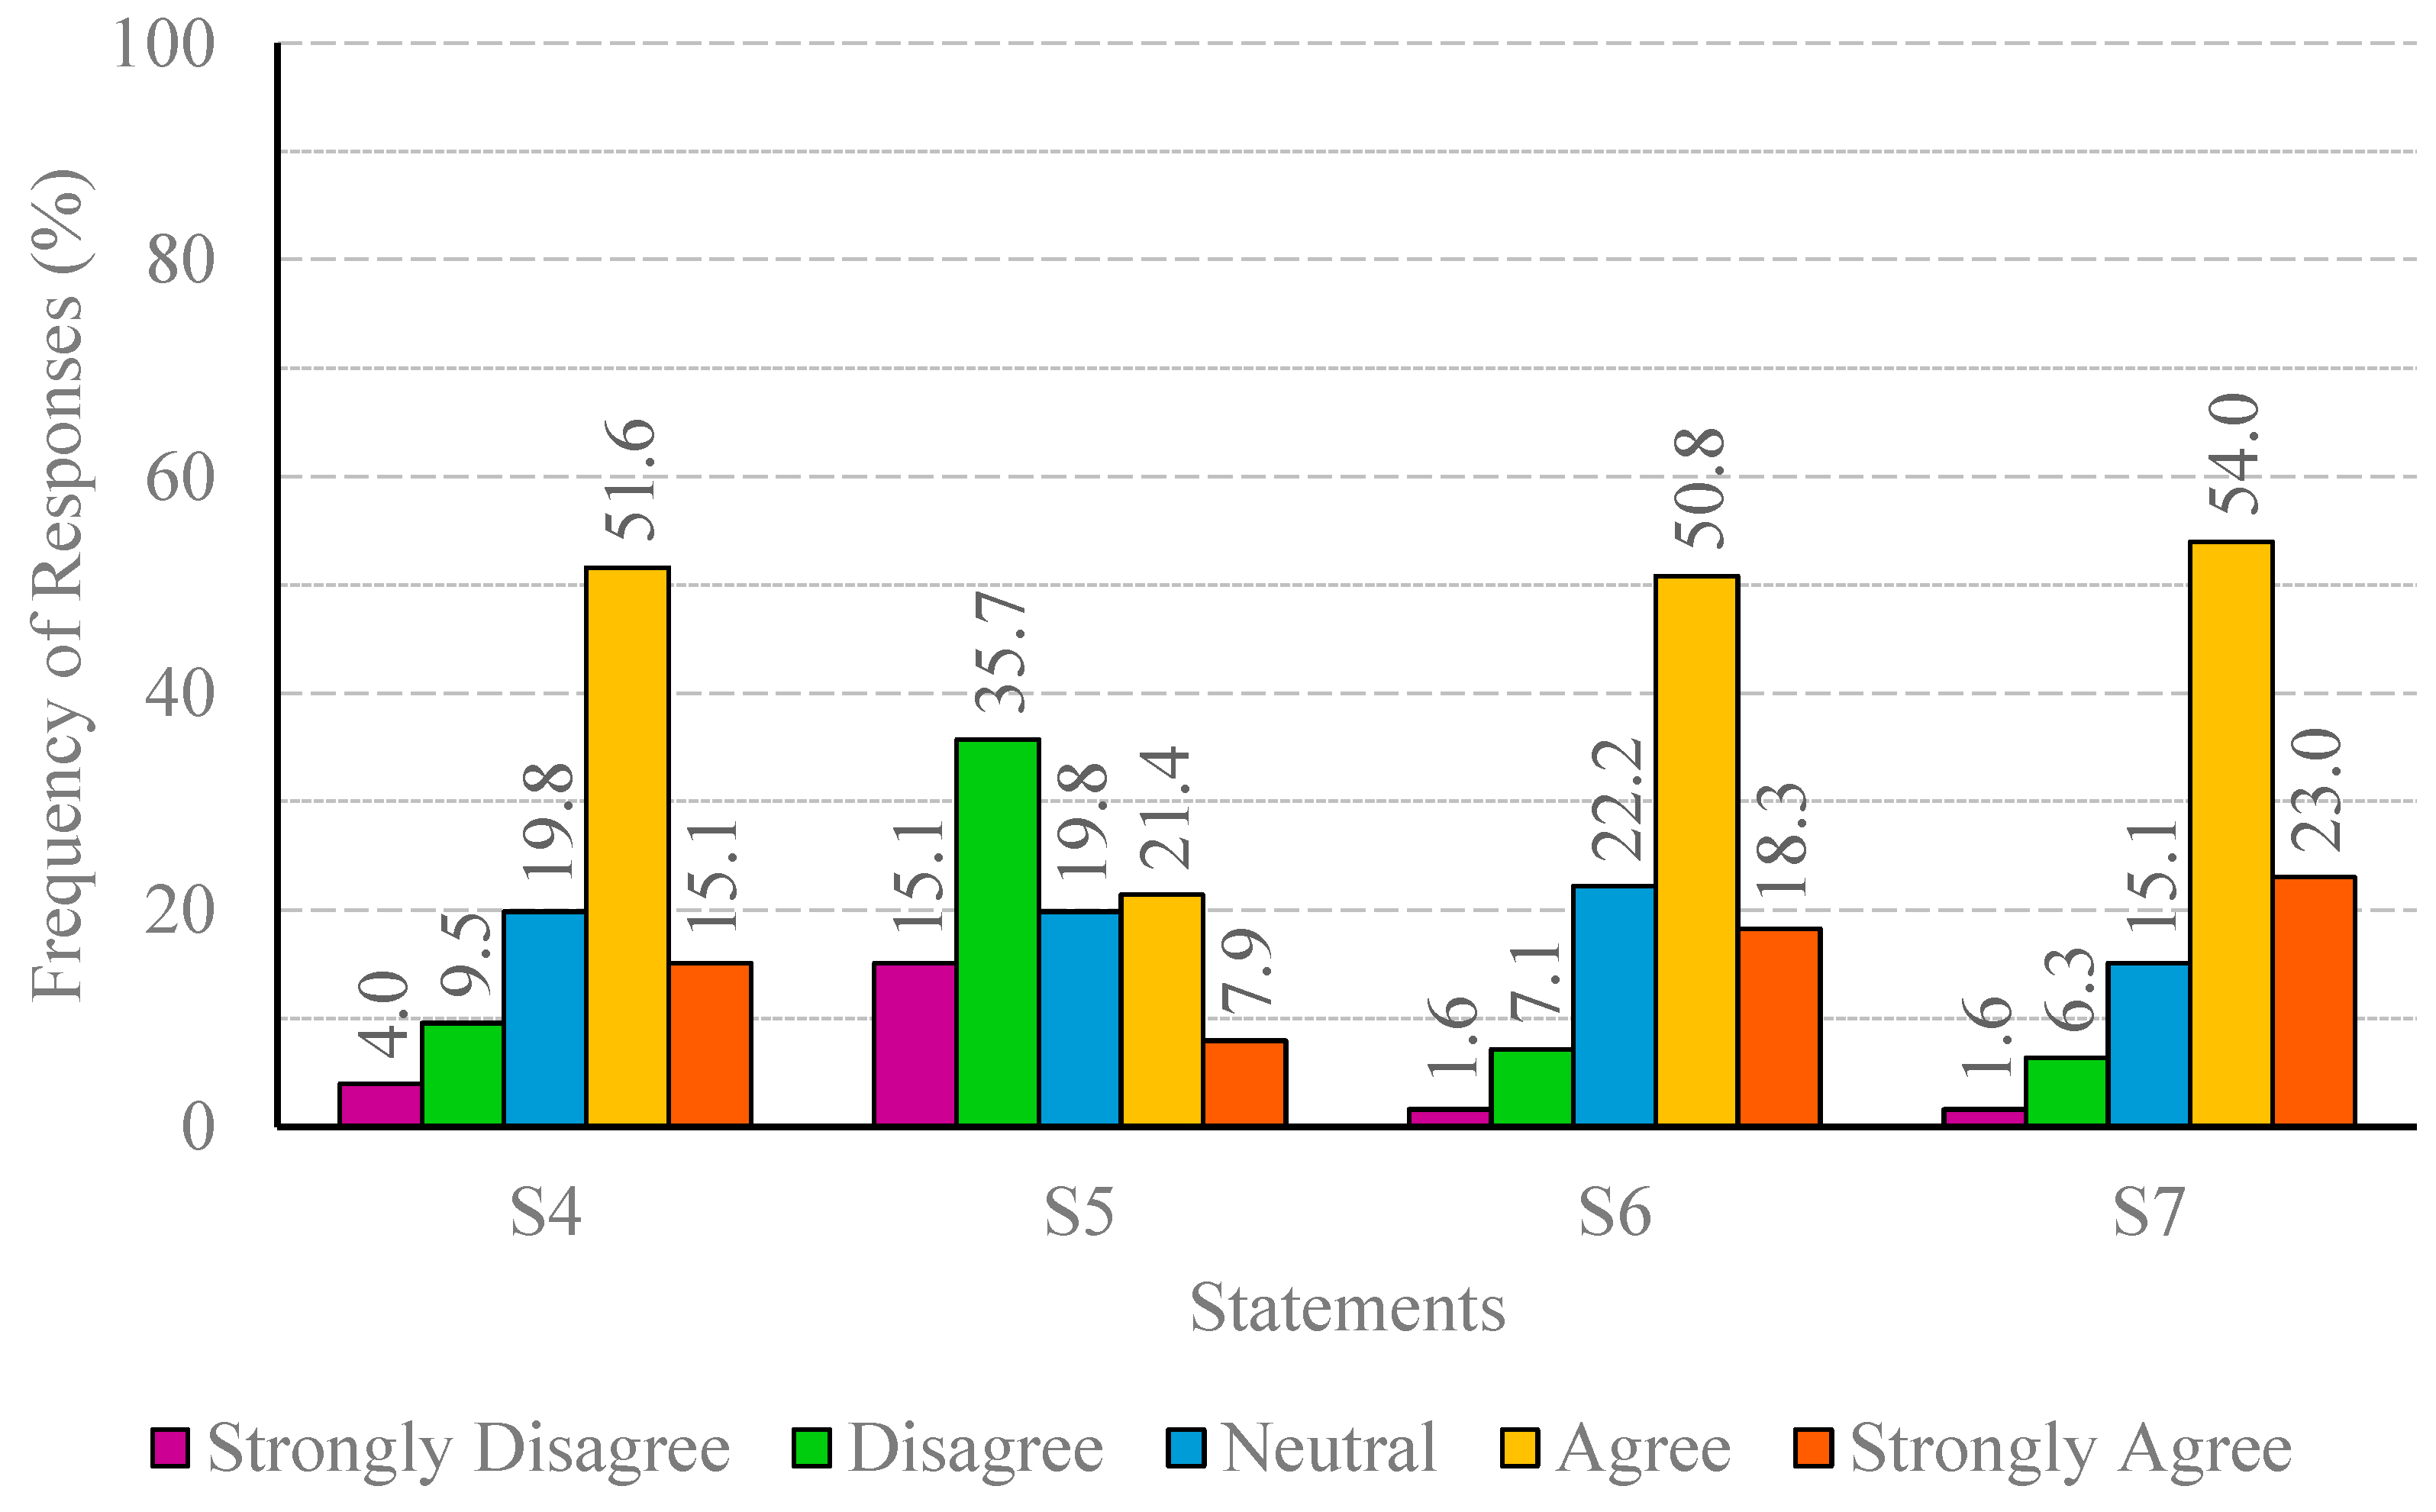
Figure 2.
Percentage distribution of responses regarding AI-powered tools (statements S4 to S7).
Figure 2.
Percentage distribution of responses regarding AI-powered tools (statements S4 to S7).
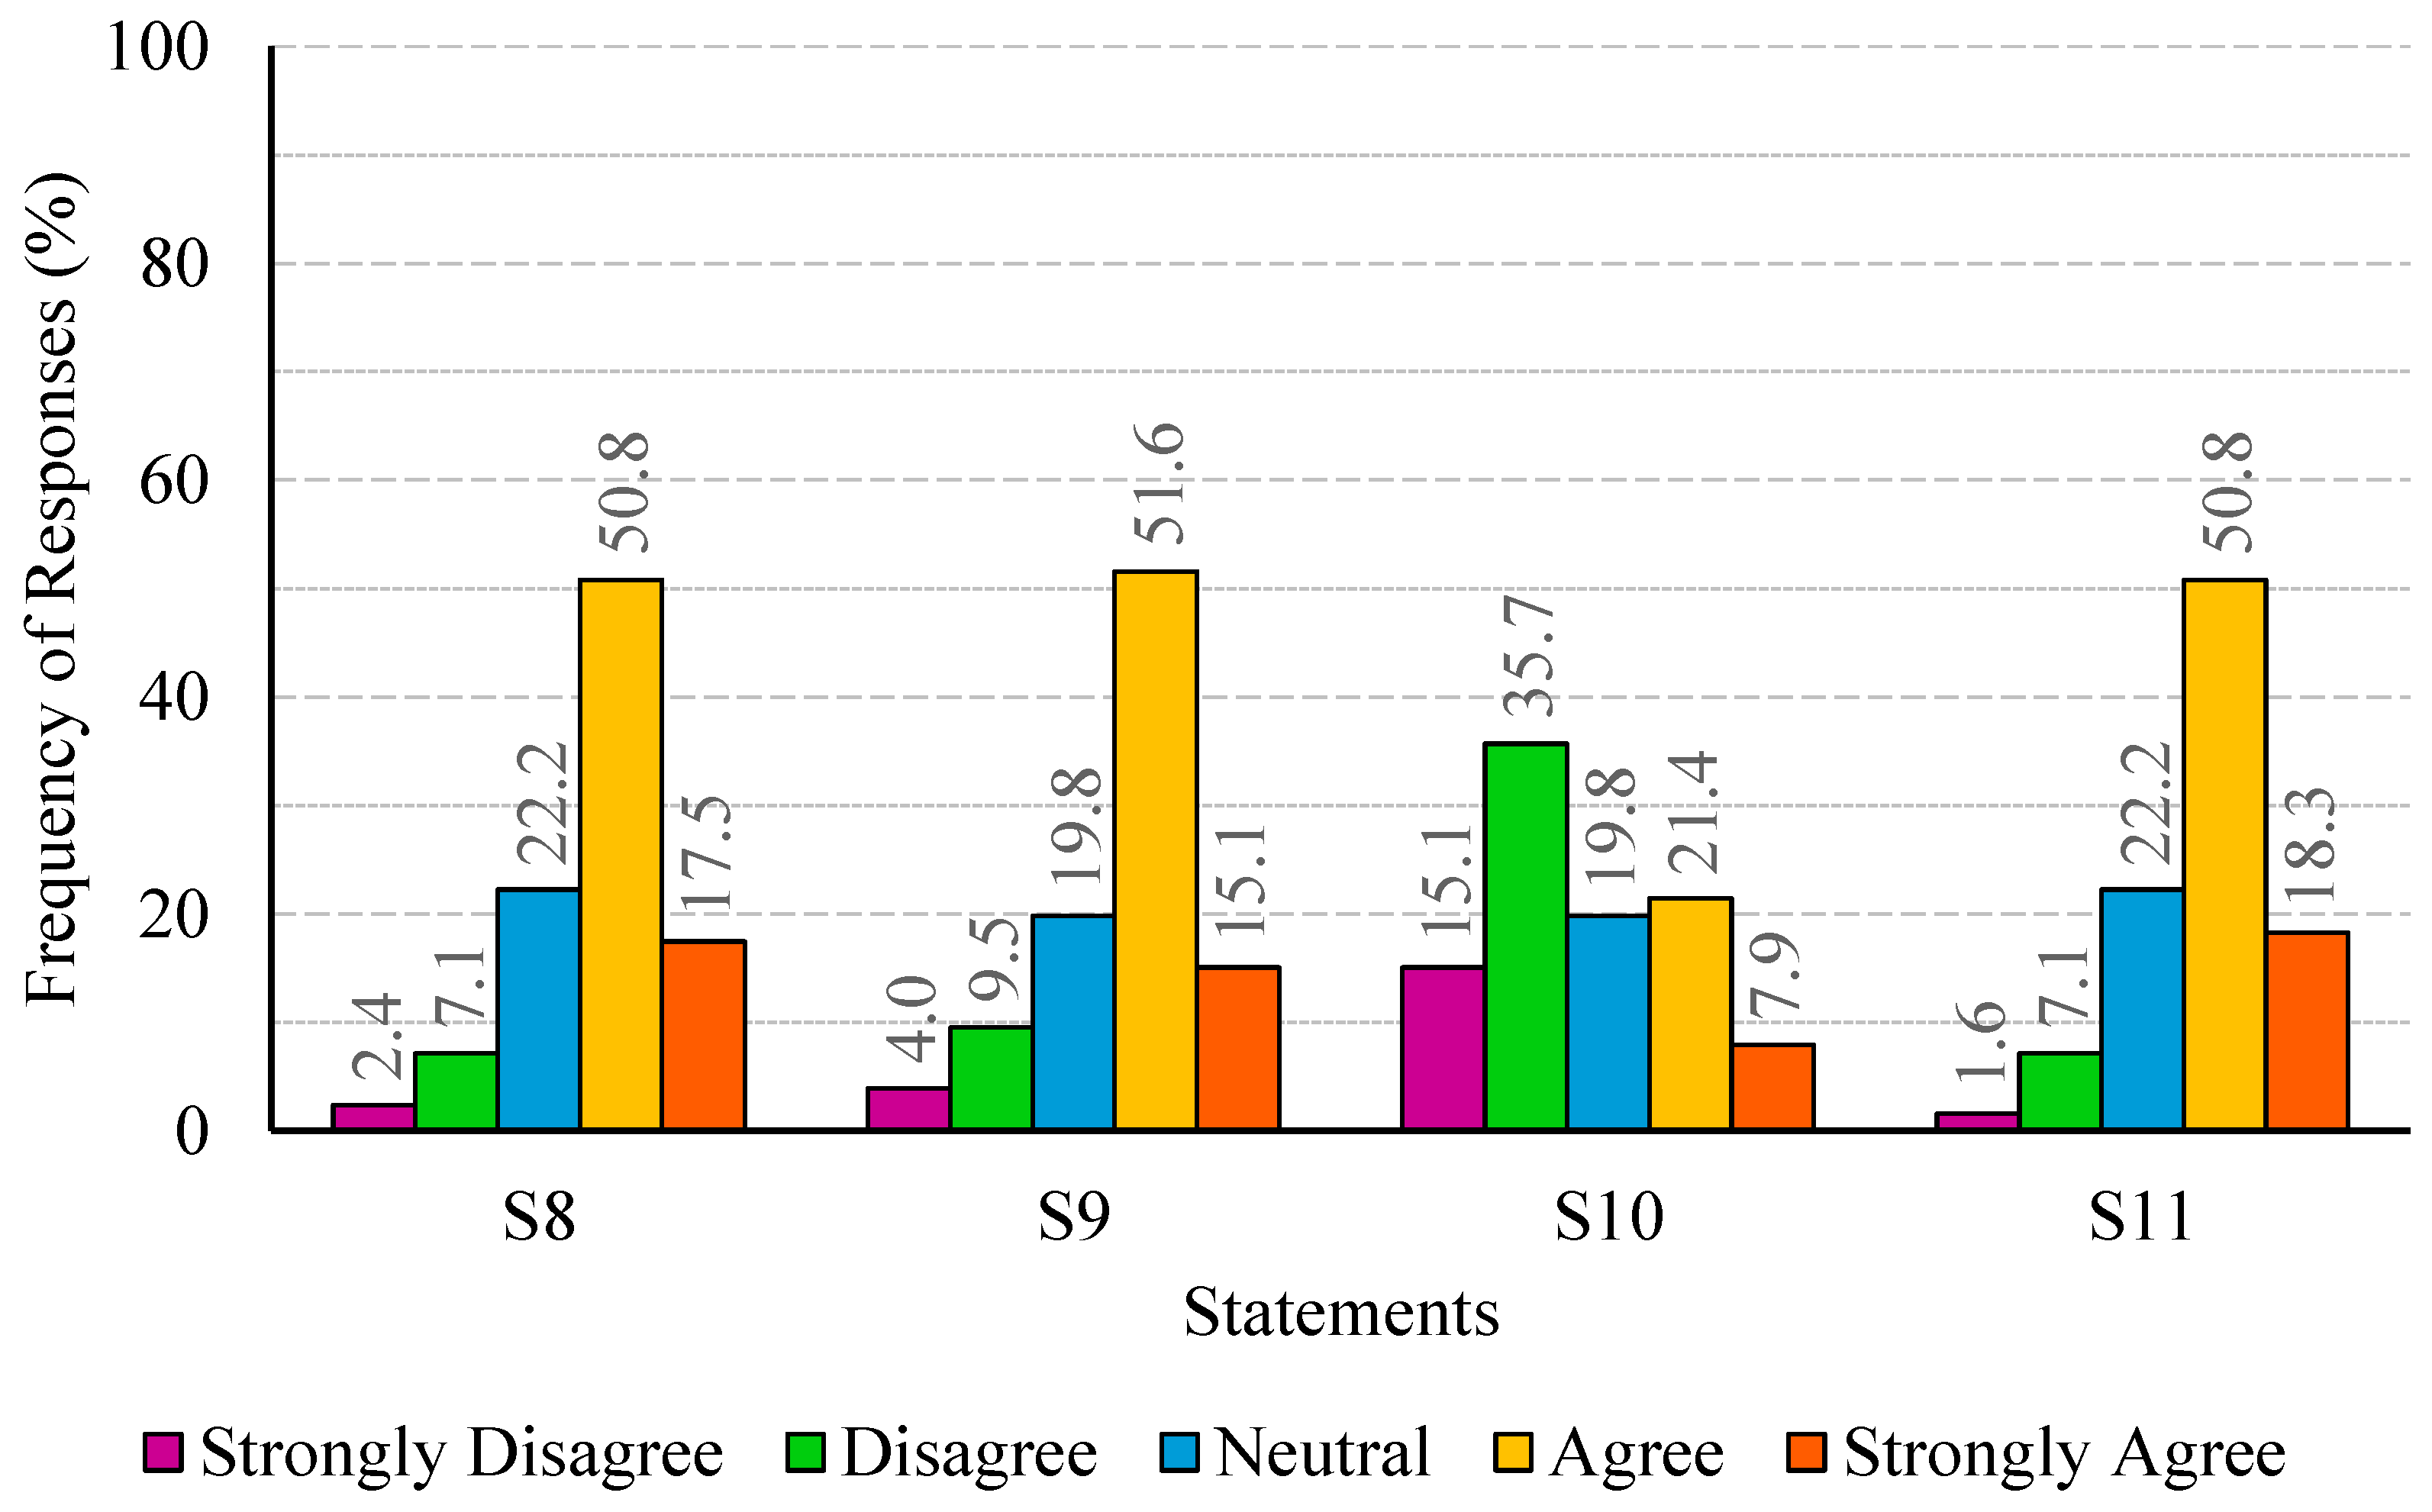
Figure 3.
Percentage distribution of responses regarding time and communication efficiency (statements S8 to S11).
Figure 3.
Percentage distribution of responses regarding time and communication efficiency (statements S8 to S11).
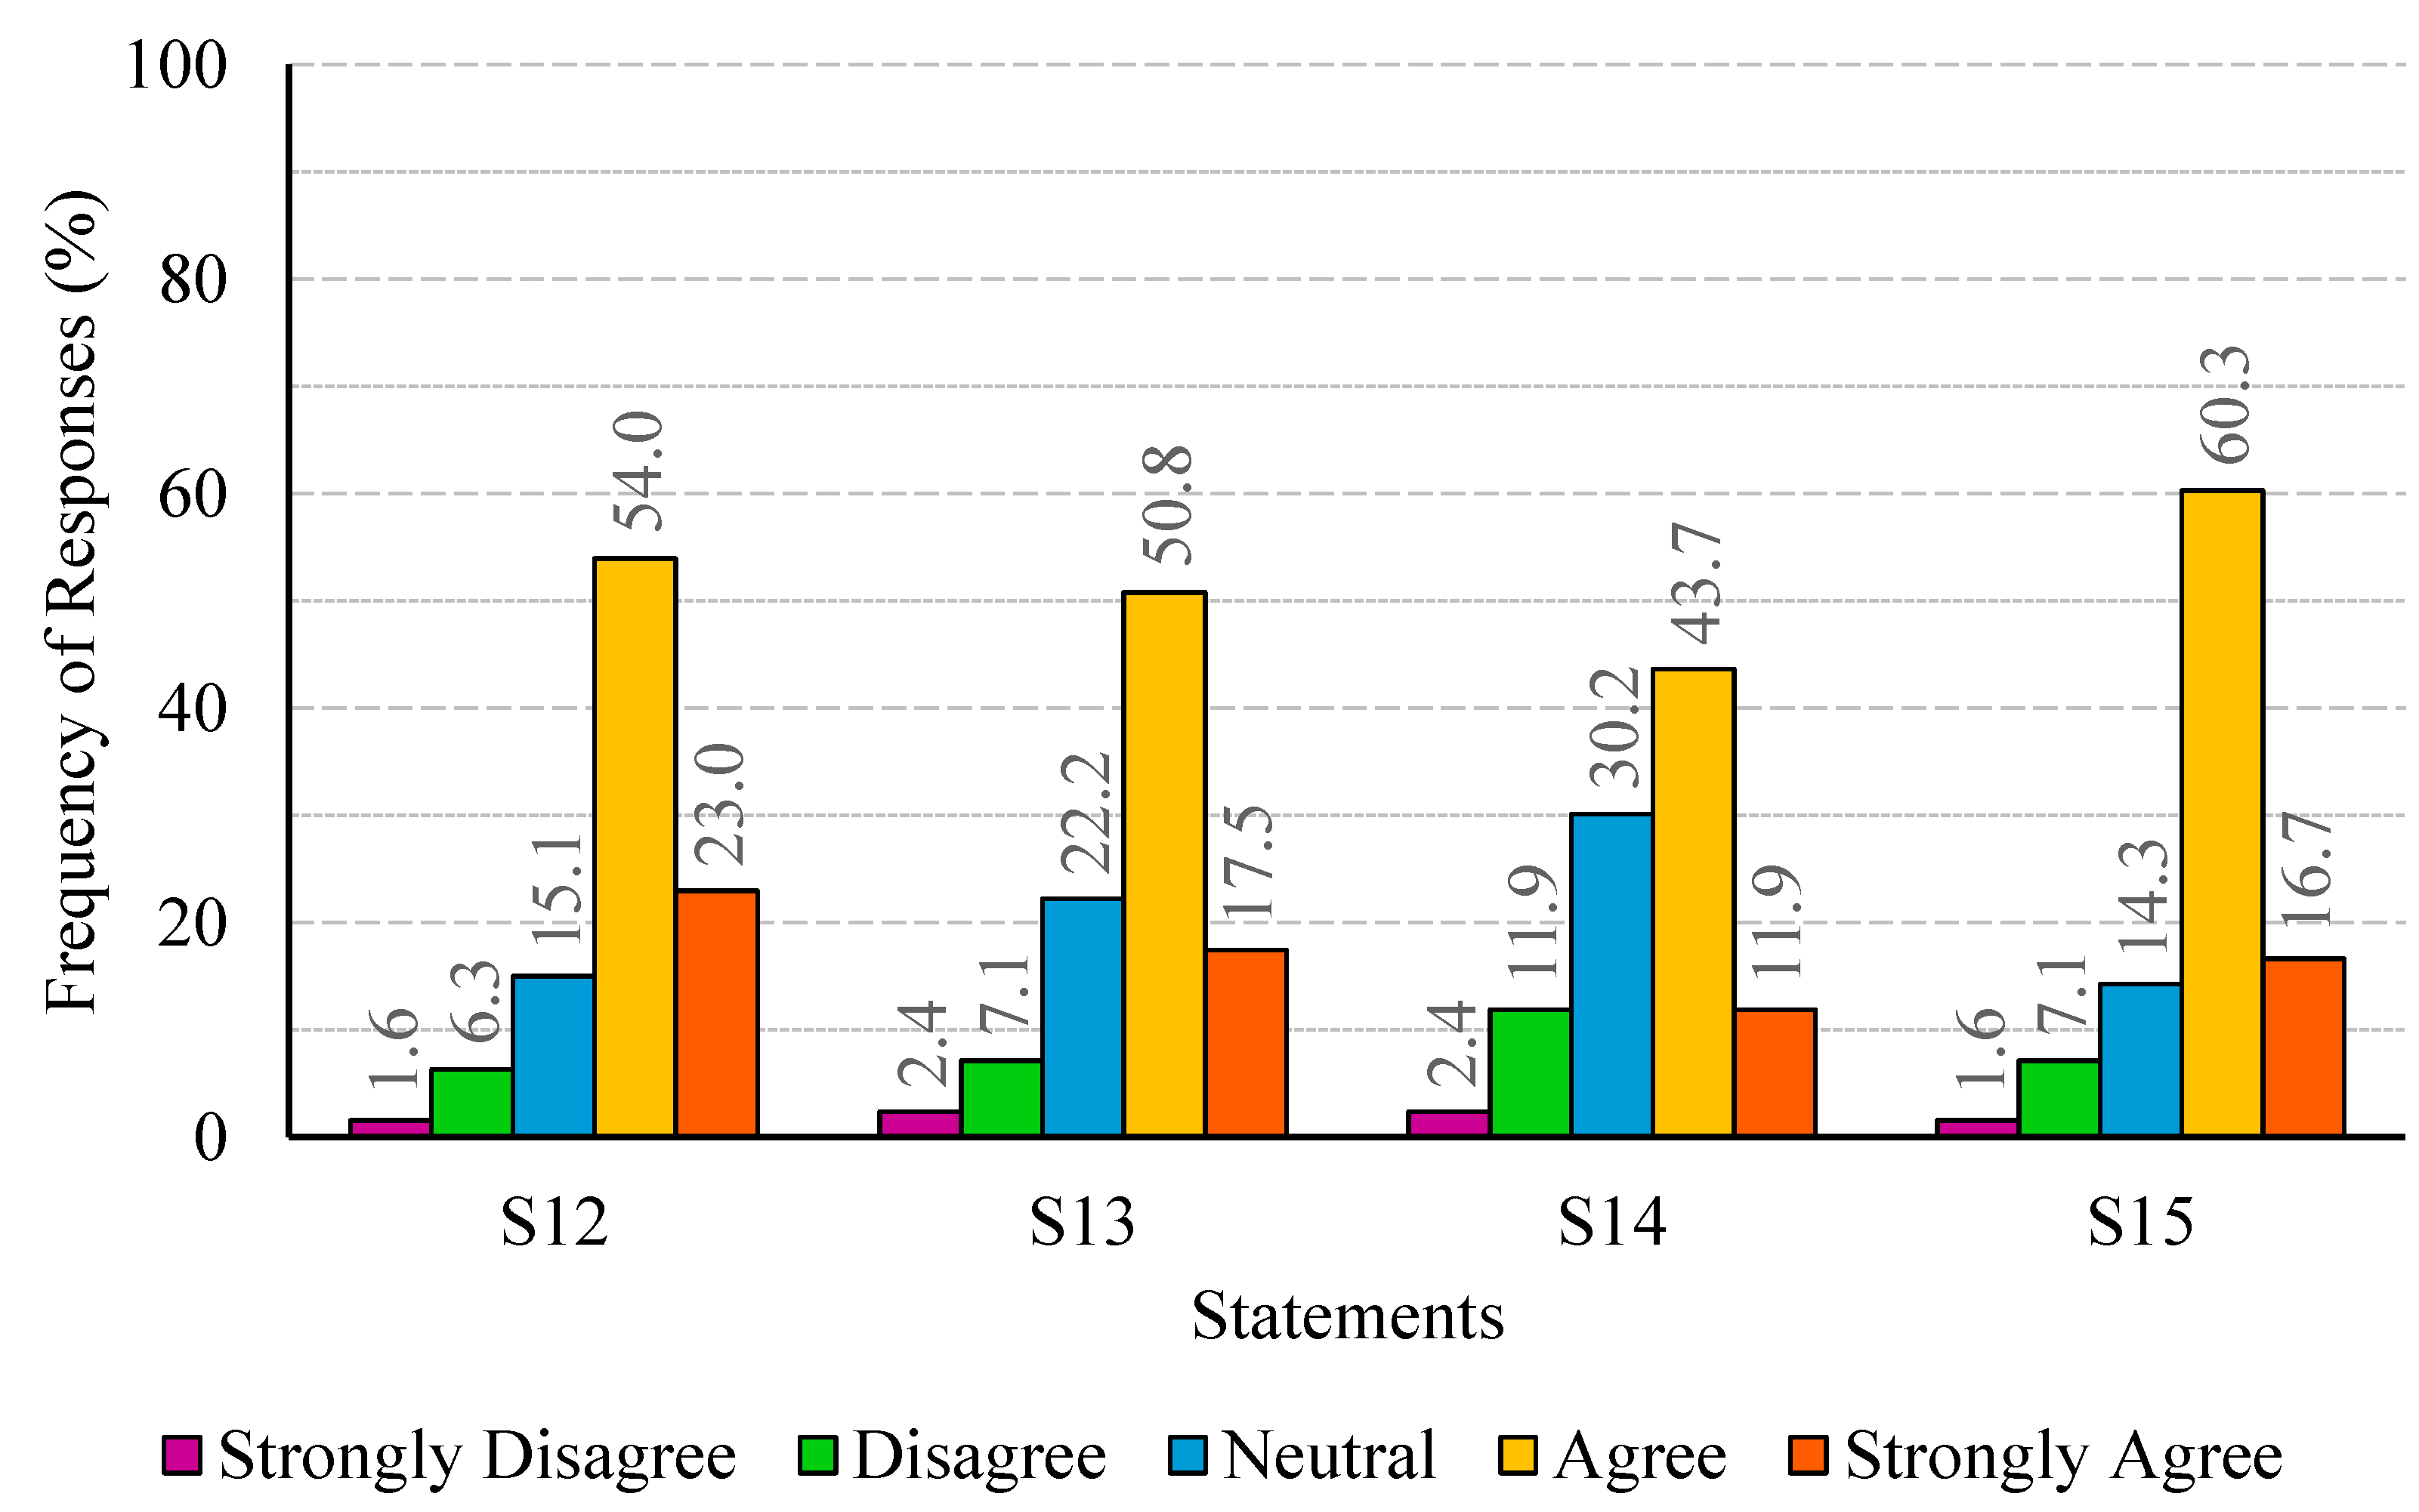
Figure 4.
Percentage distribution of responses regarding patient expectations (statements S12 to S15).
Figure 4.
Percentage distribution of responses regarding patient expectations (statements S12 to S15).
Figure 5.
Participant one’s responses to statements S1 through S15.
Figure 5.
Participant one’s responses to statements S1 through S15.
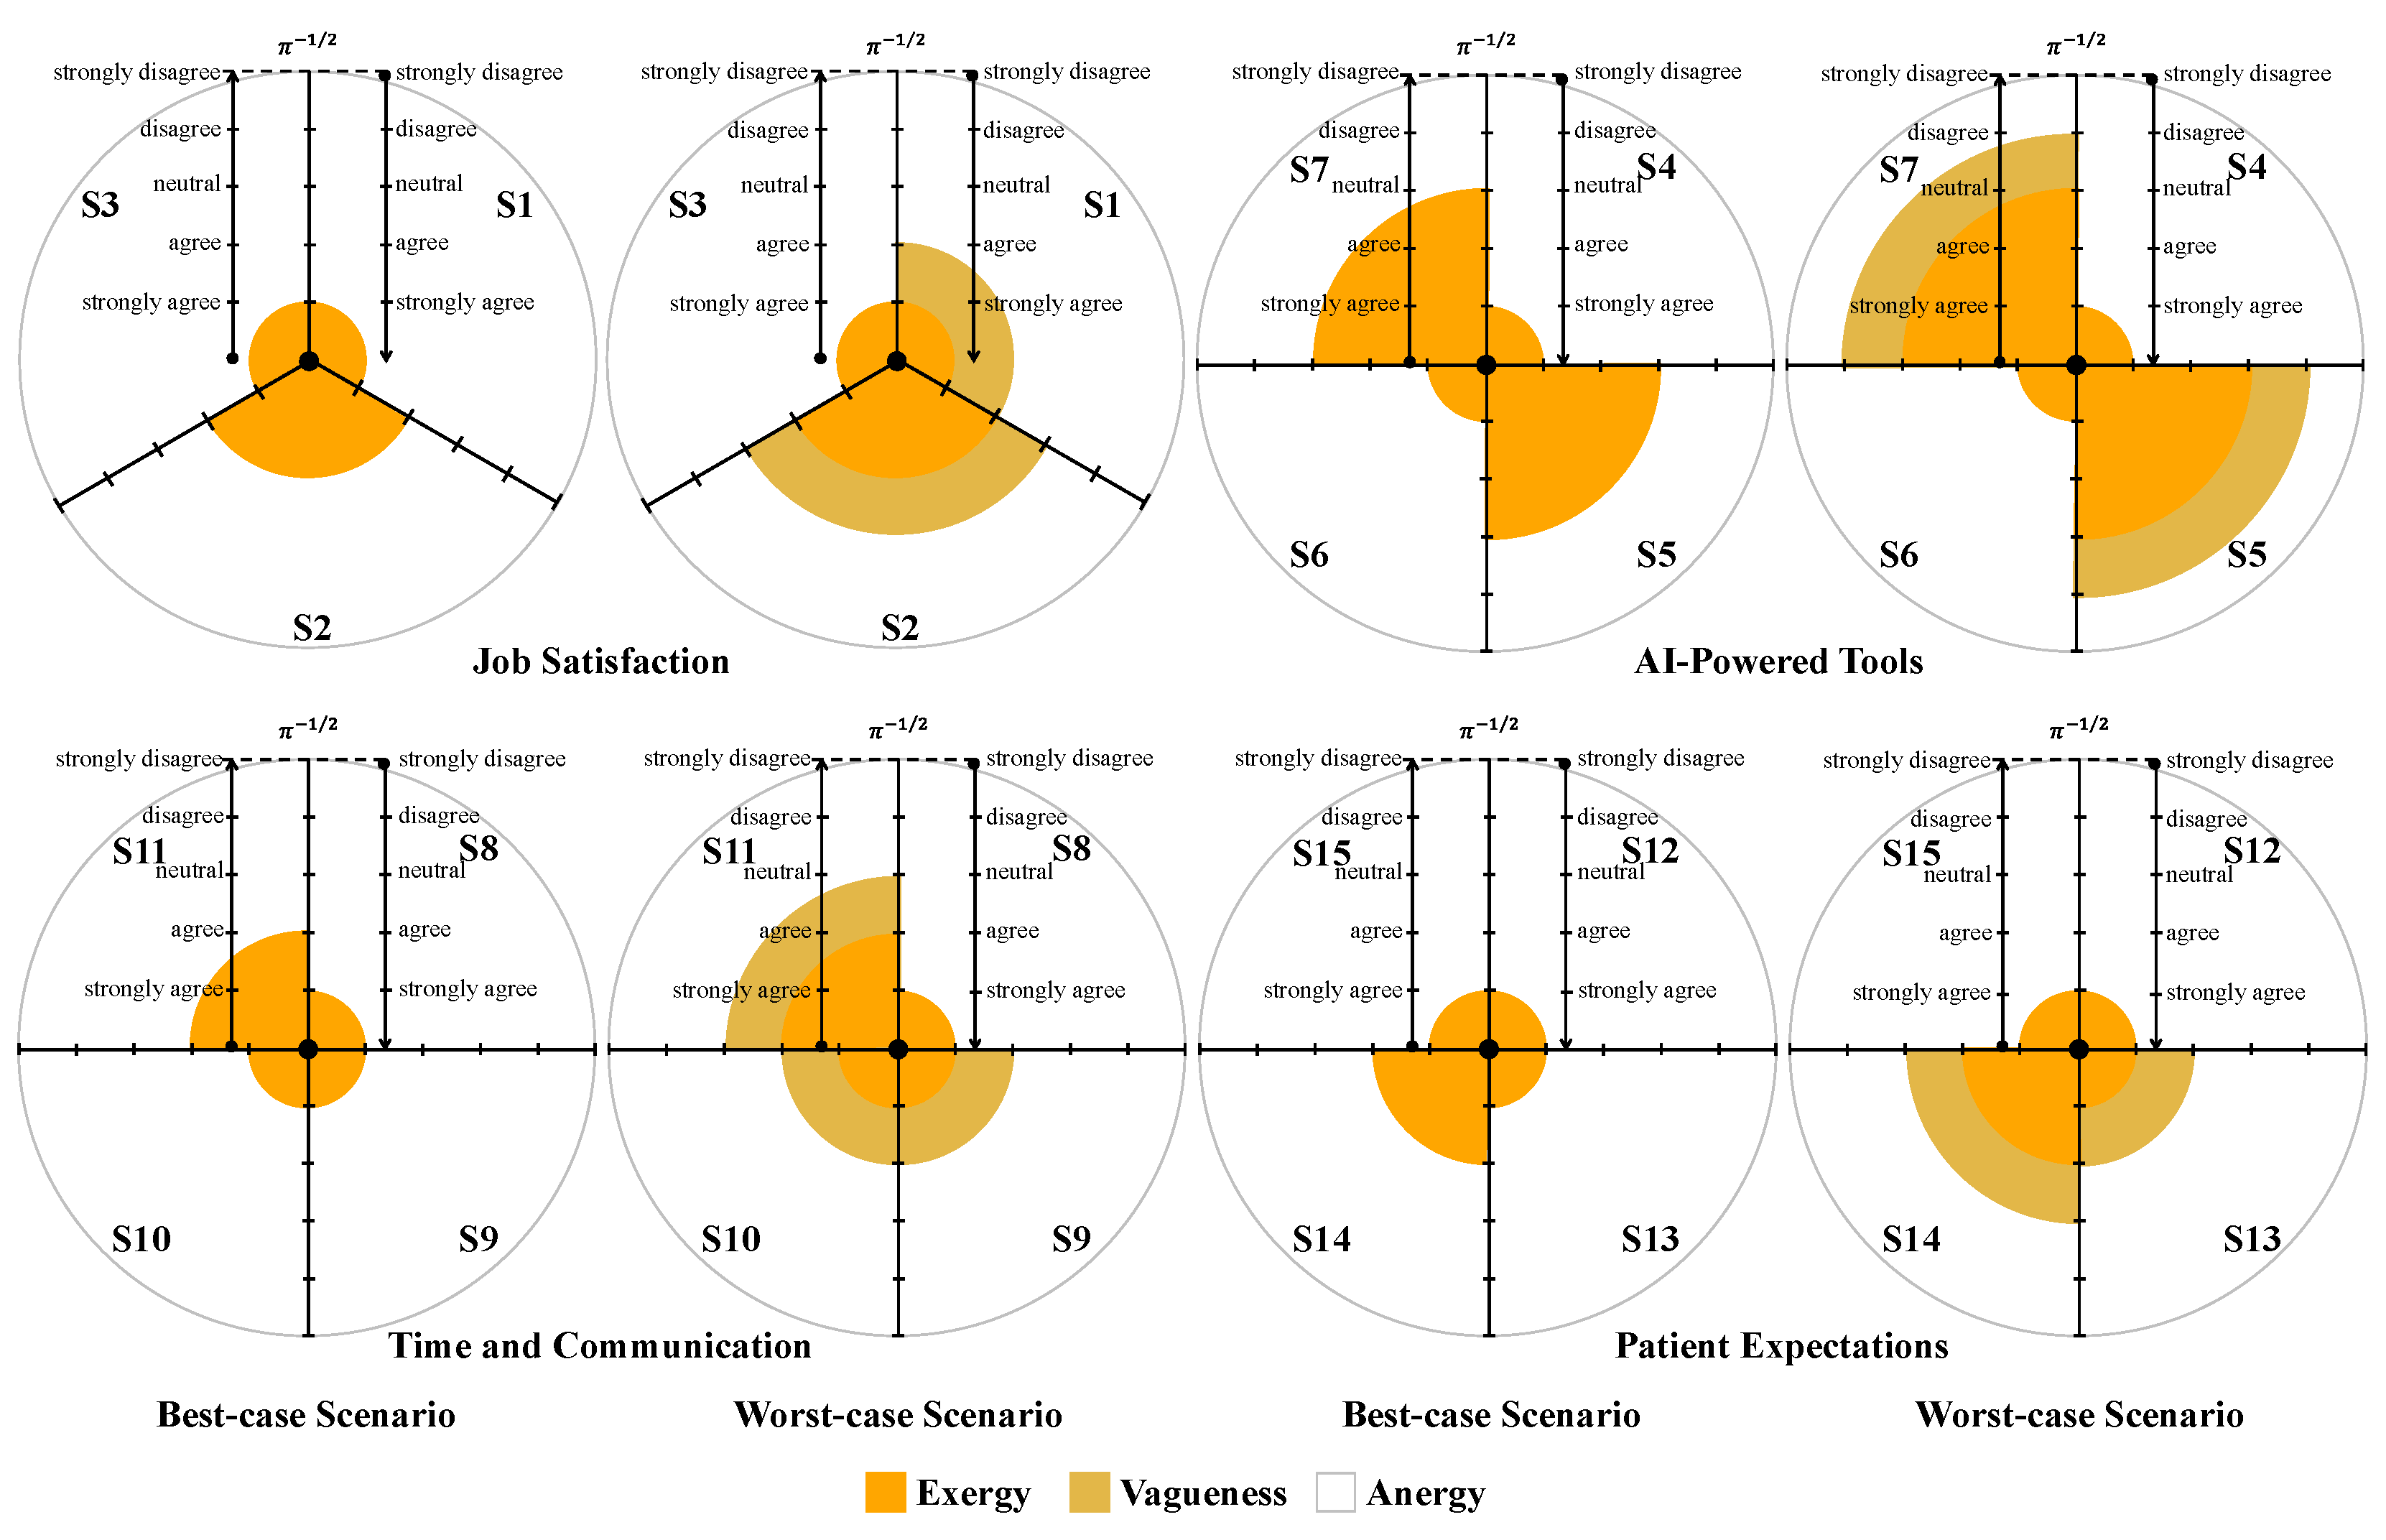
Figure 6.
Graphical representation of participant one’s responses to statements S1 through S15, segmented by the key areas of the study (job satisfaction, AI-powered tools, time and communication, and patient expectations) in the best-case and worst-case scenarios. The orange, mustard yellow, and white colored areas correspond to exergy, vagueness, and anergy, respectively.
Figure 7.
Participant one’s responses to the third subdivision of the questionnaire.
Figure 7.
Participant one’s responses to the third subdivision of the questionnaire.
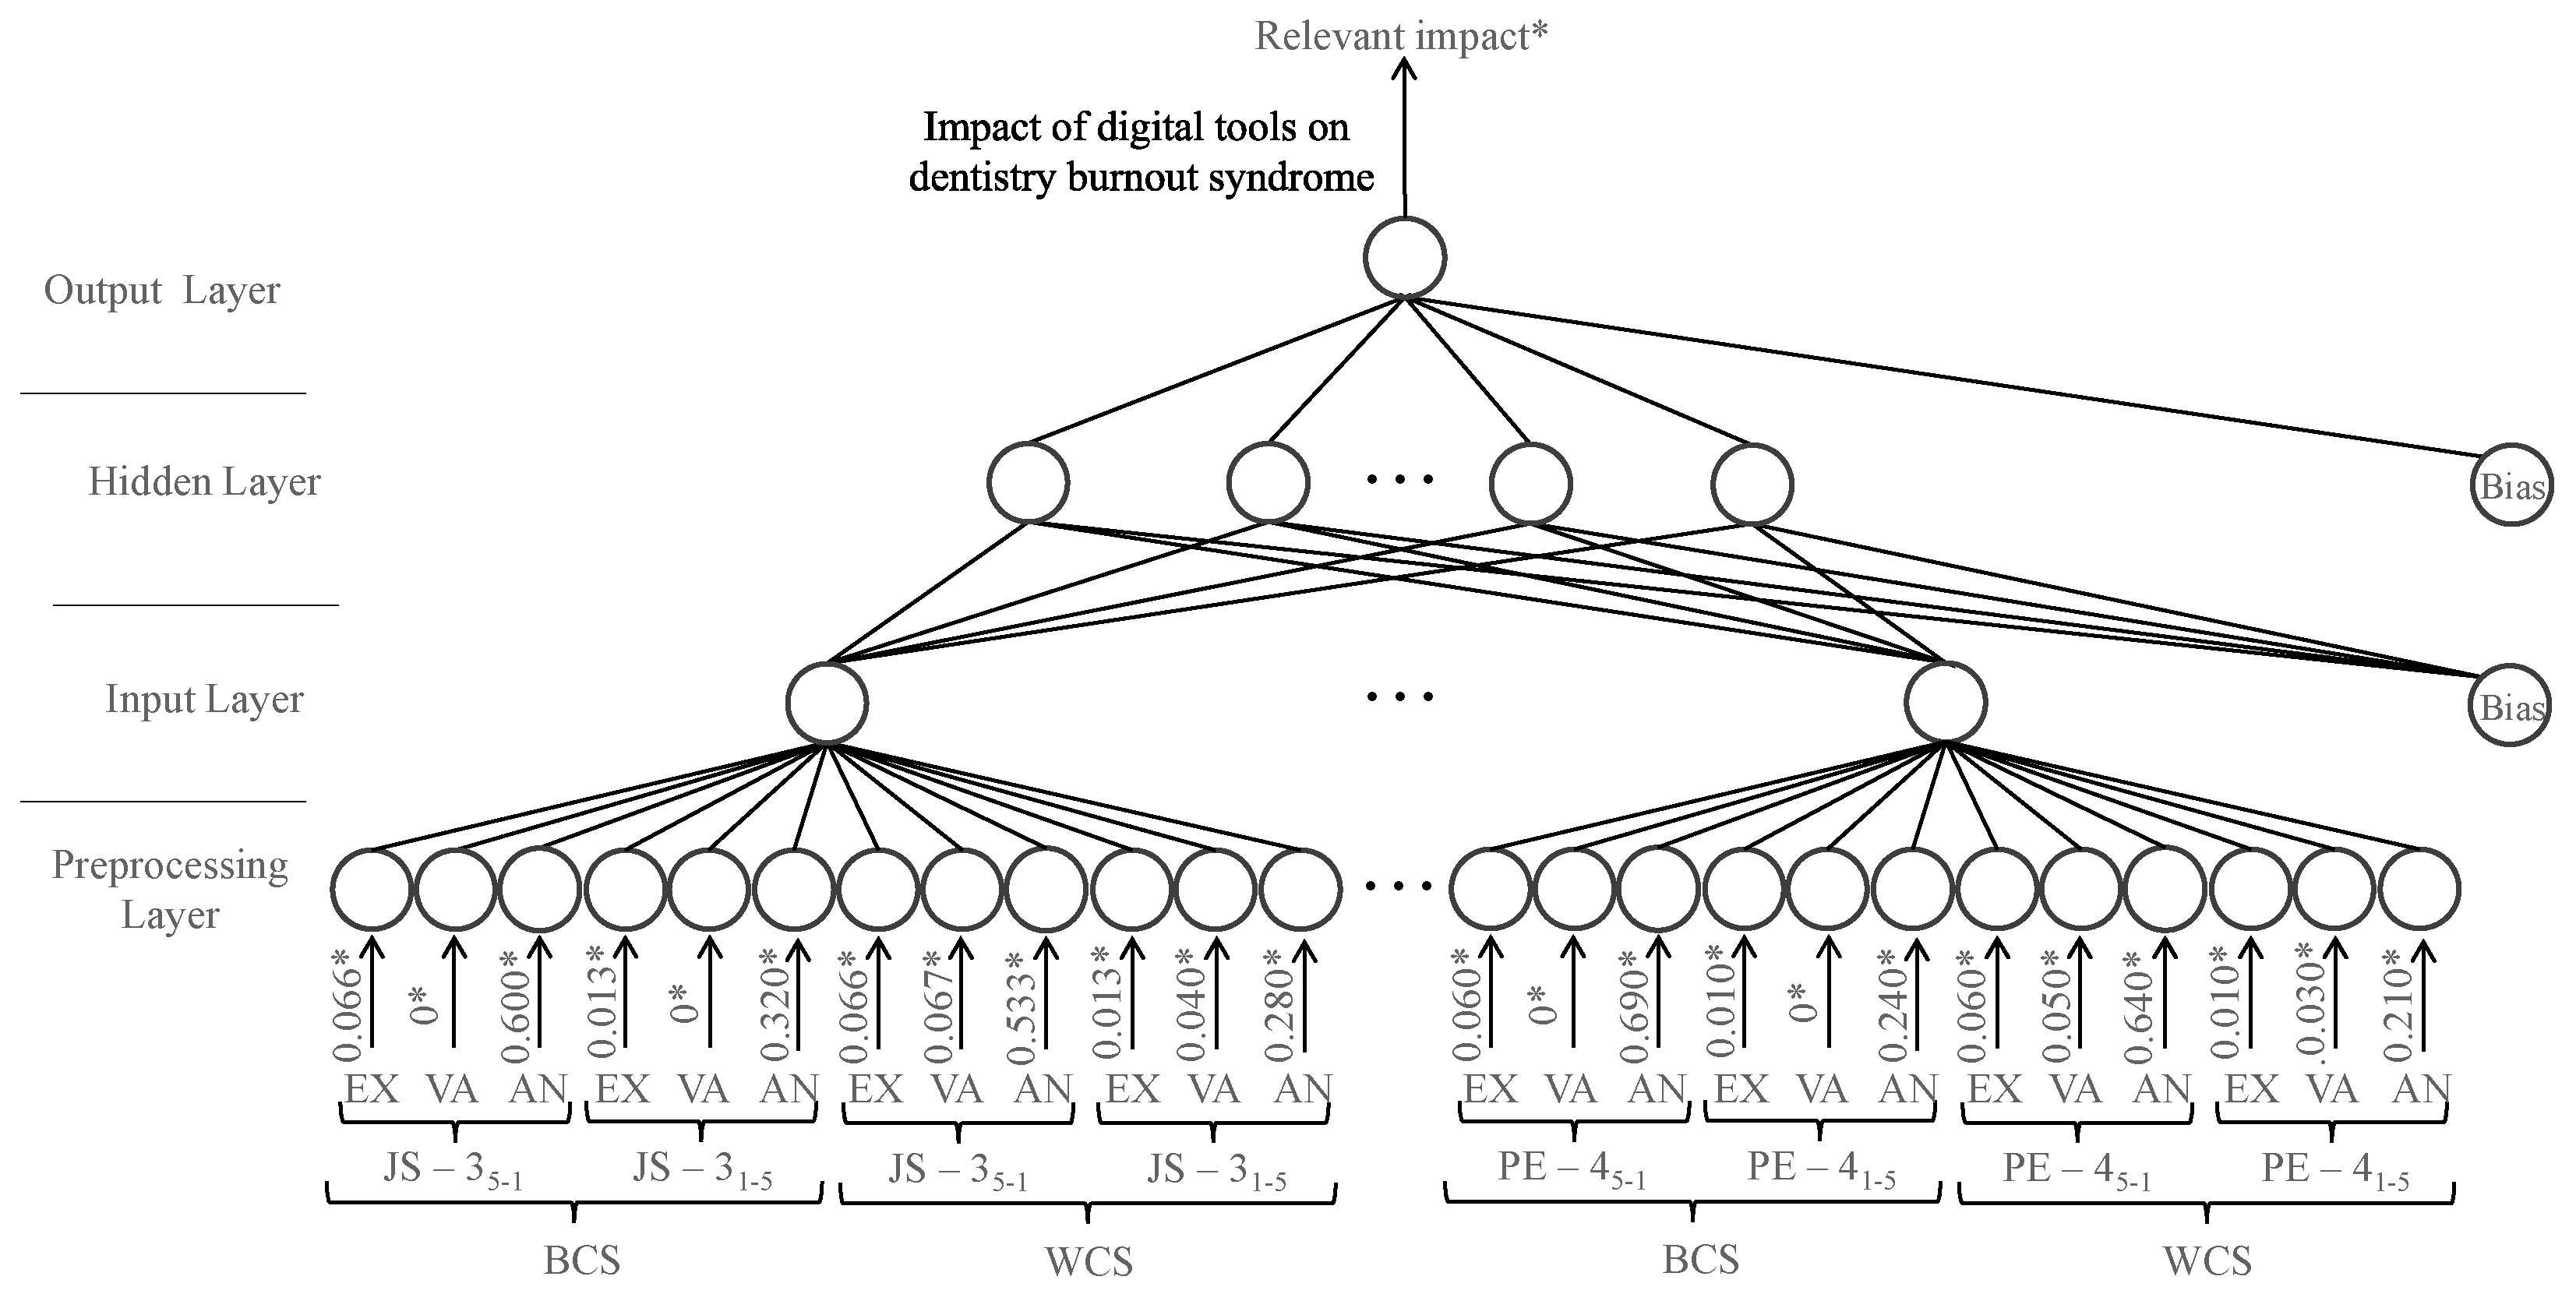
Figure 8.
A visual representation of the neural network model developed to predict the impact of digital tools on dentistry burnout syndrome, with inputs consisting of exergy (EX), vagueness (VA), and anergy (AN) values from each key area of the study (job satisfaction—3 sentences (JS—3), artificial intelligence-powered tools—4 sentences (AIPT—4), time and communication—4 sentences (TC—4), and patient expectations—4 sentences (PE—4)). The inputs are evaluated in both the best-case scenario (BCS) and worst-case scenario (WCS), and on both scales, from strongly agree (5) to strongly disagree (1), and vice versa. (* The information presented pertains to participant one and is used for demonstration purposes.)
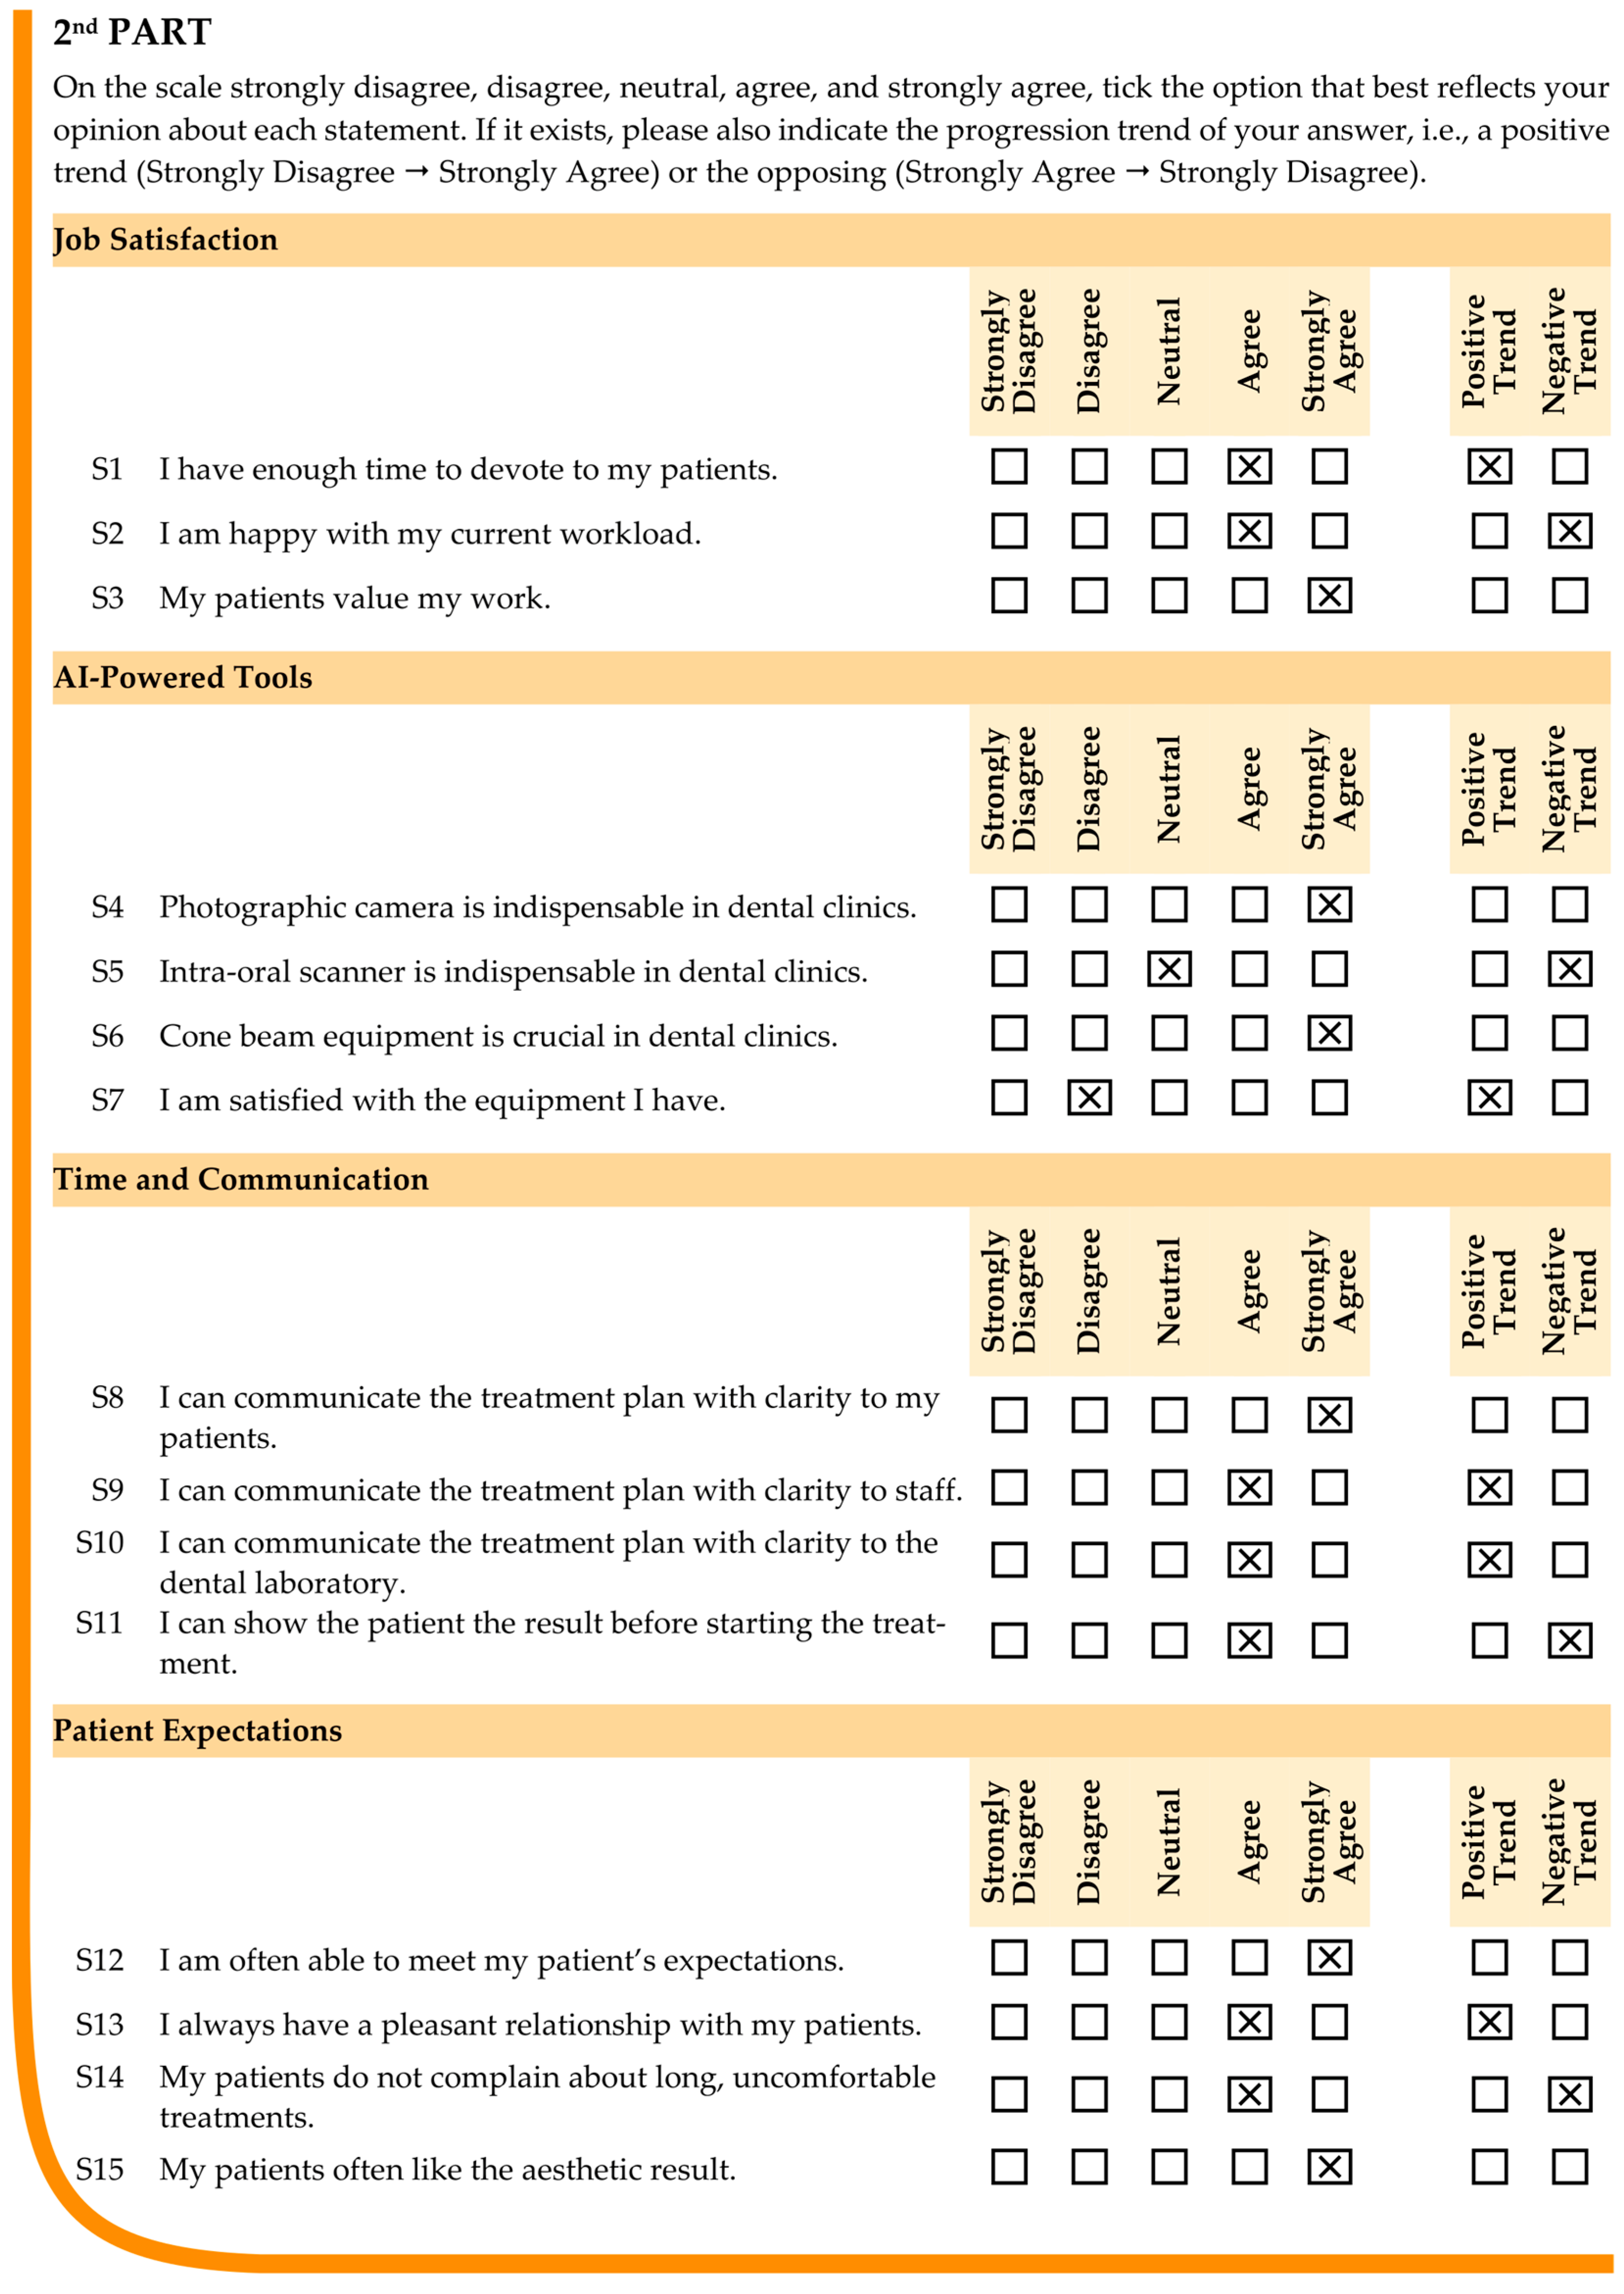
Table 1.
Sections and statements featured in the second subdivision of the questionnaire.
Table 1.
Sections and statements featured in the second subdivision of the questionnaire.
| Job Satisfaction (JS—3) | S1 | I have enough time to devote to my patients. |
| S2 | I am happy with my current workload. |
| S3 | My patients value my work. |
| AI-Powered Tools (AIPT—4) | S4 | Photographic camera is indispensable in dental clinics. |
| S5 | Intraoral scanner is indispensable in dental clinics. |
| S6 | Cone beam equipment is crucial in dental clinics. |
| S7 | I am satisfied with the equipment I have. |
| Time and Communication (TC—4) | S8 | I can communicate the treatment plan with clarity to my patients. |
| S9 | I can communicate the treatment plan with clarity to staff. |
| S10 | I can communicate the treatment plan with clarity to the dental laboratory. |
| S11 | I can show the patient the result before starting the treatment. |
| Patient Expectations (PE—4) | S12 | I am often able to meet my patient’s expectations. |
| S13 | I always have a pleasant relationship with my patients. |
| S14 | My patients do not complain about long, uncomfortable treatments. |
| S15 | My patients often like the aesthetic result. |
Table 2.
Demographic distribution of participants by gender, age group, years of experience, and type of dental practice.
Table 2.
Demographic distribution of participants by gender, age group, years of experience, and type of dental practice.
| Demographic Variable | Category | Frequency |
|---|
| N | % |
|---|
| Gender | Female | 71 | 56.3 |
| Male | 55 | 43.7 |
| Age Group (years old) | 25–35 | 38 | 30.2 |
| 36–45 | 50 | 39.7 |
| 46–55 | 26 | 20.6 |
| 56–65 | 12 | 9.5 |
| Years of Experience | 1–5 years | 28 | 22.2 |
| 6–10 years | 42 | 33.3 |
| 11–15 years | 32 | 25.4 |
| more than 16 years | 24 | 19.1 |
| Type of Dental Practice | General dentistry | 64 | 50.8 |
| Specialized practice | 35 | 27.8 |
| Academic/Research | 12 | 9.5 |
| Other 1 | 15 | 11.9 |
Table 3.
Conversion of participant one’s responses to statements S1 through S15, segmented by the key areas of the study (job satisfaction, AI-powered tools, time and communication, and patient expectations) to a mirrored nine-level Likert scale.
Table 3.
Conversion of participant one’s responses to statements S1 through S15, segmented by the key areas of the study (job satisfaction, AI-powered tools, time and communication, and patient expectations) to a mirrored nine-level Likert scale.
| Key Area | Statements | Mirrored Nine-Level Likert Scale * |
|---|
| Negative Trend | Positive Trend |
|---|
![Eng 06 00047 i001]() | ![Eng 06 00047 i001]() |
|---|
| 5 | 4 | 3 | 2 | 1 | 2 | 3 | 4 | 5 |
|---|
| Job Satisfaction (JS—3) | S1 | | | | | | | | × | × |
| S2 | | × | × | | | | | | |
| S3 | × | | | | | | | | |
| AI-Powered Tools (AIPT—4) | S4 | × | | | | | | | | |
| S5 | | | × | × | | | | | |
| S6 | × | | | | | | | | |
| S7 | | | | | | × | × | | |
| Time and Communication (TC—4) | S8 | × | | | | | | | | |
| S9 | | | | | | | | × | × |
| S10 | | | | | | | | × | × |
| S11 | | × | × | | | | | | |
| Patient Expectations (PE—4) | S12 | × | | | | | | | | |
| S13 | | | | | | | | × | × |
| S14 | | × | × | | | | | | |
| S15 | × | | | | | | | | |
Table 4.
Evaluating exergy, vagueness, and anergy for participant one’s responses to statements S1 through S3 regarding job satisfaction, in the best-case scenario, for both scales, i.e., from strongly agree (5) to strongly disagree (1), and from strongly disagree (1) to strongly agree (5).
Table 4.
Evaluating exergy, vagueness, and anergy for participant one’s responses to statements S1 through S3 regarding job satisfaction, in the best-case scenario, for both scales, i.e., from strongly agree (5) to strongly disagree (1), and from strongly disagree (1) to strongly agree (5).
| Statements | Scale (5) → (1) | Scale (1) → (5) |
|---|
| Job Satisfaction (JS—3) | S1 | | |
| |
|
|
| S2 | | |
| |
| |
| S3 | | |
| |
| |
Table 5.
Evaluating exergy, vagueness, and anergy for participant one’s responses to statements S1 through S3 regarding job satisfaction, in the worst-case scenario, for both scales, i.e., from strongly agree (5) to strongly disagree (1), and from strongly disagree (1) to strongly agree (5).
Table 5.
Evaluating exergy, vagueness, and anergy for participant one’s responses to statements S1 through S3 regarding job satisfaction, in the worst-case scenario, for both scales, i.e., from strongly agree (5) to strongly disagree (1), and from strongly disagree (1) to strongly agree (5).
| Statement | Scale (5) → (1) | Scale (1) → (5) |
|---|
| Job Satisfaction (JS—3) | S1 | | |
|
|
|
|
| S2 | | |
| |
| |
| S3 | | |
| |
| |
Table 6.
Values of exergy (EX), vagueness (VA), and anergy (AN) regarding participant one for all key areas covered in the study (job satisfaction (JS—3), artificial intelligence-powered tools (AIPT—4), time and communication (TC—4), and patient expectations (PE—4)) in the best-case scenario, for both scales, i.e., from strongly agree (5) to strongly disagree (1), and from strongly disagree (1) to strongly agree (5).
| | Scale (5) → (1) | | Scale (1) → (5) |
|---|
| | EX | VA | AN | | EX | VA | AN |
|---|
| JS—35-1 | 0.066 | 0 | 0.600 | JS—31-5 | 0.013 | 0 | 0.320 |
| AIPT—45-1 | 0.110 | 0 | 0.640 | AIPT—41-5 | 0.090 | 0 | 0.160 |
| TC—45-1 | 0.050 | 0 | 0.450 | TC—41-5 | 0.020 | 0 | 0.480 |
| PE—45-1 | 0.060 | 0 | 0.690 | PE—41-5 | 0.010 | 0 | 0.240 |
Table 7.
Values of exergy (EX), vagueness (VA), and anergy (AN) regarding participant one for all key areas covered in the study (job satisfaction (JS—3), artificial intelligence-powered tools (AIPT—4), time and communication (TC—4), and patient expectations (PE—4)) in the worst-case scenario, for both scales, i.e., from strongly agree (5) to strongly disagree (1), and from strongly disagree (1) to strongly agree (5).
| | Scale (5) → (1) | | Scale (1) → (5) |
|---|
| | EX | VA | AN | | EX | VA | AN |
|---|
| JS—35-1 | 0.066 | 0.067 | 0.533 | JS—31-5 | 0.013 | 0.040 | 0.280 |
| AIPT—45-1 | 0.110 | 0.070 | 0.570 | AIPT—41-5 | 0.090 | 0.070 | 0.090 |
| TC—45-1 | 0.050 | 0.050 | 0.400 | TC—41-5 | 0.020 | 0.060 | 0.420 |
| PE—45-1 | 0.060 | 0.050 | 0.640 | PE—41-5 | 0.010 | 0.030 | 0.210 |
Table 8.
Confusion matrix of the ANN model for predicting the impact of digital tools on dentistry burnout syndrome.
Table 8.
Confusion matrix of the ANN model for predicting the impact of digital tools on dentistry burnout syndrome.
| | Predict | Training | Test |
|---|
| Target | | Relevant Impact | Neutral Impact | Irrelevant Impact | Relevant Impact | Neutral Impact | Irrelevant Impact |
|---|
| Relevant Impact | 42 | 3 | 0 | 21 | 1 | 0 |
| Neutral Impact | 2 | 19 | 1 | 2 | 8 | 1 |
| Irrelevant Impact | 0 | 2 | 17 | 0 | 1 | 6 |
Table 9.
Confusion matrix concerning each output class of the ANN model for predicting the impact of digital tools on dentistry burnout syndrome.
Table 9.
Confusion matrix concerning each output class of the ANN model for predicting the impact of digital tools on dentistry burnout syndrome.
| | Predict | Training Set | Test Set |
|---|
| Target | | Relevant Impact | Non-Relevant Impact | Relevant Impact | Non-Relevant Impact |
|---|
| Relevant Impact | 42 | 3 | 21 | 1 |
| Non-Relevant Impact | 2 | 39 | 2 | 16 |
| | Neutral Impact | Non-Neutral Impact | Neutral Impact | Non-Neutral Impact |
| Neutral Impact | 19 | 3 | 8 | 3 |
| Non-Neutral Impact | 5 | 59 | 2 | 27 |
| | Irrelevant Impact | Non-Irrelevant Impact | Irrelevant Impact | Non-Irrelevant Impact |
| Irrelevant Impact | 17 | 2 | 6 | 1 |
| Non-Irrelevant Impact | 1 | 66 | 1 | 32 |
Table 10.
Sensitivity, specificity, positive predictive value (PPV), and negative predictive value (NPV) for each output class of the ANN model for predicting the impact of digital tools on dentistry burnout syndrome.
Table 10.
Sensitivity, specificity, positive predictive value (PPV), and negative predictive value (NPV) for each output class of the ANN model for predicting the impact of digital tools on dentistry burnout syndrome.
| Class | Training Set | Test Set |
|---|
| Sensitivity | Specificity | PPV | NPV | Sensitivity | Specificity | PPV | NPV |
|---|
| Relevant Impact | 0.93 | 0.95 | 0.96 | 0.93 | 0.96 | 0.89 | 0.91 | 0.94 |
| Neutral Impact | 0.86 | 0.92 | 0.79 | 0.95 | 0.73 | 0.93 | 0.80 | 0.90 |
| Irrelevant Impact | 0.90 | 0.99 | 0.94 | 0.97 | 0.86 | 0.97 | 0.86 | 0.97 |


