Abstract
This study presents an intelligent modeling framework for predicting fabric nesting efficiency (NE) based on geometric descriptors of garment patterns, offering a rapid alternative to conventional nesting software. A synthetic dataset of 1000 layouts was generated using a custom Python algorithm that simulates realistic garment-like shapes within a fixed fabric size. Each layout was characterized by five geometric descriptors: number of pieces (NP), average piece area (APA), average aspect ratio (AAR), average compactness (AC), and average convexity (CVX). The relationship between these descriptors and NE was modeled using a Sugeno-type Adaptive Neuro-Fuzzy Inference System (ANFIS). Various membership function (MF) structures were examined, and the configuration 3-3-2-2-2 was identified as optimal, yielding a mean relative error of −0.1%, with high coefficient of determination (R2 > 0.98). The model was validated through comparison between predicted NE values and results obtained from an actual nesting process performed with Deepnest.io, demonstrating strong agreement. The proposed method enables efficient estimation of NE directly from CAD-based parameters, without requiring computationally intensive nesting simulations. This approach provides a valuable decision-support tool for fabric and apparel designers, facilitating rapid assessment of material utilization and supporting design optimization toward reduced fabric waste.
1. Introduction
The fabric and apparel industry represents one of the most material-intensive sectors in modern manufacturing, where efficient utilization of textile materials directly affects both production costs and environmental sustainability. During the garment cutting stage, fabric pieces are arranged and cut from rectangular sheets of material according to the product design. This process, known as marker making or nesting, plays a crucial role in determining the overall material yield. Even small improvements in nesting efficiency can lead to significant reductions in fabric waste, which often accounts for 10–20% of total production costs [1]. Traditional marker-making relies heavily on human expertise or commercial software employing heuristic or optimization algorithms to achieve compact arrangements. However, the increasing demand for customized production, rapid prototyping, and digital manufacturing has highlighted the need for intelligent, data-driven approaches that can estimate or optimize fabric utilization efficiency without relying solely on specialized nesting software.
3D virtual prototyping is a process in which the designer can see the garment in three-dimensional form during the design in real time. In recent decades, the clothing industry has incorporated virtual prototypes into the design and manufacturing process. In this way, the development time is significantly reduced by reducing errors during the initial stages of the design. Also, an evaluation of each garment is carried out in real time [2,3]. Three-dimensional printing in the clothing industry has two main uses. The first use mainly affects the esthetic result of the garment while the second in the practical through prototyping and evaluation. Three-dimensional printing can be used as a method to produce a garment as complex geometries using traditional materials cannot be realized. A garment consists either entirely of a 3D printer or of some specific parts. Tufan Tolmaç and İşmal used a 3D printer with FDM (Fused Deposition Modeling) technology to fabricate flexible surface structures. Specifically, three dissimilar materials were used: PLA (Polylactic Acid), ABS (Acrylonitrile Butadiene Styrene) and TPU (Thermoplastic Urethane). This study concludes that despite some practical difficulties of 3D printing in clothing, there are significant advantages such as personalized design, complex geometries and hybrid fabrics [4,5]. Xiao and Kan analyzed the 3D printing technologies applied to textiles such as 3D printing using fibers, 3D printing with structures that have flexibility and 3D printing by injecting material onto fabric [6,7,8]. A basic limitation of 3D printing is the use of only a single color. The development of technology in recent years has significantly helped to solve this problem with new technologies that allow color 3D printing much easier than in the past [9]. Chan et al. integrated color printing via a PolyJet printer into the manufacture of a garment. Initially, a dress was digitally designed which was then 3D printed with colors. 16 physical prototype samples were needed to select the most suitable one based on color contrast. The final garment took 309 h of printing and weighed an estimated 5.67 kg [10].
After completing the digital design of a garment, the method and position of cutting the pieces of which it is composed must be determined. This process is called in the literature as “Traditional Pattern Making”. In recent years, this process has been gradually automated via computer and is called Digital/Virtual Pattern Making. Now the process takes much less time while at the same time errors are significantly reduced and accuracy is increased. Habib and Alam made a comparison between Virtual Pattern and Traditional Pattern Making through the Clo3DTM software. The automatic nesting process of the pieces aims to minimize waste. The raw material usually has a rectangular shape in which the pieces of the garment are placed through the nesting available in Clo3DTM [11]. The nesting process seeks the optimal placement of the pieces. In the literature, several researchers used Clo3DTM, Gerber AccuMark 3DTM and OptitexTM [12,13,14,15,16,17,18]. Established industrial packages such as Lectra, AccuMark and Optitex, target the full product-development chain by combining parametric 2D pattern drafting, automated grading, marker generation and 3D fit visualization for rapid virtual prototyping. These systems emphasize production-scale features (e.g., multi-layer marker optimization, stripe/plaid matching, and direct export to cutting lines) and are widely adopted by industrial manufacturers. In parallel, newer 3D-oriented tools (e.g., CLO, Browzwear) and open-source alternatives (e.g., Seamly2D) extend pattern editing to immersive 3D simulation or provide low-cost parametric drafting capabilities. Specifically, Lectra is used primarily by large apparel manufacturers. It includes strong 2D to 3D workflows, advanced marker making, production reports and CAD/CAM export options. Similarly, AccuMark is focused on industrial use with a complete range of 3D tools, grading, automated marker generation and multi-layer cutting preparation tools. Optitex is intended for mid-size brands 2D CAD tools, production reports, marker making, true to life 3D prototyping. TUKAcad and APM are affordable solutions for small businesses with marker making, reports generation, auto-pattern generation, and grade automation. CLO and Browzwear are intended for designers and studios, providing 3D garment simulation and virtual sampling with fast iterations, marker export and pattern editing with a focus on 3D fit and visualization. Finally, Seamly2D is a 2D only, open-source, parametric pattern drafting tool with basic marker tools. While these platforms excel at production workflows and visual validation, they typically rely on deterministic geometric/heuristic marker makers or discrete optimization engines and do not generally provide a fast, low-complexity surrogate model that predicts nesting efficiency directly from a small set of geometric descriptors.
It is important to mention that, in nesting, in addition to reducing waste, the time of its execution also plays a significant role. Many researchers are looking for better and more improved nesting processes that require less time. In some cases, criteria are created based on which nesting software and algorithms are evaluated in order to find the best method for each specification [19]. Deep Learning (DL) from Bayesian optimization is also used for detection, classification and placement of pieces for nesting [20,21]. Abdou et al. developed a model for nesting that reduces the calculation time of the process from 30% to 48%. The developed model uses Reinforcement learning (RL) with two Graph Neural Networks (GNNs) to solve nesting [22].
Artificial Intelligence (AI) is redefining the garment design process from the first to the last stage. Data management and analysis as well as the prediction of upcoming trends are coming to radically change the way in which the designer manages the design and esthetic characteristics of the garment [23]. At the same time, models such as ChatGPTTM (Large Language Models) offer useful data to the designer regarding material selection, forecasting needs, data search, etc. [24]. The optimization of garments through specialized algorithms provides better management of the required quantities of raw materials to reduce fabric waste. The algorithms are based on AI tools and can be applied to various stages of the garment design and production process, such as pattern design and the cutting process. The result of this whole process is a more sustainable production (development and manufacturing) of garments [25]. Wang et al. presented an approach to creating custom garments using Machine Learning (ML). Based on a 3D scan of a body, a pattern was automatically created using ML. The main advantage of the process was the reduction in errors during pattern design, resulting in a significant reduction in raw material waste [26]. Liu et al. [27] investigated how garment design can be improved using machine learning models. More specifically, the model accepts pressure data from 20 different points on the body during the use of a garment. The process was performed entirely digitally based on body dimensions. The machine learning model based on the input data produces patterns with a more improved fit to the user’s body [28,29].
Concluding, material utilization is a crucial cost and sustainability factor, largely determined by the efficiency of the nesting process. As already discussed, commercial nesting software can provide highly optimized layouts, but their operation is computationally expensive and often inaccessible to small manufacturers due to increased costs. Moreover, real-time evaluation of a pattern’s layout efficiency during CAD design remains impractical. This study proposes a data-driven approach to estimate nesting efficiency (NE) directly from geometric descriptors of fabric layouts, eliminating the need for repeated nesting simulations. The objective is to develop an adaptive neuro-fuzzy inference system (ANFIS) model that predicts NE from geometric characteristics of CAD layouts (number of pieces, average piece area, average aspect ratio, average compactness, and average convexity). This enables designers to rapidly assess and optimize pattern arrangements at the CAD level, before formal nesting, thereby reducing computation time and improving material yield. Despite the fact that a number of studies [30,31,32] focus on alternative nesting methods and algorithms, a machine learning (ML) system that is based on geometric descriptors for rapid assessment is still understudied. The proposed approach offers a practical pathway toward intelligent, CAD-integrated decision support in garment manufacturing.
2. Materials and Methods
2.1. Framework of This Study, Tools and Methodologies
The proposed method is divided into four major stages, as shown in Figure 1. First, a Python script, based on the Shapely package, was prepared and used to generate five apparel sewing 2D patterns, that are based on realistic measurements found in open databases [33]. The patterns approximate typical patterns of sleeves, cuffs, pockets, bodices and skirts. To define the shapes, several attributes were used such as the area and the perimeter of the piece, the aspect ratio, the compactness and the convexity, an index describing the curvatures of the pieces and a shape category index. Each synthetic layout preserved realistic geometric proportions and area ratios typically observed in garment manufacturing. Only physically meaningful combinations of descriptors were retained, avoiding impossible geometries such as extremely thin, elongated outlines or combinations that violate standard garment-block proportions. Although the model does not perform geometric nesting directly, the training data explicitly account for practical placement constraints used in modern apparel manufacturing such as non-overlapping placement of pattern pieces, rotation restrictions, buffer/margins between pieces (seam allowance, cutter kerf) and fabric roll width limitations. Therefore, descriptor distributions were intentionally bounded to garment-typical ranges. During the second stage, the generated shapes were used to form layouts programmatically, utilizing a bounding box with dimensions 3000 mm width and 5000 mm length. A Python script was used to generate random placements of the shapes inside the bounding box that approximates the fabric. The code ensured that no overlap was allowed, a scale factor was applied to approximate different sizes, and the number of shapes were limited to between 5 and 20. In addition, only 0–180° and 90° orientations were allowed for simplicity. In the third stage, five geometric descriptors were extracted that were then used as inputs for the ANFIS model development. The descriptors [34] are: the number of pieces (NP) that affects the layout complexity, the average piece area in mm2 (APA) describing the material usage, the average aspect ratio (AAR) of the largest to the smallest dimension of the piece’s bounding box indicating the shape’s elongation, the average compactness (AC) that is an index of the shape’s roundness and the average convexity (CVX) that shows the degree of the piece’s indentation. Furthermore, the nesting efficiency (NE) was computed that is the output of the model and the primary metric of this study. Finally, at stage four, the ANFIS model was developed according to the trials that are discussed in Section 3, and a validation process was carried out to determine the performance of the developed prediction model.

Figure 1.
Framework of this study.
Next equations were used to determine the aforementioned descriptors. Specifically, NP is a unitless, integer parameter. It is obvious that more pieces (with smaller average size) can increase placement flexibility but at the same time the computational complexity. The APA reflects the typical size of pieces being nested. Larger areas often reduce achievable nesting efficiency due to less flexibility in packing. Formula (1) is used to calculate the average area, where
is the area (in mm2) of the ith piece.
AAR describes elongation. Values close to 1 represent near-square parts; higher values indicate elongated shapes, which are typically more difficult to nest efficiently. Equation (2) determines the ARR, where
and
are the length and width of the minimum bounding rectangle of the
piece.
AC is a measure of how closely a shape approaches a circle which has compactness = 1, since 0 < AC ≤ 1. Irregular, concave, or elongated shapes have lower compactness. It is described with Equation (3), with Ai being the area and
the perimeter of the
piece.
Finally, CVX indicates how convex the parts are. Perfectly convex shapes have CVX = 1, since 0 < CVX ≤ 1. Shapes with deep concavities demonstrate lower values. In general, lower convexity leads to more difficult nesting due to irregular geometry. Convexity is computed with Equation (4), where
is the area of the convex hull of the
piece.
The output, NE [34], describes the fraction of material that is effectively utilized. It is calculated with Equation (5), where Asheet is the area of the bounding box. It is noted that 0 < NE ≤ 1.
2.2. Generation of the Data Points
Figure 2a illustrates the systematic workflow used to generate the dataset for this study that includes 1000 data points. The algorithm begins with the definition of the fabric dimensions, which establishes the working area for all simulations. Next, pattern shapes resembling garment components are generated and placed within the defined fabric space. The geometric descriptors, including piece count ad area, aspect ratio, compactness, as well as convexity, are then computed for each layout. A layout simulation follows, in which the placement and orientation of shapes are optimized without overlapping. Subsequently, the nesting efficiency is calculated as the ratio of used fabric area to total fabric area, quantifying material utilization. Finally, all descriptor values and output results are compiled and stored in a structured dataset for subsequent ANFIS modeling and validation. Figure 2b describes the CAD-based shape generation of the patterns. First, realistic shapes that represent different types of garments were imported to generic CAD environment. Then a 2D sketch was created by tracing the outline of the pattern. Finally, the minimum number of nodes were imprinted that can accurately describe the nodes of the outline, as well as any curvature that is present on the pattern. By having the complete set of the points, their coordinates were extracted in order to be used in the Python script.
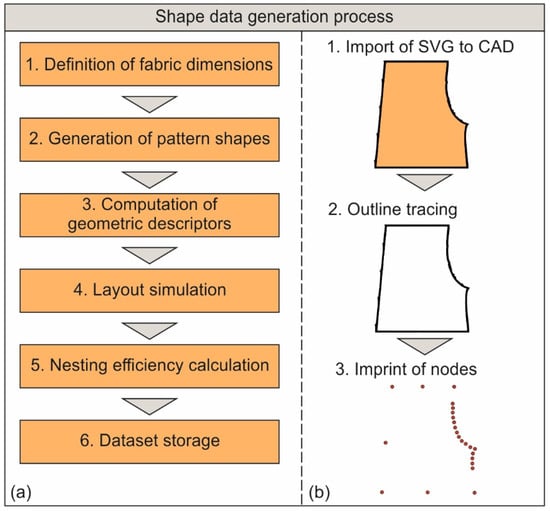
Figure 2.
Flow for the generation of the data synthesis (a) and for the shape tracing (b).
Table 1 includes the most basic functions utilized for the development of the Python script, whereas Table 2 presents the upper and the lower boundaries of the dataset for all inputs and the output.

Table 1.
The basic script functions for the shapes generation.
Table 2.
The boundaries of the inputs and the output of this study.
The normal probability plot of Figure 3 was plotted to determine whether the data follow a normal distribution. By observing the plot, it is evident that the majority of the data are close to the fit line. In addition, their vertical distance is small. A number of outliers are present at the two edges of the fit line, their number however is too low to affect the normality. The two curved lines indicate the confidence bands that were set to 95%. Finalizing, the Anderson-Darling (AD) [35] test was performed to further assess the normality. It can be safely assumed that the data follow a normal distribution, since the p-value was calculated above 0.05 and the AD metric was found to be relatively low.
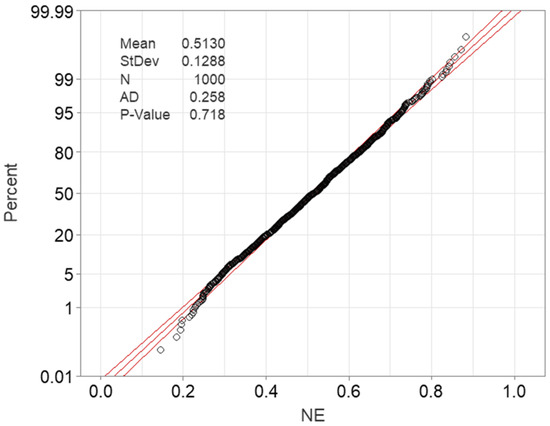
Figure 3.
Normal probability plot for the distribution of data.
To further assess the normality of the data points, the distribution histograms of Figure 4 were plotted. The distribution of the NP (Figure 4a) appears roughly uniform between 6 and 17, suggesting that all pattern counts were represented fairly evenly in the dataset, ensuring a balanced sampling across design complexity levels. The APA descriptor (Figure 4b) is right-skewed, with most values concentrated around 4 × 105 mm2 to 7 × 105 mm2. This indicates that smaller pattern areas were more common, while very large areas were less frequent. The aspect ratio (Figure 4c) follows a near-normal distribution centered around 1.1, implying that most shapes have proportions close to rectangles, with fewer elongated or compact geometries. The compactness values (Figure 4e) are slightly left-skewed, clustering around 0.75. This suggests that most shapes are moderately compact, without extreme irregularities. The convexity distribution (Figure 4e) is tightly concentrated around 0.95, indicating that most shapes are highly convex, with few exhibiting significant concavities. Finally, the NE (Figure 4f) follows an approximately normal distribution centered around 0.5, suggesting a balanced dataset containing both efficient and inefficient nesting configurations, which is beneficial for model generalization. Overall, these distributions confirm that the dataset covers a diverse range of geometric characteristics, with no severe imbalances, which supports the robustness and representativeness of the subsequent ANFIS training. Reported marker efficiencies in the apparel literature and industry practice commonly range between ~50% and ~90%, with many practical cases clustering in the 60–85% interval depending on garment complexity, fabric width and marker strategy. For example, a case study reported an initial marker efficiency of approximately 68.6% [36].
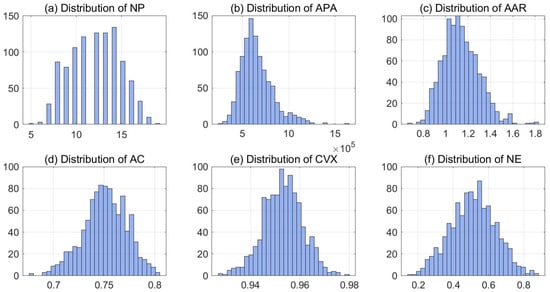
Figure 4.
Histograms of the descriptors and the output’s value distribution.
3. Adaptive Neuro-Fuzzy Modeling
The ANFIS is a hybrid modeling framework that combines the learning capabilities of artificial neural networks with the interpretability of fuzzy logic. By integrating data-driven training with linguistic rule-based reasoning, ANFIS enables the modeling of complex, non-linear relationships between process variables and output responses [37,38,39]. Its structure typically involves fuzzy membership functions (MFs) that define the degree of belonging of each input to fuzzy sets, and a set of if-then rules that link inputs to outputs. The system parameters are optimized through learning algorithms, such as hybrid gradient descent and least-squares estimation, to minimize prediction error. Recent works have extended ANFIS and Takagi–Sugeno (T-S) modeling using interval observers [40] and zonotopic observers [41] for robust estimation in industrial systems, such as wind turbines [42]. In interval and zonotopic ANFIS/T–S approaches, bounded uncertainty is represented by sets of admissible parameter and state values rather than point estimates. Interval observers propagate lower and upper bounds through the fuzzy rules, and the width of these bounds reflects the degree of uncertainty. Zonotopic observers represent uncertainty using centrally symmetric polytopes that efficiently capture model variability. These techniques therefore allow reliable prediction even in the presence of bounded disturbances, sensor noise, and parameter variations. In this work, several ANFIS configurations were developed based on the Sugeno model [43] and tested to identify the most suitable MF structure for the studied process. Specifically, trials were conducted using typical MF types such as the Gaussian and the generalized bell-shaped that are considered more suitable compared to the triangular or trapezoid for datasets with increased number of data points [44]. Additionally, varying numbers of MFs per input were tested in order to determine the configuration that provided the best predictive accuracy and generalization performance. The number of base rules were limited to below 200 for ensuring a smooth training process with respect to the computational resources available. Moreover, the data were divided randomly in two groups: 70% for training and 30% for testing. Finally, the number of epochs was set to 50, while the training process was carried out with the Fuzzy Logic toolbox of MATLAB R2021. This approach is standard in data-driven modeling and machine learning, especially for medium-sized datasets, as it maintains statistical diversity and reduces the likelihood that the model simply memorizes training data. The dependencies between geometric descriptors of layouts and the NE is non-linear and therefore cannot be captured by linear regression [45] or simple parametric models. In addition, unlike a classical Artificial Neural Network (ANN) which behaves like a “black box”, meaning that it is hard to interpret exactly how input features map to output, ANFIS embeds a fuzzy rule-based structure. Each rule corresponds to a fuzzy region which allows interpretability [46], i.e., it is possible to inspect which rules fire, how membership functions behave, and obtain human-interpretable insights that allow the decision-makers to understand why a layout is predicted efficient or not. With interpretability in mind and the fact that interactions in this study are non-linear, classical methods were avoided.
Table 3 presents the combinations that were tested, along with the two metrics: Root Mean Square Error (RMSE) and coefficient of determination R2. The 3-3-2-2-2 structure with the Gaussian function was selected as the most suitable since it demonstrated the lowest RMSE = 0.0112 and the highest R2 = 0.9924. The RMSE and the R2 are essential metrics for evaluating the performance of ANFIS models. RMSE measures the average magnitude of prediction errors, providing a direct indication of how closely the model’s outputs match the experimental data. Lower RMSE values indicate higher accuracy. In contrast, R2 quantifies the proportion of variance in the target variable that is explained by the model, reflecting its ability to capture underlying data trends. Values closer to 1 denote better predictive capability. Together, RMSE and R2 provide a balanced assessment of both accuracy and reliability, enabling the selection of the most suitable ANFIS configuration for the studied process.
Table 3.
The trials for the selection process of the neuro-fuzzy structure.
Figure 5 illustrates the final ANFIS model developed based on the trials and the criteria set. In summary, it contains five inputs, twelve membership functions, 144 fuzzy rules and one output. A sample fuzzy rule for a two input (x), one output (y) system can be expressed with Equation (6). Here, Ai and Bi are fuzzy sets, and pi, qi, and ri are linear consequent parameters.
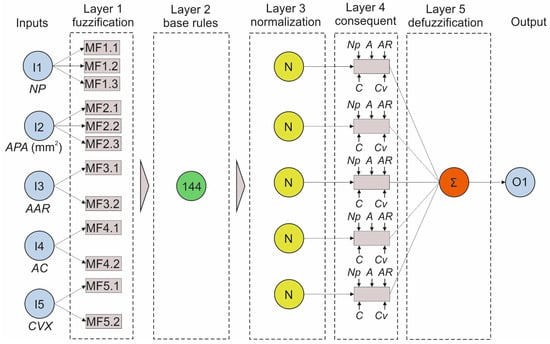
Figure 5.
Selected ANFIS model structure.
At the fuzzification layer, each input is converted into a fuzzy value using a MF. A common choice for similar problems is the Gaussian MF which is represented by Equation (7). Where ci and σi are the center and width of the MF, respectively.
The degree to which each rule is activated, often called firing strength, is computed as the product of the membership values with Equation (8). This represents the logical AND operation between the input fuzzy sets.
At the third layer, normalization of the firing strengths occurs. The normalized firing strength for each rule is obtained with Equation (9). Normalization ensures that the total influence of all rules sums to 1.
Then, each rule generates an output based on its consequent parameters at the fifth layer according to Equation (10).
Finally, the overall ANFIS output is computed as the weighted sum of the rule outputs with Equation (11).
4. Results and Discussion
At first, a correlation heatmap (Figure 6) was plotted to illustrate the relationships between the geometric descriptors and the output. Overall, the correlations are generally weak to moderate, suggesting that no single descriptor fully determines the nesting efficiency, except some noticeable influences. This observation is expected due to the complex nature of the nesting process. Specifically, APA shows the strongest positive correlation with NE (0.58), implying that larger average pattern areas tend to yield higher nesting efficiencies. NP also correlates moderately with NE (0.47), suggesting that the number of parts in the layout somewhat affects material utilization. AAR and AC display very weak correlations with NE (0.10 and −0.13, respectively), indicating limited influence on efficiency. Similarly, CVX has almost no correlation with NE (0.04), meaning shape convexity alone does not significantly affect how efficiently parts are nested. Negative correlations such as between NP and APA (−0.40), as well as between AAR and AC (−0.32) reflect mild inverse relationships among some descriptors, possibly due to geometric constraints (e.g., increasing the number of parts often decreases their average area). In summary, APA and NP are the most relevant predictors for nesting efficiency among the descriptors considered, while AAR, AC, and CVX contribute less directly.
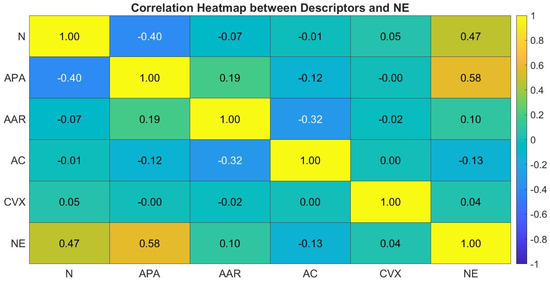
Figure 6.
Heatmap for the correlation between the descriptors and the output.
The observed influence of the five geometric descriptors on NE agrees with established findings in the broader literature on 2D bin packing, irregular strip packing, and geometric optimization. First, aspect ratio has long been recognized as a key factor affecting packing performance. Studies on rectangle and irregular packing [47] show that highly elongated outlines reduce space utilization because they limit feasible orientations and create unusable voids. This is consistent with the negative relationship found in our model. Second, irregularity and shape complexity are known to influence the effectiveness of placement heuristics. Literature on nesting of irregular polygons [48] demonstrates that complex contours increase the computational difficulty of finding tight fits and introduce more unused micro-regions, which aligns with the reduced NE predicted by our ANFIS model as contour complexity increases. Third, fragmentation is directly connected to results in the strip-packing and cutting-stock literature, where increasing the number of items generally decreases overall packing density [49]. The present article aligns with the previous reported findings supporting that higher fragmentation consistently lowers NE. By integrating these descriptors into a unified, data-driven ANFIS model, the present study extends the theoretical insights from geometric optimization literature and demonstrates how specific geometric traits collectively determine the achievable nesting efficiency in garment-oriented layouts.
Continuing, Figure 7 is a key visualization that reveals how each geometric descriptor affects the NE. Regarding the effect of the NP, an inverse relationship is observed. Therefore, as the number of pieces increases, NE tends to decrease. This is expected since more pieces generally lead to higher cutting complexity and more gaps between parts, reducing fabric utilization. A direct relationship appears between NE and APA. Larger average areas result in higher NE values. According to Bennell and Oliveira [34] part geometry (area, bounding box/aspect ratio, concavity/convexity, and related shape measures) and part interactions control achievable packing density and utilization. Larger shapes occupy more of the available space with fewer boundaries and less interstitial waste, improving material efficiency. Following, NE shows moderate sensitivity to AAR. Extremely elongated or irregular shapes (high or low aspect ratios) slightly reduce NE, suggesting that balanced proportions promote better packing. Dickinson and Knopf [50] reported that aspect ratio and higher-order shape descriptors affect achievable packing density. A positive trend is visible between NE and AC. In specific, higher compactness correlates with greater NE. More compact pieces (closer to circular or rectangular) fit together efficiently, minimizing unused regions of fabric. Finally, convexity has a weaker but positive influence on NE. Pieces with smoother and more convex outlines are easier to nest closely, while concave or jagged shapes leave more voids. These results are supported by the general conclusions reported by Abdou et al. [22]. The authors explicit geometric measures of shapes (compatibility, concavity, fit) are predictive of nesting quality and can be used as features for clustering and placement heuristics.
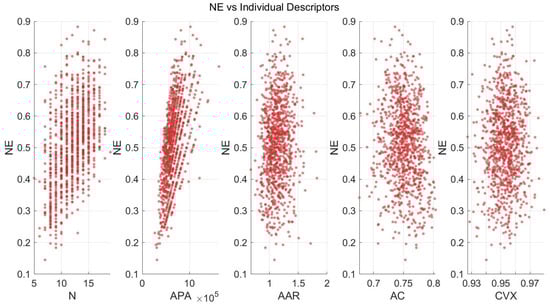
Figure 7.
NE vs. individual descriptors distribution plot.
In summary, the plot visually confirms the descriptors’ influence on NE, helping to interpret the trained ANFIS model’s behavior and ensuring that the relationships make sense both statistically and geometrically. High APA, AC, and CVX, combined with a moderate AAR and fewer pieces, collectively lead to improved nesting efficiency.
To visualize the performance of the model, a comparison diagram was plotted comparing the measured and the predicted values of the NE for the complete dataset. Figure 8 depicts the measured NE values in comparison to the equivalent predicted ones. The maximum relative error was determined to be 10.8%, whereas the minimum was computed equal to −38%. Furthermore, the mean relative values were calculated approximately −0.1%. It was found that the vast majority of the measured and the predicted data points were at almost complete correlation, proving the robustness and the high accuracy of the model. To further support the prediction capability of the model, an error histogram (Figure 9) was generated to illustrate the distribution of the relative error for the complete dataset. By observing the histogram, it is seen that the majority of the relative error values are tightly clustered around the zero-error bin, and a few bins are between −10% and 10%, whereas an insignificant number of relative errors are scattered at the negative side of the histogram, indicating a normal distribution. All these observations lead to the conclusion that the model was sufficiently trained and tested.
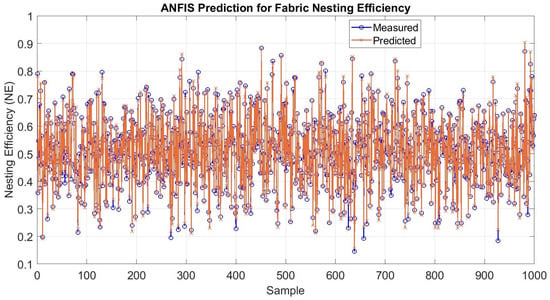
Figure 8.
Comparison between the predicted and the measured NE values.
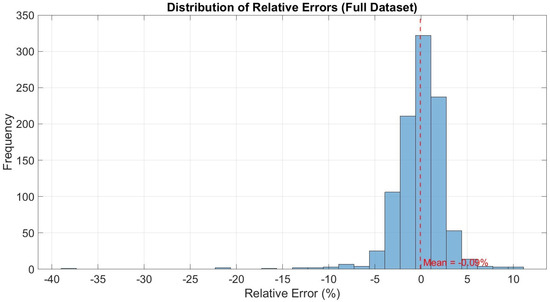
Figure 9.
Error distribution histogram for the predicted vs. measured NE values.
Finalizing, the model’s validity was tested by performing industrial nesting with the open-source software Deepnest.io, at five different layouts. In an analogous manner to the shape generation, five different garment patterns layouts were generated and imported as svg files to the nesting software. The nesting process was carried out with the default settings of the software, and the results were exported to a generic CAD software for extracting the aforementioned geometric descriptors. Figure 10 illustrates the three main steps performed during the validation process, as well as a sample layout as derived from Deepnest.io. In addition, the derived values of the descriptors are included in Table 4 and the comparison results between the predicted and the experimental values of NE, in terms of the relative error.
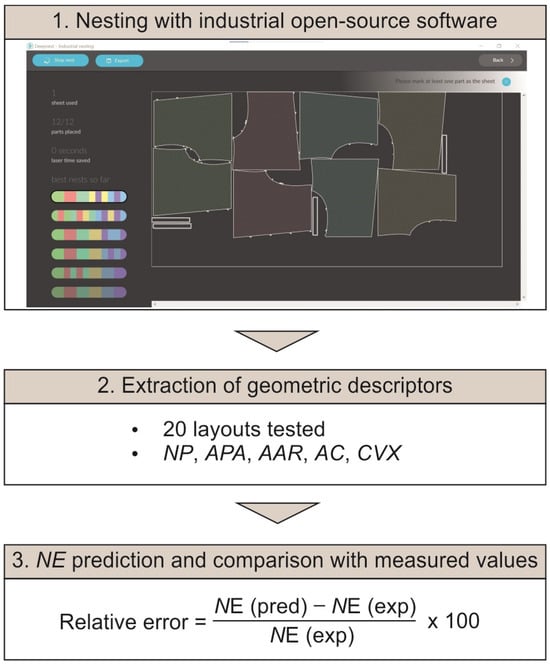
Figure 10.
Validation process workflow.
A local sensitivity analysis [51] was performed to examine how small perturbations in each geometric descriptor influence the predicted NE. For every validation case, each input variable was independently varied by ±5% of its admissible range while the remaining descriptors were held constant. The resulting change in NE was quantified using the central finite difference approximation of the partial derivative. This procedure produced a sensitivity coefficient for each descriptor, enabling the identification of which geometric features exert the strongest influence on the model output. Such analysis is essential not only for interpreting the internal behavior of the ANFIS model but also for diagnosing the sources of error in cases where the prediction deviates significantly from the measured nesting efficiency. The sensitivity profiles helped to reveal whether large validation errors stem from extrapolation beyond the effective domain of the training data. The sensitivity was classified into three classes: low, moderate and high according to the absolute value of the calculated sensitivity (|S|). Low sensitivity corresponds to |S| < 0.5, moderate to 0.5 ≤ |S| < 1.5 and high to |S| ≥ 1.5. The analysis results revealed that most validation cases fall within the low to moderate sensitivity range, indicating stable and predictable model behavior across a substantial portion of the descriptor space. Only two cases exhibit high sensitivity, suggesting that these particular geometries lie near the boundary of the training distribution or correspond to inherently steep regions of the NE response surface. According to Pineda et al. [52] high local sensitivity together with being near the edge of the training distribution signals extrapolation risk while too many low-class sensitivities may indicate an oversmoothed or underfitted surrogate. This is consistent with the validation results, where most predictions achieve errors below 10%, and only one geometry exhibits a larger deviation (−16.9%). Taken together, the distribution of sensitivities and the overall validation accuracy confirm that the ANFIS model generalizes well.
Table 4.
The results of the validation testing.
Table 4.
The results of the validation testing.
| Test | NP | APA (mm2) | AAR | AC | CVX | NEpred | NEexp | Relative Error (%) | Sensitivity Class |
|---|---|---|---|---|---|---|---|---|---|
| 1 | 12 | 628 | 1.52 | 0.78 | 0.93 | 0.49 | 0.59 | −16.9 | High |
| 2 | 10 | 752 | 1.05 | 0.85 | 0.97 | 0.60 | 0.62 | −3.2 | Low |
| 3 | 16 | 1092 | 0.79 | 0.81 | 0.91 | 0.79 | 0.78 | 1.3 | Low |
| 4 | 9 | 420 | 1.12 | 0.92 | 0.90 | 0.57 | 0.53 | 7.5 | Low |
| 5 | 12 | 889 | 1.25 | 0.73 | 0.97 | 0.68 | 0.77 | −11.7 | Moderate |
| 6 | 11 | 400 | 1.34 | 0.71 | 0.94 | 0.33 | 0.37 | −12.2 | Moderate |
| 7 | 16 | 613 | 1.58 | 0.78 | 0.93 | 0.63 | 0.64 | −1.7 | Moderate |
| 8 | 10 | 1000 | 1.40 | 0.70 | 0.96 | 0.65 | 0.67 | −3.0 | Moderate |
| 9 | 14 | 920 | 0.89 | 0.74 | 0.95 | 0.86 | 0.85 | 1.2 | Low |
| 10 | 17 | 710 | 1.82 | 0.72 | 0.94 | 0.79 | 0.80 | −1.3 | Low |
| 11 | 11 | 998 | 0.71 | 0.73 | 0.94 | 0.73 | 0.71 | 2.8 | Moderate |
| 12 | 7 | 1543 | 0.98 | 0.76 | 0.95 | 0.88 | 0.87 | 1.0 | Low |
| 13 | 13 | 610 | 0.84 | 0.77 | 0.94 | 0.52 | 0.55 | −5.5 | Moderate |
| 14 | 11 | 766 | 1.06 | 0.74 | 0.94 | 0.57 | 0.53 | 8.4 | Moderate |
| 15 | 17 | 523 | 1.74 | 0.80 | 0.95 | 0.61 | 0.60 | 1.7 | Moderate |
| 16 | 11 | 1157 | 1.55 | 0.80 | 0.98 | 0.86 | 0.86 | 0.6 | Moderate |
| 17 | 9 | 1266 | 1.20 | 0.76 | 0.95 | 0.86 | 0.87 | −1.1 | Low |
| 18 | 7 | 895 | 1.16 | 0.76 | 0.98 | 0.41 | 0.45 | −8.9 | Moderate |
| 19 | 20 | 413 | 1.37 | 0.71 | 0.96 | 0.52 | 0.59 | −11.9 | High |
| 20 | 10 | 945 | 1.68 | 0.80 | 0.94 | 0.64 | 0.65 | −0.8 | Low |
5. Conclusions
Traditional marker-making without the use of optimization tools relies heavily on manual placement strategies and simple heuristic rules. These approaches are inherently limited in accuracy, consistency, and scalability, and they often fail to capture the complex geometric relationships among pattern pieces that influence fabric utilization. As a result, the attainable nesting efficiency varies significantly with operator expertise and typically leads to suboptimal material use. The ANFIS-based surrogate model developed in this study addresses these limitations by providing a fast, data-driven prediction of nesting efficiency using only geometric descriptors, eliminating the need for full computational nesting at early design stages. This capability allows for rapid evaluation of layout performance and supports more informed decision-making during pattern engineering. The proposed model utilized five geometric descriptors to characterize the spatial distribution and morphological properties of fabric layouts. Namely, the number of pieces, the average piece area, the average aspect ratio, the area compactness and convexity. A dataset comprising 1000 synthetically generated samples was used to train and evaluate the model, ensuring sufficient variability in layout configurations. The data were examined for normality, as well as their distribution was assessed. Multiple membership function structures were systematically examined, and the optimal configuration was determined based on the lowest RMSE and the highest R2. In summary, the following conclusions can be drawn:
- The finalized ANFIS model, structured 3-3-2-2-2, achieved high predictive reliability, with an overall mean relative error of −0.1%, demonstrating excellent agreement between the predicted and observed values.
- The generalization capability of the model was further assessed through validation against twenty real nesting layouts generated using Deepnest.io software. The obtained relative errors ranged from 8.4% to −16.9%, indicating satisfactory predictive consistency and robustness. These findings confirm that the selected geometric descriptors effectively capture the essential characteristics influencing nesting efficiency, while the developed ANFIS framework provides a reliable and computationally efficient tool for assessing and optimizing material utilization in apparel manufacturing.
- Analysis of descriptor influence revealed that NP and APA were the most dominant factors affecting NE, as layouts with a higher number of smaller pieces tended to produce lower efficiency due to increased fragmentation.
- Conversely, AAR values closer to unity, indicating more regular and rectangular shapes, correlated positively with NE.
- AC and CVX presented positive effects as well, as more compact and convex shapes enable tighter packing with fewer voids. These relationships highlight the geometric dependencies that govern material utilization during nesting.
6. Future Work and Limitations
The developed system is based on synthesized data; thus, it did not capture the full complexity of the shapes found in the modern fashion industry. Moreover, the number of descriptors used was limited to the most basic to avoid overfeeding the model and allow a smooth training process. Future work could include data that are derived from sewing patterns used in the modern fashion industry, as well as an increased number of descriptors that can describe the layout nesting performance more accurately. To avoid the high computational cost and increased simulation time, the principal component analysis could be utilized to enable the use of a higher number of descriptors. Beyond expanding the dataset with industrial sewing patterns and enriching the geometric descriptor set, future research could investigate additional methodological advances rather than focusing solely on data accuracy. These include the integration of hybrid modeling frameworks that combine ANFIS with metaheuristic optimization, probabilistic surrogate modeling techniques, and lightweight physics-inspired heuristics to better approximate the behavior of real nesting processes. Another planned direction involves embedding automatic descriptor extraction within CAD environments, enabling seamless processing of pattern outlines directly from industry file formats (e.g., DXF, SVG). Such developments aim to directly overcome the limitations of traditional non-optimized methods by providing accessible, intelligent computational tools that enhance consistency, reduce manual effort, and improve material utilization in modern pattern-making workflows.
Author Contributions
Conceptualization, A.T. and P.K.; Methodology, A.T., P.M., D.N., S.-N.M. and P.K.; Software, A.T. and P.K.; Validation, A.T., P.M., D.N., S.-N.M. and P.K.; Formal analysis, A.T., D.N., S.-N.M. and P.K.; Investigation, A.T., P.M., D.N., S.-N.M. and P.K.; Resources, A.T. and P.K.; Data curation, A.T. and P.M.; Writing – original draft, A.T. and P.K.; Writing – review & editing, A.T., D.N., S.-N.M. and P.K.; Visualization, A.T., P.M., S.-N.M. and P.K.; Supervision, D.N. and P.K. All authors have read and agreed to the published version of the manuscript.
Funding
This research received no external funding.
Data Availability Statement
The raw data supporting the conclusions of this article will be made available by the authors on request.
Conflicts of Interest
The authors declare no conflict of interest.
References
- Vilumsone-Nemes, I.; Pešić, M.; Csanák, E. Flexible Design of Garment Styles to Support the Minimal Waste Concept in the Fashion Industry. FIBRES Text. East. Eur. 2023, 31, 64–73. [Google Scholar] [CrossRef]
- Papachristou, E.; Kalaitzi, D.; Pissas, V. A Methodological Framework for the Integration of 3D Virtual Prototyping into the Design Development of Laser-Cut Garments. J. Eng. Fiber. Fabr. 2023, 18, 15589250231194621. [Google Scholar] [CrossRef]
- Papachristou, E.; Bilalis, N. How to Integrate Recent Development in Technology with Digital Prototype Textile and Apparel Applications. Marmara J. Pure Appl. Sci. 2015, 27, 32–39. [Google Scholar] [CrossRef]
- Tufan Tolmaç, N.; İşmal, Ö.E. A New Era: 3D Printing as an Aesthetic Language and Creative Tool in Fashion and Textile Design. Res. J. Text. Appar. 2023, 28, 656–670. [Google Scholar] [CrossRef]
- Minaoglou, P.; Oancea, G.; Gupta, M.; Kyratsis, P. Use of Computational Design Technology to Automate Sew Pattern. In Digital Product Design and Manufacturing; CRC Press: Boca Raton, FL, USA, 2025; p. 19. [Google Scholar]
- Xiao, Y.; Kan, C. Review on Development and Application of 3D-Printing. Coatings 2022, 12, 267. [Google Scholar] [CrossRef]
- Li, S. Development and Application of Fused Deposition Molding 3D Printing Technology in Textile and Fashion Design. J. Eng. Fiber. Fabr. 2024, 19, 15589250241266977. [Google Scholar] [CrossRef]
- Jeong, J.; Park, H.; Lee, Y.; Kang, J.; Chun, J. Developing Parametric Design Fashion Products Using 3D Printing Technology. Fash. Text. 2021, 8, 22. [Google Scholar] [CrossRef]
- Thi Hai, V.N.; Phu, S.N.; Essomba, T.; Lai, J.-Y. Development of a Multicolor 3D Printer Using a Novel Filament Shifting Mechanism. Inventions 2022, 7, 34. [Google Scholar] [CrossRef]
- Chan, I.; Au, J.; Ho, C.; Lam, J. Creation of 3D Printed Fashion Prototype with Multi-Coloured Texture: A Practice-Based Approach. Int. J. Fash. Des. Technol. Educ. 2021, 14, 78–90. [Google Scholar] [CrossRef]
- Habib, A.; Alam, S. A Comparative Study of 3D Virtual Pattern and Traditional Pattern Making. J. Text. Sci. Technol. 2024, 10, 1–24. [Google Scholar] [CrossRef]
- Marin, I.-E.; Bocancea, V.; Loghin, M.C. Developing a Zero-Waste Pattern Drafting Method Suitable for Mass Production. Ind. Textila 2024, 75, 171–176. [Google Scholar] [CrossRef]
- Wang, S.; Zhang, Z.; Yang, C.; Wang, S.; Zhang, Z.; Yang, C. 3D Digital Clothing Design of Chu-Style Lacquerware Patterns Based on Style3D Technology. Text. Leather Rev. 2025, 8, 539–568. [Google Scholar] [CrossRef]
- Mostafa, S.; Mohamed, A. The Benefits of Using 3D CAD Software to Modify Clothing Virtual Prototype. Int. Des. J. 2025, 15, 415–426. [Google Scholar]
- Zhang, R.; Mueller, S.; Bernstein, G.; Schulz, A.; Leake, M. WasteBanned: Supporting Zero Waste Fashion Design with Linked Edits. In Proceedings of the 37th Annual ACM Symposium on User Interface Software and Technology, San Francisco, CA, USA, 29 October–1 November 2024; pp. 1–13. [Google Scholar]
- Buso, A.; Mcquillan, H. A Design Space for Animated Textile-Forms through Shuttle Weaving: A Case of 3D Woven Trousers. In Proceedings of the 2025 ACM Designing Interactive Systems Conference, Funchal, Portugal, 5–9 July 2025; pp. 2465–2484. [Google Scholar]
- Montusiewicz, J.; Miłosz, M.; Kęsik, J.; Żyła, K. Structured—Light 3D Scanning of Exhibited Historical Clothing—A First—Ever Methodical Trial and Its Results. Herit. Sci. 2021, 9, 74. [Google Scholar] [CrossRef]
- Papachristou, E.; Kyratsis, P.; Bilalis, N. A Comparative Study of Open-Source and Licensed CAD Software to Support Garment. Machines 2019, 7, 30. [Google Scholar] [CrossRef]
- Brad, R. A New Reality: Smart Fabrics and Wearable Technology. Ann. Univ. Oradea. Fascicle Text. Leatherwork 2022, 23, 5–22. [Google Scholar]
- Salama, W.M.; Aly, M.H.; Abed, A.M.; Eladly, A.M. Efficiency Marker Evaluation Based on Optimized Deep Learning Supported by Bayesian Optimization Technique. Text. Res. J. 2023, 93, 4273–4289. [Google Scholar] [CrossRef]
- Eladly, A.M.; Abed, A.M.; Aly, M.H.; Salama, W.M. Results in Engineering Enhancing Circular Economy via Detecting and Recycling 2D Nested Sheet Waste Using Bayesian Optimization Technique Based-Smart Digital Twin. Results Eng. 2023, 20, 101544. [Google Scholar] [CrossRef]
- Abdou, K.; Mohammed, O.; Eskandar, G.; Ibrahim, A.; Huber, M.F.; Matt, P. Smart Nesting: Estimating Geometrical Compatibility in the Nesting Problem Using Graph Neural Networks. J. Intell. Manuf. 2024, 35, 2811–2827. [Google Scholar] [CrossRef]
- Kuzmichev, V. Clothing Design in the Era of Artificial Intelligence. J. Comput. Commun. 2025, 13, 121–136. [Google Scholar] [CrossRef]
- Lamia, N.J.; Mim, S.A. Transforming Fashion with AI: A Comparative Study of Large Language Models in Apparel Design. In Proceedings of the 3rd International Conference on Textile Science and Engineering, Dhaka, Bangladesh, 24 May 2025; p. 10. [Google Scholar]
- Sagar, A.V. Studying the Role of Ai-Driven Algorithms in Assisting the Creation of Sustainable Fashion by Optimizing Material Usage and Reducing Waste in The Design and Production Process. J. Text. Eng. Fash. Technol. 2023, 5, 16–24. [Google Scholar]
- Wang, Z.; Tao, X.; Zeng, X.; Xing, Y.; Xu, Z.; Bruniaux, P. A Machine Learning-Enhanced 3D Reverse Design Approach to Personalized Garments in Pursuit of Sustainability. Sustainability 2023, 15, 6235. [Google Scholar] [CrossRef]
- Liu, K.; Zeng, X.; Bruniaux, P.; Tao, X.; Kamalha, E.; Wang, J. Garment Fit Evaluation Using Machine Learning Technology [M]//Artificial Intelligence for Fashion Industry in the Big Data Era; Springer Singapore: Singapore, 2018; pp. 273–288. [Google Scholar] [CrossRef]
- Thomassey, S.; Zeng, X. Artificial Intelligence for Fashion Industry in the Big Data Era; Springer: Berlin/Heidelberg, Germany, 2018; ISBN 9789811300790. [Google Scholar]
- Chiurco, A.; Augusta, V.D.; La Rosa, A.; Nicoletti, L.; Solina, V. Literature Overview on AI-Based Garment Sizing Systems under a Sustainable Perspective. In Proceedings of the 35th European Modeling & Simulation Symposium, Athens, Greece, 18–20 September 2023; p. 7. [Google Scholar]
- Solis, M.; Tonini, D.; Scheutz, C.; Napolano, L. Contribution of Waste Management to a Sustainable Textile Sector. Waste Manag. 2024, 189, 389–400. [Google Scholar] [CrossRef]
- Duta, E.; Jimeno-morenilla, A. An Approach to Apply the Jaya Optimization Algorithm to the Nesting of Irregular Patterns. J. Comput. Des. Eng. 2024, 11, 112–121. [Google Scholar] [CrossRef]
- Lallier, C.; Blin, G.; Pinaud, B.; Vézard, L. Graph Neural Network Comparison for 2D Nesting Efficiency Estimation. J. Intell. Manuf. 2024, 35, 859–873. [Google Scholar] [CrossRef]
- Korosteleva, M.; Lee, S.-H. Dataset of 3D Garments with Sewing Patterns. Available online: https://zenodo.org/records/5267549 (accessed on 1 November 2025).
- Bennell, J.A.; Oliveira, J.F. The Geometry of Nesting Problems: A Tutorial. Eur. J. Oper. Res. 2008, 184, 397–415. [Google Scholar] [CrossRef]
- Berlinger, M.; Kolling, S.; Schneider, J. A Generalized Anderson—Darling Test for the Goodness-of-Fit Evaluation of the Fracture Strain Distribution of Acrylic Glass. Glas. Struct. Eng. 2021, 6, 195–208. [Google Scholar] [CrossRef]
- Enes, E.; Kipöz, Ş. The Role of Fabric Usage for Minimization of Cut-and-Sew Waste within the Apparel Production Line: Case of a Summer Dress. J. Clean. Prod. 2020, 248, 119221. [Google Scholar] [CrossRef]
- Marani, M.; Songmene, V.; Zeinali, M.; Kouam, J.; Zedan, Y. Neuro-Fuzzy Predictive Model for Surface Roughness and Cutting Force of Machined Al–20 Mg2Si–2Cu Metal Matrix Composite Using Additives. Neural Comput. Appl. 2020, 32, 8115–8126. [Google Scholar] [CrossRef]
- Tzotzis, A.; Nedelcu, D.; Mazurchevici, S.; Kyratsis, P. Investigating the Machining Behavior of the Additively Manufactured Polymer-Based Composite Using Adaptive Neuro-Fuzzy Learning. Appl. Sci. 2025, 15, 5373. [Google Scholar] [CrossRef]
- Luis-Pérez, C.J.; Buj-Corral, I. Multi-Objective Optimization of Surface Roughness, Dimensional Errors and Density in FFF 3D-Printed Glass Fiber-Reinforced PP Parts via Adaptive Neuro-Fuzzy Inference Modeling. Rapid Prototyp. J. 2025, 31, 1905–1932. [Google Scholar] [CrossRef]
- Li, Y.; Yuan, M.; Chadli, M.; Wang, Z.-P.; Zhao, D. Unknown Input Functional Observer Design for Discrete-Time Interval Type-2 Takagi–Sugeno Fuzzy Systems. IEEE Trans. Fuzzy Syst. 2022, 30, 4690–4701. [Google Scholar] [CrossRef]
- Li, Y.; Dong, J. Fault Detection for Discrete-Time Interval Type-2 Takagi–Sugeno Fuzzy Systems Using H_/L∞ Unknown Input Observer and Zonotopic Analysis. IEEE Trans. Fuzzy Syst. 2024, 32, 846–858. [Google Scholar] [CrossRef]
- Pérez-pérez, E.; Puig, V.; López-estrada, F. Robust Fault Diagnosis of Wind Turbines Based on MANFIS and Zonotopic Observers. Expert Syst. Appl. 2024, 235, 121095. [Google Scholar] [CrossRef]
- Takagi, T.; Sugeno, M. Fuzzy Identification of Systems and Its Applications to Modeling and Control. IEEE Trans. Syst. Man. Cybern. 1985, SMC-15, 116–132. [Google Scholar] [CrossRef]
- Karaboga, D.; Kaya, E. Adaptive Network Based Fuzzy Inference System (ANFIS) Training Approaches: A Comprehensive Survey. Artif. Intell. Rev. 2019, 52, 2263–2293. [Google Scholar] [CrossRef]
- Gkountakou, F.; Papadopoulos, B. The Use of Fuzzy Linear Regression and ANFIS Methods to Predict the Compressive Strength of Cement. Symmetry 2020, 12, 1295. [Google Scholar] [CrossRef]
- Okwu, M.O.; Adetunji, O. A Comparative Study of Artificial Neural Network (ANN) and Adaptive Neuro-Fuzzy Inference System (ANFIS) Models in Distribution System with Nondeterministic Inputs. Int. J. Eng. Bus. Manag. 2018, 10, 1847979018768421. [Google Scholar] [CrossRef]
- Burke, E.K.; Kendall, G.; Whitwell, G. A New Placement Heuristic for the Orthogonal Stock-Cutting Problem. Oper. Res. 2004, 52, 655–671. [Google Scholar] [CrossRef]
- Bennell, J.A.; Oliveira, J.F. A Tutorial in Irregular Shape Packing Problems. J. Oper. Res. Soc. 2009, 60, S93–S105. [Google Scholar] [CrossRef]
- Lodi, A.; Martello, S.; Vigo, D. Recent Advances on Two-Dimensional Bin Packing Problems. Discret. Appl. Math. 2002, 123, 379–396. [Google Scholar] [CrossRef]
- Dickinson, J.K.; Knopf, G.K. A Moment Based Metric for 2-D and 3-D Packing. Eur. J. Oper. Res. 2000, 122, 133–144. [Google Scholar] [CrossRef]
- Morio, J. Global and Local Sensitivity Analysis Methods for a Physical System Global and Local Sensitivity Analysis. Eur. J. Phys. 2011, 32, 1577–1583. [Google Scholar] [CrossRef]
- Pineda, L.E.; Fregly, B.J.; Haftka, R.T.; Queipo, N. V Estimating Training Data Boundaries in Surrogate-Based Modeling. Struct. Multidiscip. Optim. 2010, 42, 811–821. [Google Scholar] [CrossRef]
Disclaimer/Publisher’s Note: The statements, opinions and data contained in all publications are solely those of the individual author(s) and contributor(s) and not of MDPI and/or the editor(s). MDPI and/or the editor(s) disclaim responsibility for any injury to people or property resulting from any ideas, methods, instructions or products referred to in the content. |
© 2025 by the authors. Licensee MDPI, Basel, Switzerland. This article is an open access article distributed under the terms and conditions of the Creative Commons Attribution (CC BY) license (https://creativecommons.org/licenses/by/4.0/).