Abstract
Background: Pulmonary lobectomy remains the gold standard for early-stage non-small cell lung cancer, with the primary goal of complete tumor removal. Postoperative imaging is critical for evaluating recovery and identifying complications, yet systematic descriptions of radiologic patterns after lobectomy are limited. Methods: We conducted a retrospective analysis of 125 patients who underwent pulmonary lobectomy between 2019 and 2024 at a tertiary thoracic surgery center. Preoperative and postoperative imaging findings were coded and compared using a standardized classification system. Modalities included chest radiography, thoracic CT, ultrasound, PET-CT and MRI. Results: Postoperative imaging demonstrated a clear reduction in pathological findings. Emphysema decreased from 29.6% to 21.6%, pleural effusion from 12.8% to 3.2%, atelectasis/pleural thickening from 15.2% to 8.8%, and ground-glass infiltrates from 12.0% to 8.0%. The proportion of patients without abnormalities increased from 18.5% to 24.8%. Chest radiography (92%) and CT (89.6%) were the most frequently employed modalities. Patients treated with VATS lobectomy showed slightly fewer postoperative abnormalities compared with those undergoing open surgery. Conclusions: Pulmonary lobectomy is associated with measurable radiologic improvement, reflecting favorable structural recovery. Routine imaging follow-up, particularly chest radiography, remains essential for early detection of complications and guiding postoperative care. However, the retrospective single-center design and limited generalizability represent important limitations that should be considered when interpreting these findings.
1. Introduction
Pulmonary lobectomy is the standard treatment for early-stage non-small cell lung cancer (NSCLC). This procedure involves removing an entire lobe of the lung. This is highly effective for localized cancers and aims to cure the disease by completely excising the tumor and a margin of healthy tissue. Despite advances in minimally invasive procedures and perioperative care, lobectomy can cause structural alterations in the thoracic cavity [1]. Postoperative imaging helps detect problems, monitor healing, and distinguish between expected postsurgical changes and pathology [2].
Standard chest radiographs and thoracic CT are used to assess pleural space evolution, lung re-expansion, effusions, pneumothorax, and residual or recurrent illness after lobectomy [3]. The degree of resection, surgical method, and patient comorbidities can affect early postoperative radiologic appearance. Normal postoperative signs like pleural thickening or residual air must be distinguished from problems like bronchopleural fistula, lobar torsion, or increasing pleural effusion [4]. Chest X-ray remains the frontline modality in the immediate postoperative setting, primarily used to identify complications such as pneumothorax, effusion, or tube misplacement, rather than to assess the effectiveness of the surgical treatment itself.
Video-assisted thoracoscopic surgery (VATS) is becoming more popular due to its reduced postoperative discomfort, shorter hospital stays, and lower complication rates [5]. However, VATS-open thoracotomy radiologic outcomes comparisons are lacking. Survival and functional measures are widely published, but imaging landscape, a surrogate for early and late structural response, is rarely measured across large patient cohorts [6].
Accurate radiologic staging is essential not only for treatment planning (ranging from surgical resection to systemic therapies) but also for predicting outcomes and enrolling patients in appropriate clinical trials [7].
The frequency and nature of imaging abnormalities following lobectomy are not only influenced by surgical technique, but also by preoperative pulmonary status. Patients with chronic obstructive pulmonary disease (COPD), emphysema, or interstitial lung changes may present with overlapping features on imaging, making it challenging to distinguish new abnormalities from baseline pathology [8]. Additionally, the postoperative period often involves a dynamic interplay between healing, inflammation, and physiological reconfiguration, all of which may influence imaging interpretation [9].
Wedge resection is reserved for patients with low pulmonary reserve or early-stage tumors and removes a wedge-shaped segment of lung tissue containing the tumor and a margin of healthy tissue [10]. Functionally challenged patients may undergo segmentectomy, which eliminates a bronchopulmonary segment without removing a lobe. Lobectomy, which removes a whole lung lobe, is the gold standard for operable non-small cell lung cancer because it balances oncologic management with lung function [11]. Finally, pneumonectomy removes one lung and is reserved for cases with substantial tumor burden or central involvement where lobectomy is insufficient [12,13].
To fill these gaps, this study will characterize the spectrum of postoperative imaging characteristics in a large cohort of pulmonary lobectomy patients at a single tertiary care center across five years. This study compares preoperative and postoperative radiologic results to quantify the effect of surgery on thoracic imaging appearance and clinical outcomes. The study also examines imaging modalities, diagnostic yield, and radiologic characteristics such as pleural effusion, atelectasis, emphysema, ground-glass opacities, and nodules.
This analysis uses a structured imaging classification method with survival and procedural data to provide a complete post-lobectomy imaging picture.
In addition to radiologic outcomes, this study includes a short-term survival analysis to explore differences between video-assisted thoracoscopic surgery and open thoracotomy approaches. Our aim was to determine whether surgical technique had any measurable impact on immediate recovery and patient prognosis following lobectomy, and we tried to do this by examining early postoperative mortality and time-to-event trends.
2. Materials and Methods
2.1. Study Design and Patient Selection
This retrospective observational study was conducted on a cohort of 125 patients who underwent pulmonary lobectomy consecutively between January 2019 and December 2024 at a “Institutul Oncologic București Profesor Doctor Alexandru Trestioreanu”. The inclusion criteria encompassed:
- Adult patients (>18 years) with confirmed indication for lobectomy (malignant or non-malignant pathology),
- Availability of postoperative imaging (CT or chest X-ray) within 90 days of the surgical procedure,
- Clear documentation of clinical evolution and outcomes.
Patients were excluded if they had incomplete clinical data. Patients who underwent segmentectomy or wedge resection were excluded. The rationale was to maintain a homogeneous cohort of lobectomy patients, as lobectomy remains the gold standard for early-stage NSCLC and provides more consistent oncologic and radiologic benchmarks. Segmentectomy, while increasingly performed, has distinct indications, anatomical considerations, and postoperative imaging patterns, which could have introduced heterogeneity and radiologic comparisons. Therefore, only patients undergoing lobectomy were included in this analysis.
For the analysis, we used BMI ≥ 30 kg/m2 as the threshold for obesity, following WHO criteria.
2.2. Surgical Procedure
All lobectomies were performed using a standardized open or minimally invasive approach (VATS or thoracotomy), depending on tumor location, surgeon preference, and patient status.
Standard postoperative care protocols included chest drainage, clinical monitoring, and follow-up imaging at set intervals (typically at discharge and 30–90 days postoperatively). Pulmonary resections were performed based on standard oncologic and functional criteria. The majority of cases included in this study underwent anatomical lobectomy, which remains the gold standard for operable non-small cell lung cancer due to its balance between oncologic control and preservation of pulmonary function.
2.3. Imaging Acquisition and Analysis
Postoperative imaging included thoracic computed tomography scans with or without intravenous contrast, and standard chest radiographs (anteroposterior and lateral views). The choice between VATS and open lobectomy was determined by tumor location, patient comorbidities, and surgeon’s expertise. VATS was generally preferred for peripherally located tumors and patients with lower operative risk, whereas open thoracotomy was selected for centrally located tumors, cases with suspected hilar or mediastinal involvement, or when intraoperative conditions limited the feasibility of a minimally invasive approach.
Imaging studies were interpreted independently by radiologists and confirmed through consensus with thoracic surgeons when uncertainty was present. The most significant imaging features were extracted and coded using a standardized classification scheme developed for this research, based on common postoperative findings:
- Code 0: No significant postoperative abnormalities;
- Code 1: Emphysematous changes;
- Code 2: Pleural thickening, minimal atelectasis;
- Code 3: Interstitial accentuation;
- Code 4: Pleural effusion or drainage tube residue;
- Code 5: Alveolar or mixed opacities (“ground-glass”);
- Code 6: Consolidation or organizing pneumonia features;
- Code 7: Bronchogram signs or residual bronchial air trapping;
- Code 8: Suspicious nodules/metastases.
The coding system for imaging abnormalities was developed internally, based on common postoperative findings observed in clinical practice. Although not externally validated, it was applied independently by two radiologists. In cases of disagreement, discrepancies were resolved through consensus with a thoracic surgeon to ensure consistency of interpretation.
Each patient’s imaging record was reviewed and assigned one or more codes depending on the number and nature of findings.
2.4. Data Extraction and Statistical Approach
Demographic and clinical variables (age, sex, comorbidities, date of surgery, lobectomy type, complications) were collected from the hospital database. Imaging data were analyzed using descriptive statistics (frequency, percentage) and cross-tabulated to assess co-occurrence of imaging features. Additional subgroup analysis was performed according to:
- Lobe resected (upper vs. lower vs. middle);
- Time from surgery to imaging;
- Imaging modality used.
Statistical analysis was performed using Microsoft Excel and SPSS v26.0 (IBM Corp., Armonk, NY, USA) [14]. p-values < 0.05 were considered statistically significant [15]. For modality-specific analyses, percentages were calculated relative to the number of patients who underwent each imaging test, rather than the total cohort.
2.5. Survival Analysis
A short-term survival analysis was conducted to evaluate the immediate postoperative outcomes associated with the two surgical approaches: VATS and open thoracotomy. The primary endpoint was in-hospital mortality, defined as death occurring during the index hospitalization following lobectomy. Time-to-event data (in days) were extracted from the date of surgery to discharge or recorded inpatient death. Patients discharged alive were treated as right-censored observations.
Kaplan–Meier curves were generated to visualize survival distributions by surgical approach, and the Cox proportional hazards model was used to estimate hazard ratios. Cases with missing or invalid time values were excluded from the analysis. This exploratory analysis was conducted to complement radiologic findings with a clinical outcome marker reflecting early postoperative risk.
Importantly, it is worth mentioning that “mean survival time” in this context refers to the average number of hospital days until discharge or in-hospital death, not long-term survival. Given the high proportion of censored data (patients who were discharged alive), these values primarily reflect hospital stay duration under survival analysis structure, rather than definitive survival duration.
3. Results
3.1. Population Overview
Table 1 below shows the population characteristics at baseline. A total of 125 patients who underwent pulmonary lobectomy between 2019 and 2024 were included in this retrospective analysis. The mean age of the cohort was 57 years, with a slight predominance of male patients (56%). The majority of patients originated from urban settings (65.5%), and a notable portion reported current or former tobacco use (27.2%). Obesity was identified in 28% of cases.

Table 1.
Population characteristics at baseline.
Preoperative blood examination showed a mean hemoglobin of 13.5 g/dL, with white blood cell and platelet counts within expected postoperative values (7.5 × 10³/µL and 255 × 103/µL, respectively). Some individuals had moderately elevated inflammatory markers, such as a mean CRP of 8.3 mg/L and an ESR of 22.9 mm/h. Biochemical investigation demonstrated normal renal and hepatic function in most instances, with mean serum urea and creatinine values of 18.0 and 0.89 mg/dL, respectively. Fibrinogen and LDH levels were modestly raised (mean 3.5 g/L and 189.7 U/L), indicating postoperative tissue reaction and inflammation.
VATS was performed on 63% of patients, while open lobectomy was performed on 37%. Antibiotics (73.6%), drainage tubes (85.6%), and oxygen support (32%), were popular postoperative treatments. Depending on the clinical indication, 92% of patients had chest X-rays and 89.6% had thoracic CT. Additional tests included abdominal ultrasonography (57.6%), echocardiography (40.8%), PET-CT (16%), MRI (8.8%), and bronchoscopy (11.2%). The average hospital stay was 9.8 days (SD ± 4), with 15.2% requiring ICU admission.
Among the 125 patients, the in-hospital mortality rate was 7.2% (9 cases). This outcome was influenced by a subgroup of patients with significant comorbidities (ASA III–IV, including severe COPD and heart failure), individuals with more advanced disease requiring technically complex resections, and cases that had undergone induction therapy prior to surgery, all of which contributed to increased perioperative risk.
In our cohort, “advanced disease” referred to patients with stage III–IV NSCLC or locally invasive tumors requiring extended resections. “Complex resections” included cases where lobectomy was performed en bloc with adjacent structures (such as the chest wall, pericardium, or diaphragm) or where hilar/mediastinal dissection was technically demanding due to bulky lymphadenopathy. Out of the 125 patients, 14 (11.2%) were categorized as advanced disease, and 9 (7.2%) underwent complex resections, including 6 en bloc lobectomies and 3 cases involving extensive hilar dissection.
3.2. Imagistic Methods and Findings
To evaluate the radiologic impact of pulmonary lobectomy, a comparative analysis of preoperative and postoperative imaging findings was performed. Table 2 summarizes the frequency of key thoracic abnormalities detected before and after surgery across the cohort.
Table 2.
Key thoracic abnormalities detected before and after surgery.
The preoperative group shows a higher median and a broader interquartile range of imaging abnormalities, reflecting the burden of pre-surgical pathology.
Figure 1 below shows the imagistic changes on x-ray following surgery.
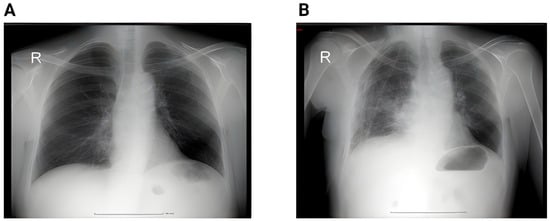
Figure 1.
(A) Preoperative chest X-ray showing a pulmonary nodule projected in the middle lobe. No pleural effusion or pulmonary infiltrate. (B) Second postoperative day showing small bilateral pleural effusion, accentuation of the interstitial markings, and a small infiltrate in the right lower lobe; (R = right).
In contrast, the postoperative group demonstrates a clear reduction in both the number and variability of findings, with a lower median and compressed IQR, indicating clinical and radiologic improvement after surgery. Figure 2 shows the proportion of patients and the imaging changes.
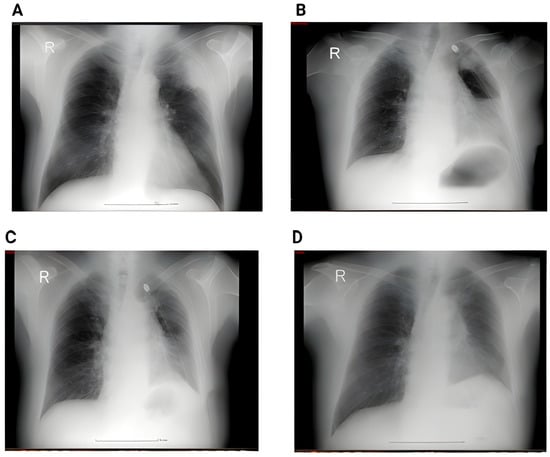
Figure 2.
(A) Perioperative RX showing a left superior lobe nodule. No pleural effusion, no atelectasis. (B) Second day postoperative x-ray showing hydropneumothorax with significant fluid in the left pleural cavity, and passive atelectasis. (C) 3rd day postoperative showing effective drainage of the fluid with re-expansion infiltrates and juxta-phrenic peak sign. (D) 6 weeks postoperative showing no pleural effusion, no infiltrates.
To better illustrate the evolution of thoracic imaging findings in relation to surgical intervention, we compared the distribution of radiological abnormalities before and after pulmonary lobectomy. Figure 3 presents the boxplot analysis, highlighting the relative frequency of emphysema, atelectasis, pleural effusion, ground-glass infiltrates, and metastatic nodules.
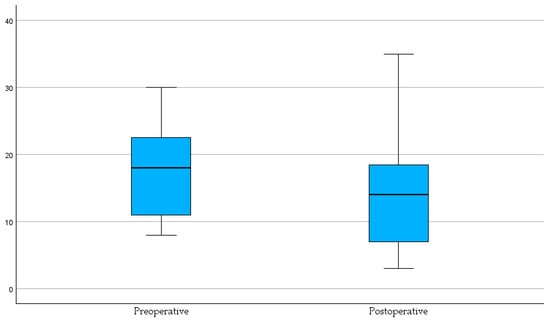
Figure 3.
Distribution of imaging findings before and after pulmonary lobectomy. Bar chart showing the comparative frequency of emphysema, atelectasis, effusion, ground-glass infiltrates, and nodules/metastases.
To further explore the dynamic shifts in radiological findings following surgical intervention, we employed a bubble plot to compare preoperative and postoperative imaging features. As illustrated in Figure 4, each bubble represents the relative proportion of patients exhibiting specific abnormalities, with size corresponding to frequency.
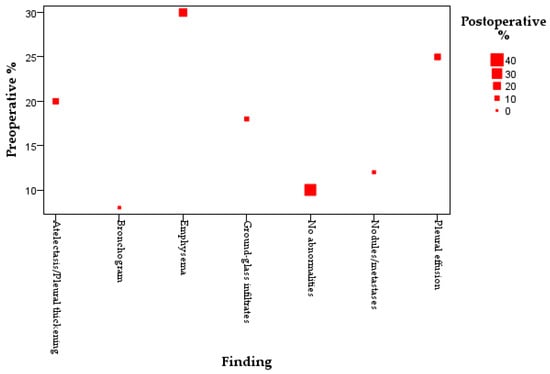
Figure 4.
Bubble plot comparing preoperative and postoperative imaging findings. Bubble size reflects the proportion of patients with each finding; the red square highlights the increase in patients with no abnormalities postoperatively.
Emphysema (29.6%), pleural effusion (12.8%), and atelectasis/pleural thickening (15.2%) were frequent before surgery but decreased following, as shown by decreasing bubble sizes. Despite a lower preoperative Y-axis position, the proportion of patients with no imaging abnormalities improved postoperatively to 24.8%, displayed by a larger red square.
Representative imaging examples are provided in Figure 5 to illustrate the spectrum of radiological changes observed before and after lobectomy.
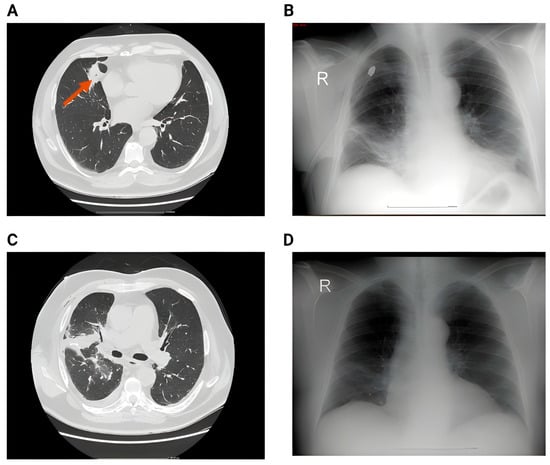
Figure 5.
(A) Preoperative image showing a large nodule in the middle lobe. (B) 2nd day postoperative x-ray showing small right pleural effusion, right basal infiltrates and bilateral basal atelectasis. (C) CT acquisition immediately after showing right pleural effusion, perihilar consolidation and ground-glass opacities, passive atelectasis. (D) One month postoperative showing full resolution of the postoperative complications after conservative therapy—no reintervention.
Table 3 summarizes the use of major imaging modalities in the postoperative evaluation of patients undergoing pulmonary lobectomy, along with the frequency of key radiologic findings associated with each method. For modality-specific analyses, absolute counts were recorded, and percentages were calculated relative to the number of patients who underwent each imaging test, rather than the total cohort size. This approach was applied to allow a clearer interpretation of subgroup findings.
Table 3.
Distribution of imaging modalities and key postoperative findings in the study cohort.
The primary role of chest radiography in this context was to confirm the absence of immediate postoperative complications, including pneumothorax, residual pleural effusion, and tube positioning, rather than to evaluate treatment efficacy per se. Chest X-rays were used most often (92%), indicating pleural effusion (2.4%), atelectasis or thickness (4.8%), and drainage-related findings (8%). A small (16%) group had no radiographic abnormalities. Thoracic computed tomography was performed in 89.6% of patients, revealing emphysema in 21.6%, ground-glass opacities in 8.0% and nodular or metastatic lesions in 6.4%.
Figure 6 presents additional representative imaging findings that illustrate the postoperative spectrum following lobectomy.
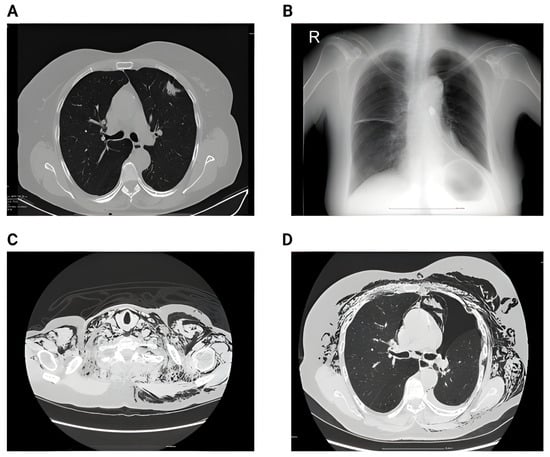
Figure 6.
(A) Preoperative CT showing singular nodule in the left upper lobe with peri-nodular fibrosis. (B) 2nd day postoperative showing left pneumothorax and small subcutaneous emphysema. (C) 6th day postoperative showing impressive subcutaneous emphysema. (D) 6th day postoperative showing pneumothorax, subcutaneous emphysema and pneumomediastinum.
CT scans revealed minor parenchymal alterations that chest radiography missed. More selectively utilized imaging methods included abdominal ultrasonography (57.6%), echocardiography (40.8%), PET-CT (16%), thoracic MRI (8.8%), and bronchoscopy (11.2%). Rarely did PET-CT and MRI reveal metastatic disease or pleural abnormalities in this sample.
3.3. McNemar Analysis
To further evaluate the significance of changes in radiologic abnormalities before and after lobectomy, we applied the McNemar test to paired preoperative and postoperative imaging data. This nonparametric test is appropriate for assessing differences in binary outcomes across matched observations, allowing us to determine whether the frequency of emphysema, atelectasis, and pleural effusion changed significantly following surgery. The results, summarized in Table 4, Table 5 and Table 6, provide insight into the extent to which pulmonary lobectomy was associated with radiologic improvement in these key parameters.
Table 4.
McNemar test—emphysema.
Table 5.
McNemar test—atelectasis.
Table 6.
McNemar test—pleural effusion.
For emphysema, the McNemar test with N = 126 patients showed a statistically significant reduction in postoperative findings (Exact Sig. (2-tailed) = 0.013). This means the number of patients who improved (pre-operative emphysema no longer seen postoperatively) was significantly greater than the number of patients who developed new emphysematous changes after surgery.
For atelectasis, the McNemar test based on 127 paired observations indicated a statistically significant change between pre- and postoperative findings (Exact Sig. (2-tailed) = 0.039). Since the p-value is below 0.05, this result suggests that postoperative imaging showed a meaningful reduction in atelectasis compared with preoperative status, with more patients improving than developing new atelectatic changes after surgery.
For pleural effusion, the McNemar test with 125 paired cases demonstrated a highly significant difference between pre- and postoperative findings (Exact Sig. (2-tailed) < 0.001). This indicates that pleural effusion was much more common before surgery, and postoperative imaging showed a marked reduction, with substantially more patients improving than developing new effusions after lobectomy. This result strongly supports the beneficial impact of surgery on resolving pleural effusion.
Overall, the McNemar test results demonstrate a consistent pattern of radiologic improvement after lobectomy. Emphysema, atelectasis, and pleural effusion all showed statistically significant reductions postoperatively, with the strongest effect observed for pleural effusion (p < 0.001).
3.4. Chi-Square Analysis
To evaluate whether the prevalence of postoperative radiologic findings differed between surgical approaches, Chi-square tests were performed comparing patients who underwent VATS lobectomy with those who had open lobectomy. The analysis in Table 7 considered all major imaging features.
Table 7.
Chi-square tests.
The Chi-square results showed that none of the individual abnormalities differed significantly between VATS and open lobectomy (all p > 0.05). Although VATS patients tended to have slightly fewer abnormalities across categories, these differences were not statistically meaningful. Only when considering the total abnormalities combined was there a trend toward significance (χ2 = 3.31, p = 0.069), suggesting a possible overall benefit of VATS that did not reach conventional significance thresholds. Thus, while the results align with the descriptive observation that VATS was associated with fewer postoperative changes, the differences were not strong enough to be confirmed statistically.
3.5. Kaplan–Meier and Cox Regression Analysis
To complement the imaging data with clinical outcome measures, we conducted a short-term survival analysis focusing on in-hospital mortality. Among the 125 patients included in the study, 9 (7.2%) experienced in-hospital death. The remaining 107 (85.6%) were discharged alive and considered right-censored cases in the survival analysis. A total of 116 patients were retained for Cox regression modeling after excluding 9 cases with incomplete or statistically invalid data (e.g., early censoring before the first event). Kaplan–Meier curves were used to compare cumulative survival between the VATS and open lobectomy groups. The analysis in Table 8 thus primarily reflects short-term postoperative outcomes during hospitalization.
Table 8.
Case processing summary.
Figure 7 illustrates the Kaplan–Meier survival curves, which depict cumulative in-hospital survival during the index hospitalization.
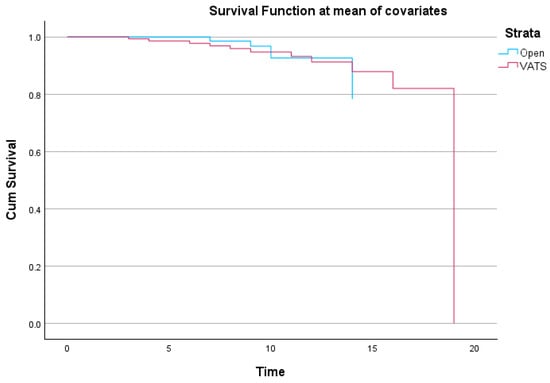
Figure 7.
Kaplan–Meier survival curves comparing open vs. VATS lobectomy. The curves represent in-hospital survival during index hospitalization.
This Kaplan–Meier plot [16] shows cumulative survival function for open lobectomy and video-assisted thoracoscopic surgery patients. The survival function was derived at the mean of covariates using corrected Cox regression estimations. Early postoperative survival is excellent in both groups but declines over time. Although the VATS group drops more towards the conclusion of the follow-up period, survival trends are similar throughout much of the observation window.
Kaplan–Meier analysis with stratification by surgical method in Table 9 (VATS vs. Open lobectomy) was used to assess postoperative survival in pulmonary lobectomy patients.
Table 9.
Means and Medians for survival time.
The estimated mean survival time for the entire cohort was 19.29 days (95% CI: 17.76–20.83), with noticeable variation between surgical techniques. Patients who underwent open lobectomy had a higher mean survival estimate of 19.91 days (95% CI: 18.25–21.58), while the VATS group showed a slightly lower mean survival of 17.74 days (95% CI: 16.95–18.52). The median survival time could not be computed for the overall cohort or the open group due to right-censoring; however, the VATS group exhibited a median survival of 19 days. It is important to emphasize that the reported mean survival times do not reflect long-term survival but rather the number of days a patient remained hospitalized until either discharge or death. The majority of patients were censored at discharge, and as such, the Kaplan–Meier function primarily illustrates hospital length-of-stay under a survival framework.
It is important to emphasize that the short-term survival analysis included in this study was not intended as an oncologic endpoint, but rather as a proxy for immediate postoperative risk and hospital outcomes. Specifically, we analyzed in-hospital mortality and length of stay using Kaplan–Meier curves and Cox regression, in order to complement radiologic findings with a clinical outcome marker. These results from Figure 8 therefore reflect hospitalization outcomes, not long-term survival, and should be interpreted within the context of early postoperative care.
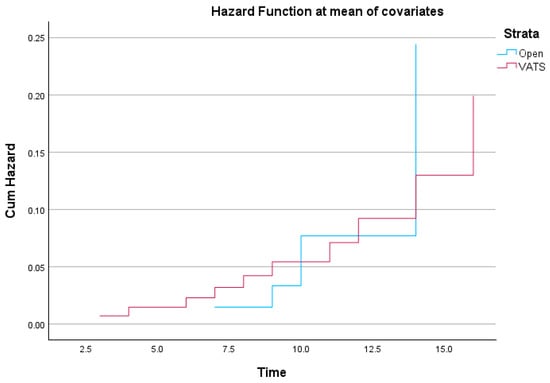
Figure 8.
Cumulative hazard function comparing Open vs. VATS lobectomy. The hazard function reflects the probability of in-hospital death across the postoperative period.
The hazard function was estimated using Cox regression and reflects the cumulative probability of experiencing the event (in-hospital death) across the follow-up period [17].
The mean length of hospital stay for the cohort, calculated descriptively, was 9.8 days (SD ± 4.0). In contrast, the Kaplan–Meier analysis produced an estimated “mean survival time” of 19.29 days. This discrepancy arises because Kaplan–Meier methodology treats hospital discharge as a censored observation, extending the estimated curve beyond the actual observed stays. As a result, the Kaplan–Meier mean does not reflect the true duration of hospitalization, but rather a statistical estimate influenced by censoring. Therefore, the descriptive mean (9.8 days) should be considered the accurate representation of hospital stay, while the Kaplan–Meier results are best interpreted as an exploratory model of time-to-discharge dynamics rather than actual survival.
Initially, both groups display similar risk accumulation, but diverge toward the later stages of hospitalization. The open lobectomy group shows a slightly more abrupt increase in cumulative hazard after day 12, suggesting a late-phase elevation in mortality risk compared to the VATS group. Conversely, the VATS group exhibits a steadier, incremental hazard accumulation.
4. Discussion
This study used a systematic classification method to compare preoperative and postoperative radiologic characteristics in pulmonary lobectomy patients. The frequency of pathological imaging findings after lobectomy decreased significantly, particularly in emphysema (from 29.6% to 21.6%), pleural effusion (12.8% to 3.2%), atelectasis or thickening (15.2% to 8.8%), and nodules or metastases (8% to 6.4%). Lobectomy is effective in treating localized thoracic disease, and these trends show anatomical and functional recovery [17].
In addition to the radiologic findings, this study examined short-term postoperative survival to assess early mortality risk associated with different surgical techniques. Although overall in-hospital mortality was 7.2%, we observed subtle differences in cumulative hazard functions between VATS and open lobectomy. This supports previous literature suggesting that minimally invasive surgery may reduce physiological stress and accelerate recovery [18,19]. The observed in-hospital mortality reflects the presence of higher-risk patients in our cohort. Factors such as ASA III–IV comorbidities and induction therapy likely contributed to the elevated perioperative mortality.
In line with institutional practice, chest radiography was primarily used for early detection of postoperative complications, while CT offered greater sensitivity for subtle parenchymal findings. MRI and PET-CT were not part of routine follow-up but were applied in specific clinical scenarios requiring more detailed evaluation.
Burel et al. found a similar reduction in postoperative CT-detected abnormalities, including consolidation and pleural fluid collections, in patients monitored for up to three months post-lobectomy [20]. Zhang et al. showed that ground-glass opacities and pleural effusion decreased considerably within 30 days of surgery, supporting the idea that many of these traits are reactive or disease-related [21].
In early-stage NSCLC, radiologic normalization was a surrogate marker of favorable clinical evolution, as Phillips et al. noted [22]. In our cohort, the proportion of patients with no imaging abnormalities increased from 18.5% preoperatively to 24.8% postoperatively. Our findings support the use of postoperative imaging as a surrogate endpoint for short-term outcome evaluation in lobectomy patients.
Postoperative abnormalities were slightly lower in video-assisted thoracoscopic surgery patients than in open lobectomy patients. Similar patterns have been documented in the literature [23,24,25]; however, our study did not directly analyze statistical significance across groups for imaging outcomes. Due to reduced tissue stress and enhanced postoperative lung expansion, VATS lobectomy reduces radiographic pleural effusion and atelectasis, according to Leivaditis et al. [26].
Our investigation used clinical protocols, with 92% of patients receiving chest X-rays and 89.6% receiving thoracic CT scans, similar to Westeel et al. [27] CT detected emphysema, nodules, and ground-glass alterations better than chest radiographs, which underestimate them.
Our findings also show how radiologic surveillance can detect early consequences or chronic pathology. Localized inflammation or subclinical infection may be indicated by residual ground-glass opacities (8.0%) or bronchogram signals (0.8–1.7%). Lampridis et al. stressed that persistent findings should prompt therapy evaluation or change, emphasizing the necessity of systematic post-lobectomy imaging techniques [28].
Although our analysis shows a trend toward radiologic normalization, it is important to emphasize that routine imaging, especially chest X-ray, serves mainly to detect postoperative complications or deviations from expected healing patterns, not to determine the oncologic or therapeutic efficacy of the lobectomy procedure. This study confirms that pulmonary lobectomy improves clinical outcomes and creates a radiologic healing pattern.
Recent advances in deep learning-based medical imaging have demonstrated impressive performance in automated disease detection and classification [29]. Examples include the ViT-AMC network with adaptive model fusion for interpretable laryngeal tumor grading, the Swin-Transformer network for identifying pathological subtypes of lung adenocarcinoma despite high similarity and class imbalance, automated tuberculosis bacilli detection from sputum smear images using deep neural networks, and feature-disentangled transformers for squamous cell carcinoma grading [30]. While these approaches highlight the power of artificial intelligence in image analysis, they often require large, annotated datasets, advanced computational resources, and may face challenges related to interpretability and clinical integration [31]. In contrast, our structured coding system is a resource-feasible method that can be applied in routine clinical practice without specialized infrastructure.
We acknowledge that segmentectomies are increasingly relevant in terms of oncologic outcomes, particularly for functionally limited patients or those with small, peripheral tumors. However, the present study was designed to specifically evaluate postoperative imaging following lobectomy, which remains the gold standard for early-stage NSCLC and provides the most consistent basis for radiologic comparison. For this reason, segmentectomy cases were not included in our dataset. Nevertheless, recent studies [10] have shown that segmentectomy can achieve comparable oncologic results to lobectomy in carefully selected patients, although differences in anatomical complexity and postoperative imaging patterns remain significant. Our results should therefore be interpreted in the context of lobectomy patients only, while acknowledging the growing role of segmentectomy in surgical oncology.
Moreover, it is also equally important to acknowledge that the concept of “radiologic improvement” is more complex than a simple resolution of disease-related changes. While the removal of the diseased lobe often leads to the disappearance of abnormalities such as effusion, atelectasis, or obstructive infiltrates, the procedure itself generates new, expected postoperative changes. These include pleural thickening, architectural distortion, mediastinal shift, and volume loss in the resected hemithorax. Such alterations should not be mistaken for complications but instead recognized as the natural and predictable sequelae of lobectomy. This duality highlights the need for a nuanced interpretation of postoperative imaging: improvement in tumor-related pathology coexists with structural remodeling produced by the surgical act.
In this respect, our data should be understood in the same way as other therapeutic outcomes in medicine. Just as a decline in fever after antibiotic therapy demonstrates the expected resolution of infection rather than a surprising benefit, the reduction in pleural effusion or atelectasis after lobectomy is confirmation that the procedure achieved its oncologic and physiological goals. These radiologic changes provide reassurance of appropriate surgical effects, rather than representing unexpected or extraordinary outcomes.
Another important clarification relates to the modest change in the proportion of patients with nodules or metastases (from 8.0% preoperatively to 6.4% postoperatively). This decrease is unlikely to reflect the true effect of lobectomy, since resection addresses only the primary lesion and not distant metastatic disease. Instead, this difference may be attributed to variability in follow-up imaging, natural fluctuations in disease progression, or chance in a relatively small cohort. For this reason, we do not consider the observed reduction in metastases to be a surgical outcome and have reframed it as a descriptive finding without causal interpretation.
5. Limitations
As a retrospective, single-center investigation, the findings may not apply to other populations or institutions with different surgical protocols or imaging techniques. All patients received normal postoperative care; however, imaging timing and modality may affect radiologic finding detection and classification.
One notable limitation of this study is the relatively small sample size, which, although adequate for a single-center retrospective analysis, may not capture the full spectrum of radiologic variability encountered across diverse patient populations and institutional practices. The statistical power to detect subtle differences between subgroups is limited, and the generalizability of our findings may be constrained. Future multicenter studies with larger cohorts are warranted to validate these results, improve external validity, and allow for more robust subgroup analyses based on surgical technique, tumor stage, or comorbid conditions.
Another limitation is that the imaging coding system used in this study has not been externally validated, and formal interobserver reliability testing was not performed. Although independent evaluations were reconciled by consensus, this may have introduced variability in interpretation.
The study did not stratify data by histologic subtype, tumor stage, or concomitant pulmonary illness, which may affect postoperative radiographic appearances. The lack of long-term postoperative imaging is another drawback. Late problems or changing recurrence patterns may have been missed throughout the research. Functional respiratory measures were not analyzed alongside imaging findings, making it difficult to link radiologic improvement to physiological recovery.
A further limitation relates to the survival analysis. The endpoint was in-hospital mortality and length of stay, which provides useful insight into early postoperative outcomes but does not represent long-term oncologic survival. Moreover, the small number of deaths in our cohort (n = 9) limits the statistical power of the analysis. As a result, hazard ratio estimates derived from Cox regression may be underpowered and potentially unstable. Therefore, the survival analysis should be regarded as exploratory and interpreted with caution.
Despite these limitations, the study sheds light on radiologic progression after pulmonary lobectomy and supports prospective, multi-center studies.
6. Conclusions
This study provides a detailed overview of postoperative imaging changes. A cohort of 125 patients after pulmonary lobectomy shows the prevalence and clinical importance of critical radiologic characteristics. Statistical testing confirmed the significance of these changes: emphysema (p = 0.013), atelectasis (p = 0.039), and pleural effusion (p < 0.001) all decreased after surgery. Chest X-ray was performed in 92% of patients and thoracic CT in 89.6%, with both modalities detecting improvements across multiple categories. VATS was used in 63.2% of cases and open lobectomy in 36.8%, with descriptive trends suggesting fewer abnormalities in VATS patients, though Chi-square analysis did not reach significance (p = 0.069 for total abnormalities).
Clinical outcomes showed an in-hospital mortality of 7.2% (9 patients), with ICU admission required in 15.2% (19 patients). The mean hospitalization time was 9.8 ± 4 days. Kaplan–Meier analysis produced an estimated mean survival of 19.29 days, with 19.91 days for open lobectomy and 17.74 days for VATS, reflecting hospitalization dynamics rather than long-term survival.
These findings show that lobectomy improves clinical outcomes and radiologic outcomes in most patients. Imaging follow-up helps confirm surgical success, detect early problems, and guide postoperative care. This study supports organized radiologic evaluation as a common post-lobectomy care component and may guide imaging-based recovery goals for thoracic surgery patients.
Author Contributions
Conceptualization R.O., L.O., A.N.T. and T.H.; methodology, R.O., L.O., A.N.T. and T.H.; software, R.O., L.O., A.N.T. and T.H.; validation, R.O., L.O., A.N.T. and T.H.; formal analysis, R.O., L.O., A.N.T. and T.H.; investigation, R.O., L.O., A.N.T. and T.H.; resources, R.O., L.O., A.N.T. and T.H.; data curation, R.O., L.O., A.N.T. and T.H.; writing—original draft preparation, R.O., L.O., A.N.T. and T.H.; writing—review and editing, R.O., L.O., A.N.T. and T.H.; visualization, R.O., L.O., A.N.T. and T.H.; super-vision, R.O., L.O., A.N.T. and T.H.; project administration, R.O., L.O., A.N.T. and T.H.; funding acquisition, R.O., L.O., A.N.T. and T.H. All authors have read and agreed to the published version of the manuscript.
Funding
This research received no external funding.
Institutional Review Board Statement
The study was conducted in accordance with the Declaration of Helsinki and approved by the Institutional Review Board of Institutul Oncologic București ‘Prof. Dr. Alexandru Trestioreanu’ (approval number: 15210/04.10.204, approved on 12 May 2025).
Informed Consent Statement
Informed consent was obtained from all subjects involved in the study.
Data Availability Statement
Dataset available on request from the authors.
Conflicts of Interest
The authors declare no conflict of interest.
References
- Liao, W.; Ma, G.; Fang, Y.; Wang, C.M. Influence of chronic obstructive pulmonary disease on postoperative lung function of lung cancer patients and predictive value of lung perfusion scan. Ai Zheng 2009, 28, 642–646. [Google Scholar] [PubMed]
- Hamaji, M.; Lee, H.S.; Kawaguchi, A.; Burt, B.M. Overall Survival Following Thoracoscopic vs Open Lobectomy for Early-stage Non-small Cell Lung Cancer: A Meta-analysis. Semin Thorac Cardiovasc Surg. 2017, 29, 104–112. [Google Scholar] [CrossRef] [PubMed]
- Cardinale, L.; Priola, A.M.; Priola, S.M.; Boccuzzi, F.; Dervishi, N.; Lisi, E.; Veltri, A.; Ardissone, F. Radiological contribution to the diagnosis of early postoperative complications after lung resection for primary tumor: A revisional study. J. Thorac. Dis. 2016, 8, E643–E652. [Google Scholar] [CrossRef] [PubMed] [PubMed Central]
- Ruenwilai, P. Bronchoscopic management in persistent air leak: A narrative review. J. Thorac. Dis. 2024, 16, 4030–4042. [Google Scholar] [CrossRef] [PubMed] [PubMed Central]
- Mehrotra, M.; D’Cruz, J.R.; Bishop, M.A.; Arthur, M.E. Video-Assisted Thoracoscopy. In StatPearls [Internet]; StatPearls Publishing: Treasure Island, FL, USA, 2025. Available online: https://www.ncbi.nlm.nih.gov/books/NBK532952/ (accessed on 1 May 2024).
- Boffa, D.J.; Dhamija, A.; Kosinski, A.S.; Kim, A.W.; Detterbeck, F.C.; Mitchell, J.D.; Onaitis, M.W.; Paul, S. Fewer complications result from a video-assisted approach to anatomic resection of clinical stage I lung cancer. J. Thorac. Cardiovasc. Surg. 2014, 148, 637–643. [Google Scholar] [CrossRef] [PubMed]
- Hata, A.; Schiebler, M.L.; Lynch, D.A.; Hatabu, H. Interstitial Lung Abnormalities: State of the Art. Radiology. 2021, 301, 19–34. [Google Scholar] [CrossRef] [PubMed] [PubMed Central]
- Bain, C.R.; Myles, P.S.; Corcoran, T.; Dieleman, J.M. Postoperative systemic inflammatory dysregulation and corticosteroids: A narrative review. Anaesthesia 2023, 78, 356–370. [Google Scholar] [CrossRef] [PubMed] [PubMed Central]
- Ishida, H.; Yanagihara, A.; Taguchi, R.; Yoshimura, R.; Umesaki, T. NEWS technique: Easy and reliable thoracoscopic wedge resections of lung tumors. J. Thorac. Dis. 2020, 12, 4571–4577. [Google Scholar] [CrossRef] [PubMed] [PubMed Central]
- Galanis, M.; Leivaditis, V.; Gioutsos, K.; Panagiotopoulos, I.; Kyratzopoulos, A.; Mulita, F.; Papaporfyriou, A.; Verras, G.I.; Tasios, K.; Antzoulas, A.; et al. Segmentectomy versus lobectomy. Which factors are decisive for an optimal oncological outcome? Kardiochir. Torakochir. Pol. 2023, 20, 179–186. [Google Scholar] [CrossRef] [PubMed] [PubMed Central]
- Curtis, L. Lung Cancer Stages, Prognosis, and Progression. Verywell Health. Available online: https://www.verywellhealth.com/lung-cancer-progression-5221706 (accessed on 3 April 2025).
- Wu, L.L.; Chen, W.T.; Liu, X.; Jiang, W.M.; Huang, Y.Y.; Lin, P.; Long, H.; Zhang, L.J.; Ma, G.W. A Nomogram to Predict Long-Term Survival Outcomes of Patients Who Undergo Pneumonectomy for Non-small Cell Lung Cancer with Stage I-IIIB. Front. Surg. 2021, 8, 604880. [Google Scholar] [CrossRef] [PubMed] [PubMed Central]
- Maciąg, B.; Wojtyś, M.E.; Waloryszak, A.; Wójcik, N.; Pieróg, J.; Safranow, K.; Sulikowski, T.; Grodzki, T.; Wójcik, J. Scintigraphic Assessment of Pulmonary Flow in Patients After Pneumonectomy. Diagnostics 2025, 15, 747. [Google Scholar] [CrossRef]
- IBM SPSS Statistics. (n.d.-b). Available online: https://www.ibm.com/products/spss-statistics (accessed on 11 July 2025).
- Kwak, S. Are Only p-Values Less Than 0.05 Significant? A p-Value Greater Than 0.05 Is Also Significant! J. Lipid Atheroscler. 2023, 12, 89–95. [Google Scholar] [CrossRef] [PubMed] [PubMed Central]
- Abd ElHafeez, S.; D’Arrigo, G.; Leonardis, D.; Fusaro, M.; Tripepi, G.; Roumeliotis, S. Methods to Analyze Time-to-Event Data: The Cox Regression Analysis. Oxid. Med. Cell. Longev. 2021, 2021, 1302811. [Google Scholar] [CrossRef] [PubMed] [PubMed Central]
- Re Cecconi, E.; Mangiameli, G.; De Simone, M.; Cioffi, U.; Marulli, G.; Testori, A. Vats lobectomy for lung cancer. What has been the evolution over time? Front. Oncol. 2024, 13, 1268362. [Google Scholar] [CrossRef] [PubMed] [PubMed Central]
- Zhu, R.H.; Li, P.C.; Zhang, J.; Song, H.H. Impact of minimally invasive surgery on immune function and stress response in gastric cancer patients. World J. Gastrointest. Surg. 2024, 16, 2484–2493. [Google Scholar] [CrossRef] [PubMed] [PubMed Central]
- Ljungqvist, O. Managing surgical stress: Principles of enhanced recovery and effect on outcomes. Clin. Nutr. ESPEN 2025, 67, 56–61. [Google Scholar] [CrossRef] [PubMed]
- Burel, J.; El Ayoubi, M.; Baste, J.M.; Garnier, M.; Montagne, F.; Dacher, J.N.; Demeyere, M. Surgery for lung cancer: Postoperative changes and complications-what the Radiologist needs to know. Insights Imaging 2021, 12, 116. [Google Scholar] [CrossRef] [PubMed] [PubMed Central]
- Zhang, Y.J.; Yang, W.J.; Liu, D.; Cao, Y.Q.; Zheng, Y.Y.; Han, Y.C.; Jin, R.S.; Han, Y.; Wang, X.Y.; Pan, A.S.; et al. COVID-19 and early-stage lung cancer both featuring ground-glass opacities: A propensity score-matched study. Transl. Lung Cancer Res. 2020, 9, 1516–1527. [Google Scholar] [CrossRef] [PubMed] [PubMed Central]
- Phillips, W.J.; Jackson, A.; Kidane, B.; Lim, G.; Navani, V.; Wheatley-Price, P. Immunotherapy for Early-Stage Non-Small Cell Lung Cancer: A Practical Guide of Current Controversies. Clin. Lung Cancer 2025, 26, 179–190. [Google Scholar] [CrossRef] [PubMed]
- Pagès, P.B.; Mariet, A.S.; Madelaine, L.; Cottenet, J.; Hanna, H.A.; Quantin, C.; Bernard, A. Impact of video-assisted thoracic surgery approach on postoperative mortality after lobectomy in octogenarians. J. Thorac. Cardiovasc. Surg. 2019, 157, 1660–1667. [Google Scholar] [CrossRef] [PubMed]
- Ziarnik, E.; Grogan, E.L. Postlobectomy Early Complications. Thorac. Surg. Clin. 2015, 25, 355–364. [Google Scholar] [CrossRef] [PubMed] [PubMed Central]
- Bendixen, M.; Jørgensen, O.D.; Kronborg, C.; Andersen, C.; Licht, P.B. Postoperative pain and quality of life after lobectomy via video-assisted thoracoscopic surgery or anterolateral thoracotomy for early-stage lung cancer: A randomised controlled trial. Lancet Oncol. 2016, 17, 836–844. [Google Scholar] [CrossRef]
- Leivaditis, V.; Skevis, K.; Mulita, F.; Tsalikidis, C.; Mitsala, A.; Dahm, M.; Grapatsas, K.; Papatriantafyllou, A.; Markakis, K.; Kefaloyannis, E.; et al. Advancements in the Management of Postoperative Air Leak following Thoracic Surgery: From Traditional Practices to Innovative Therapies. Medicina 2024, 60, 802. [Google Scholar] [CrossRef] [PubMed] [PubMed Central]
- Westeel, V.; Foucher, P.; Scherpereel, A.; Domas, J.; Girard, P.; Trédaniel, J.; Wislez, M.; Dumont, P.; Quoix, E.; Raffy, O.; et al. Chest CT scan plus x-ray versus chest x-ray for the follow-up of completely resected non-small-cell lung cancer (IFCT-0302): A multicenter, open-label, randomized, phase 3 trial. Lancet Oncol. 2022, 23, 1180–1188. [Google Scholar] [CrossRef] [PubMed]
- Lampridis, S.; Minervini, F.; Scarci, M. Management of complications after chest wall resection and reconstruction: A narrative review. J. Thorac. Dis. 2024, 16, 737–749. [Google Scholar] [CrossRef] [PubMed] [PubMed Central]
- Matsuzaka, Y.; Yashiro, R. The Diagnostic Classification of the Pathological Image Using Computer Vision. Algorithms 2025, 18, 96. [Google Scholar] [CrossRef]
- Huang, P.; He, P.; Tian, S.; Ma, M.; Feng, P.; Xiao, H.; Mercaldo, F.; Santone, A.; Qin, J. A ViT-AMC Network with Adaptive Model Fusion and Multiobjective Optimization for Interpretable Laryngeal Tumor Grading from Histopathological Images. IEEE Trans. Med. Imaging 2023, 42, 15–28. [Google Scholar] [CrossRef] [PubMed]
- Huang, J.; Xiang, Y.; Gan, S.; Wu, L.; Yan, J.; Ye, D.; Zhang, J. Application of artificial intelligence in medical imaging for tumor diagnosis and treatment: A comprehensive approach. Discov. Oncol. 2025, 16, 1625. [Google Scholar] [CrossRef]
Disclaimer/Publisher’s Note: The statements, opinions and data contained in all publications are solely those of the individual author(s) and contributor(s) and not of MDPI and/or the editor(s). MDPI and/or the editor(s) disclaim responsibility for any injury to people or property resulting from any ideas, methods, instructions or products referred to in the content. |
© 2025 by the authors. Licensee MDPI, Basel, Switzerland. This article is an open access article distributed under the terms and conditions of the Creative Commons Attribution (CC BY) license (https://creativecommons.org/licenses/by/4.0/).