Abstract
Coastality, the degree to which a place or community is functionally, spatially, or symbolically oriented toward the ocean, has received limited attention in Ocean Literacy research. This study introduces perceived coastality as a youth-centered construct and develops the Coastality Gap Index (CGI), a spatial indicator measuring the divergence between students’ coastal-inland identity and their actual geographic proximity to the sea. A mixed-methods design was applied to data from 645 students aged 10–17 across 11 schools in five municipalities in Mallorca (Spain). The questionnaire explored emotional, cognitive, and experiential connections to the ocean, while K-means clustering identified perceptual profiles and GIS analysis examined their spatial distribution. Five distinct profiles emerged, ranging from students who perceive themselves as coastal with strong ocean ties, to others who live near the coast yet exhibit limited awareness or connection. The CGI revealed that 14 of 29 population centers studied were inland-oriented despite coastal proximity, with values ranging from −0.07 to +0.72. Notable disconnects occurred in municipalities like Manacor (CGI = 0.41) and Artà (CGI = 0.34), where majority of students identified as “inland” despite living within 13 km of the coast, well within the EU’s 20 km coastal belt definition. The perceptual typology and spatial indicator provide a transferable framework for rethinking blue education strategies and designing context-sensitive Ocean Literacy interventions that account for symbolic as well as geographic dimensions of marine identity.
1. Introduction
1.1. Coastality as a Framework for Understanding Symbolic Connections to the Ocean
Coastality refers to the extent to which a given location or community exhibits spatial, functional, or symbolic orientation toward the ocean. Although still underdeveloped as a theoretical construct, the term has been applied in archeological and territorial studies to analyze how maritime proximity shapes patterns of settlement, mobility, and coastal engagement, both materially and culturally [,].
Institutional definitions of what constitutes a coastal area rely primarily on physical distance and vary across contexts. The Food and Agriculture Organization defines coastal zones as areas within 100 km of the shoreline [,]. In the European context, Eurostat classifies a local administrative unit (LAU) as coastal if it either borders the sea directly or if at least 50% of its surface lies within 10 km of the coastline []. The Copernicus Land Monitoring Service also applies a 10 km inland boundary for defining coastal zones. Complementing these spatial definitions, the Copernicus Marine Service emphasizes the socio-economic importance of the 50 km coastal strip, where nearly 40% of the EU population resides, framing it as a priority zone for environmental observation and marine policy []. while the EU Blue Schools program uses a 20 km threshold []. These spatial frameworks assume that geographic proximity determines coastal character.
However, physical proximity does not automatically generate emotional attachment or marine awareness. Research on place identity [] marine identity [,,] and broader theories of sense of place [] demonstrates that symbolic belonging is shaped through cultural narratives, lived experiences, and education rather than mere distance. Anthropological and archeological evidence demonstrates that symbolic connections to the sea are culturally and experientially constructed: Nuttall [] shows that seascapes (a place or agent created by a human mind) emerge through everyday practices and memory, rather than physical proximity alone. Similarly, Lessner and Preece [] highlight how social factors, marginalization, and infrastructure shape coastal perception, even in communities physically close to the sea. Island studies further support this pattern: Larjosto [] documents how Anthropocene transformations reshape littoral spaces and hybridize symbolic and material relationships with the ocean.
Beyond cultural and perceptual influences, social structures and governance mediate maritime identity. Gospodini et al. [] emphasize that participatory networks and social engagement are key to creating meaningful connections to maritime heritage, demonstrating that symbolic attachment depends on inclusion and co-management rather than proximity alone. Jones [] introduces the concept of “blue geopolitics”, capturing an oceanic turn in political geography theories, emphasizing the role of the sea in global environmental and political systems, while Oishi, Talhelm, and Lee [] demonstrate that landscape preferences (mountain vs. ocean) stem from personality traits rather than mere physical distance. This resonates with the anthropological perspective of Ignasi Terradas [] who distinguishes between juridical identification, anchored in ownership and property, and lived identity, which “cultivates, among other things, the landscape as perception and memory of life”. Evidence from case studies such as Cap de Creus [] shows that reinforcing emotional ties to coastal environments can be more effective for conservation than increasing marine knowledge alone.
Despite growing recognition that geography and perception can diverge, Ocean Literacy (OL) literature lacks instruments to systematically measure the disconnect between physical coastal proximity and symbolic identification with the ocean. While theories of place identity and marine awareness acknowledge this potential mismatch, existing research provides no framework to diagnose where and how this disconnection occurs, particularly among young populations in coastal contexts.
We address this gap by introducing the concept of perceived coastality to describe the subjective sense of connection to the ocean, which does not always correspond to physical distance. Unlike place identity, which focuses on general environmental attachment, or marine identity, which assumes prior connection, perceived coastality specifically captures the spectrum of coastal-to-inland self-identification and enables systematic comparison with objective spatial position. Some individuals may feel strong coastal identity when living 20 km inland, while others feel detached from the ocean despite residing only 10 km away.
Integrating perceived coastality into OL research can support the development of context-sensitive educational strategies that align with local symbolic geographies. It can help inland students foster meaningful connections to the sea while addressing disengagement among coastal youth. In policy and conservation contexts, recognizing symbolic detachment can support efforts to socially anchor the Blue Economy, strengthen participatory governance, and improve coastal resilience initiatives. This approach aligns with broader frameworks in Education for Sustainable Development, which emphasize the need to cultivate core sustainability competencies, such as systems thinking, anticipatory reasoning, and strategic action, that enable transformative learning and foster critical connections between people and their environments [].
1.2. Contextual Focus: The Case of Mallorca
Island contexts, such as Mallorca, provide a particularly rich setting for examining how coastality manifests in everyday perception. Despite the island’s insular geography, with over 555 km of coastline and a total surface area of approximately 3640 square kilometers [], symbolic connections to the marine environment cannot be taken for granted. In fact, residents do not always perceive their hometowns as coastal, even though no point on the island lies more than 25 km from the sea [] a distance that would fall within the definition of “coastal area” under at least two formal frameworks (FAO and Copernicus) and comes close to the 20 km threshold used by the EU Blue Schools program.
Mallorca, like other Mediterranean islands, falls under a complex framework of maritime jurisdiction. According to the international law UNCLOS [] the territorial waters of Spain extend 12 nautical miles from the baseline, while the Exclusive Economic Zone (EEZ) may reach up to 200 nautical miles. Within this maritime space, the Balearic Islands exercise autonomous competences over coastal fisheries, aquaculture, and marine heritage through legislation such as the Balearic Law 6/2013 on maritime fishing and aquaculture [].
Historically, the configuration of Mallorcan settlements reflects longstanding defensive strategies. Many towns were deliberately established several kilometers inland to protect inhabitants from coastal attacks, particularly during periods of frequent piracy and military threats [,]. This historical pattern resulted in a clear distinction between inland urban centers and their corresponding ports, as seen in examples such as Pollença and Port de Pollença or Sóller and Port de Sóller. This spatial organization was further transformed by the 20th-century tourism boom, which dramatically reshaped Mallorca’s territorial dynamics []. The landscape became increasingly bifurcated into tourism-oriented coastal zones and urbanized or agricultural interiors. Tourism-driven urban expansion led to the emergence of new social spaces that disrupted traditional socio-economic patterns, benefiting local communities in some ways, but also generating new territorial and social disconnections []. These transformations continue to influence symbolic geographies today, reinforced through education, media representations, and local development practices []. This divide is clearly illustrated in Figure 1, which shows that in many coastal municipalities, the historical and administrative centers are located approximately 10 km inland, while the primary economic activities now take place in the coastal resort areas.
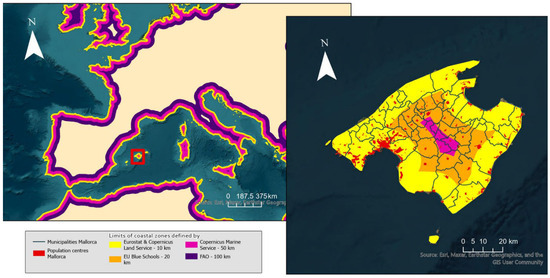
Figure 1.
Conceptual definitions of coastal zones across international and regional frameworks. The map includes population centers and municipal boundaries of Mallorca to contextualize these spatial classifications within an island setting. Developed by the authors.
These historical and contemporary spatial dynamics have important implications for how island residents symbolically relate to their environment. Understanding these perceptions requires moving beyond mere geographic distance and considering broader cultural, historical, and educational processes.
In the specific context of Mallorca, empirical studies [,] reveal that many children marginalize, or entirely omit, the sea in their mental maps and representations of the island, often showing only a limited number of coastal landmarks, despite living in an insular territory. Their findings underline how local perceptions are shaped by historical trajectories and educational frameworks, further challenging the assumption that coastal living inherently fosters maritime awareness.
In this context, the present study uses ocean to refer to global and conceptual dimensions, particularly in relation to OL frameworks, while sea describes the local Mediterranean setting and everyday relationships with the marine environment in Mallorca, reflecting the Mallorquin term “la mar”.
1.3. The Coastality Gap Index: A Tool for Measuring Spatial-Symbolic Disconnect
To systematically measure the divergence between physical location and symbolic identification, we introduce the Coastality Gap Index (CGI). This quantitative tool combines students’ self-reported inland/coastal orientation with normalized distance from the shoreline, enabling spatial visualization of perceptual disconnects.
The CGI represents a methodological advance over existing approaches in three ways. First, it operationalizes a previously unmeasured construct: while place attachment scales measure general environmental connection and OL assessments focus on knowledge, the CGI specifically quantifies the divergence between where people are and how coastal they feel. Second, by producing mappable values, it enables spatial diagnosis of which communities experience the greatest mismatch between location and identity. Third, the index is scalable and transferable to other coastal or island contexts, facilitating comparative research and evidence-based OL strategy design.
This framework allows researchers and policymakers to move beyond describing coastal-inland perceptions to systematically mapping and quantifying them, a critical step for designing targeted educational interventions and marine engagement policies.
Empirical studies further reinforce the need for tools like the CGI. In urban marine contexts, Salazar et al. [] show that individuals living near the coast can still hold limited or distorted understandings of marine ecosystems. Educational interventions using jellyfish as a flagship species also demonstrate that perception can be modified through participatory, co-designed approaches []. These findings confirm that symbolic identification often operates independently of physical proximity, highlighting the value of quantifying the coastality gap.
1.4. Research Aims and Hypotheses
This study pursues three interrelated objectives:
Objective 1: To measure the relationship between objective coastal proximity and symbolic self-identification. Symbolic self-identification refers to students’ subjective categorization of their municipality as “coastal” or “inland,” operationalized through self-report questions and symbolic imagery selection. The spatial indicator is normalized Euclidean distance from each residential center to the nearest coastline, calculated using GIS.
Objective 2: To develop the Coastality Gap Index (CGI), a raster-based spatial indicator quantifying divergence between symbolic inland identification (proportion of students self-identifying as inland) and normalized geographic distance. This enables identification of areas where perceived coastality diverges from physical proximity.
Objective 3: To identify distinct perceptual profiles among students through K-means clustering based on emotional connection, experiential engagement (coastal visits, marine activities), OL (global and local), and social dimensions (information sources, marine conversations).
From these objectives, the following hypotheses are proposed:
H1.
Although many students reside in municipalities classified as coastal according to objective EU criteria (less than 10 km [,] or 20 km [] from the coastline), a significant proportion will perceive themselves as living inland, both in their self-identification and in the symbolic images they select to represent their environment.
H2.
Beyond a simple coastal/inland divide, distinct perceptual profiles can be identified among students, based on their emotional connection, symbolic associations, experiential practices, and knowledge levels.
2. Materials and Methods
The research was conducted through the following sequential stages:
Stage 1: Questionnaire Design and Validation
The research began with the design of a structured questionnaire capturing emotional, cognitive, experiential, and identity-related dimensions of students’ marine relationships, validated through expert review by specialists in marine science education, biology, and geography, and pilot tested during a fish-fair event one week prior to main data collection.
Stage 2: Data Collection
Data collection involved immersive workshops implemented across 11 schools in 5 municipalities in Mallorca, reaching 645 students aged 10–17 during October-November 2024, with questionnaires administered following workshop activities and collected under teacher supervision in classroom settings.
Stage 3: Dual Analytical Approach
Spatial Analysis strand:
The spatial analysis developed a Coastality Gap Index (CGI) integrating self-reported inland-coastal orientation with normalized shoreline distances to identify symbolic-physical coastality mismatches.
Perceptual Profiling strand:
The perceptual analysis employed K-means clustering on emotional, experiential, and cognitive variables to identify five distinct youth perceptual profiles.
Stage 4: Synthesis and Integration
Cross-analysis of spatial patterns with perceptual typologies
2.1. Participants and Context
Mallorca, the largest island of the Balearic archipelago, covers approximately 3640 km2 and has a population of 957,726 inhabitants in 2024 []. The population is unevenly distributed, with higher densities in coastal municipalities and Palma, the capital. Youth aged 10–17 represent approximately 8.7% of the total population, reflecting a substantial demographic for educational and environmental studies.
The workshops were implemented across five municipalities on the island of Mallorca: Artà, Capdepera, and Pollença, three coastal municipalities bordering the Channel of Menorca, the area wherein the videos of the workshops were mainly filmed; Manacor, the second biggest coastal municipality on the island; and Inca, a municipality with no direct access to the coast.
Artà-Colònia de Sant Pere, Capdepera-Cala Rajada, Pollença-Port de Pollença, and Manacor-Porto Cristo demonstrate dual territorial identities. Their inland urban centers maintain close geographic and functional ties to nearby coastal settlements, typically former fishing ports or beach communities. In contrast, Inca represents a distinctly inland case, located approximately 21 km from the nearest coastline (Alcúdia), placing it beyond the European Union’s operational definition of a coastal zone. The distances between urban centers and their respective coastal settlements are shown in Figure 2. While the workshops were officially conducted in these five municipalities, the final dataset reflects a broader territorial reach. Students attending the selected schools came from a total of 29 distinct population centers, due to the fact that many schools in these municipalities serve surrounding areas, including smaller towns, coastal villages, and dispersed settlements. This extended territorial coverage enriched the spatial diversity of the sample and provided a more nuanced view of how young people from both primary and secondary settlements perceive coastality across the island.
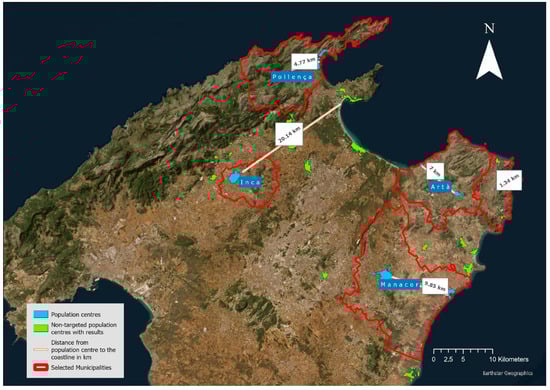
Figure 2.
Physical map of Mallorca showing the selected municipalities for the workshops, main population centers, and their respective distances from the coast (in kilometers).
Manacor and Inca were selected not only for territorial diversity but also for their demographic significance. With populations ranging between 30,000 and 50,000 inhabitants [], both municipalities rank among the largest urban centers outside Palma and serve as regional hubs for education and public services. Notably, although Inca is geographically inland, many students report regular personal or family ties to coastal areas, particularly Can Picafort [] offering a valuable case for exploring the interplay between physical geography and perceived coastality.
Sampling Strategy and Limitations
All schools located within the five target municipalities were invited to participate in the workshops. Initial contact focused on those already certified as EU Blue Schools [], given their established commitment to OL and prior engagement with marine education. This strategy ensured thematic alignment and facilitated implementation. Of the 15 schools that ultimately participated, all but one, Col·legi Sant Bonaventura (Artà), had been certified prior to the study []. Certification status was later considered in the analysis to assess its potential influence on students’ marine knowledge and perceptions.
The sampling strategy employed in this study was intentional and non-random, determined primarily by school availability and logistical feasibility during the proposed workshop periods. While all schools within the five target municipalities were invited, participation ultimately depended on logistical feasibility and school availability during the proposed time periods. The workshops were organized three months in advance, and selection was coordinated directly through the Balearic Network of Blue Schools. As coordinator of one of the largest Blue School networks in Europe, comprising over 100 affiliated schools [], the lead author was able to leverage established relationships to facilitate efficient and targeted communication with educators. The outreach was not random; rather, it prioritized schools that had previously demonstrated interest in OL and could accommodate the proposed workshop schedule.
This approach introduces potential sampling biases that must be acknowledged. First, the predominance of Blue Schools in the sample may result in overrepresentation of students with prior exposure to marine education, potentially inflating measures of marine knowledge and coastal identification compared to the general student population. Second, dependence on school availability may have excluded institutions with different demographic or educational profiles, limiting the representativeness of findings across socioeconomic strata or educational approaches. Third, the voluntary nature of participation may reflect self-selection bias, where schools and educators more inclined toward environmental education were more likely to engage. These limitations should be considered when interpreting results and generalizing findings beyond the study context.
In many cases, interest exceeded available capacity. This was attributed not only to the thematic appeal of the workshops, but also to their delivery model: rather than requiring schools to travel to Palma, as is typical for extracurricular educational activities in the Balearic Islands, the workshops were brought directly to each municipality. This place-based approach significantly lowered barriers to participation and increased perceived relevance among local educators.
Each day was dedicated to a single school, with between four and six one-hour sessions delivered throughout the day. The workshops targeted students aged 10 to 17, with flexibility to accommodate different educational levels. Inclusion was a core educational principle: students enrolled in adapted curriculum pathways, programs designed to ease academic demands and support students at risk of not completing compulsory education, as well as those in UEECO classrooms (special education units), also participated. Workshop content and explanations were adapted to suit varied learning needs and cognitive levels, ensuring broad accessibility and pedagogical alignment. The final sample comprised 645 students aged 10 to 17 across 11 schools.
The study was conducted in accordance with the Ethical Code for Educational Practice of the Educational Commission of the Government of the Balearic Islands (Competencies 1 and 2) [] ensuring respect for students’ dignity, data transparency, and wellbeing during all educational research activities. Data collection and processing complied fully with the General Data Protection Regulation (EU) 2016/679 (GDPR) [] and Spanish Organic Law 3/2018 on the Protection of Personal Data and Guarantee of Digital Rights (LOPDGDD) []. The questionnaire was provided to teachers, and teachers invested 1 to 2 sessions in class to collect data from participants. Data were collected, processed exclusively for scientific research purposes, stored securely, and retained only for the statutory limitation periods.
2.2. Instruments
(a) Questionnaire Design and Validation
Data were collected by the teachers through a structured questionnaire specifically designed by the research team to investigate students’ perceptions, emotional connections, and knowledge related to the marine environment. The questionnaire was developed through an iterative process involving experts in marine science education, biology, and geography to ensure content validity and coherence with the educational goals of the workshops. To establish the reliability and validity of the instrument, a pilot study was conducted during a fish-fair event held one week prior to the main data collection. Students from multiple age groups participated in the workshop and subsequently completed the survey, allowing for the assessment of item clarity, comprehensibility, and overall response difficulty. Pilot results informed refinements in question wording, response format, and thematic organization. Particular emphasis was placed on integrating multiple dimensions of OL that may influence students’ place identity, following the conceptual approach proposed by [] A full version of the questionnaire is available in Annex 1.
In addition to exploring place-based perceptions, the questionnaire was carefully aligned with international educational and sustainability frameworks. It aimed to minimally address the seven essential principles of OL, drawing on foundational contributions by Cava, 2005 [] and Schoedinger et al. 2005 []. Furthermore, the design considered connections with the OL Challenges and Outcomes framework, the UN Sustainable Development Goals (SDGs), and broader OL aspects promoted by global initiatives such as the UN Decade of Ocean Science for Sustainable Development [,,]. This multidimensional alignment was intended to ensure the questionnaire’s relevance and coherence within current international efforts to advance OL and sustainability education in line with the 2030 Agenda.
(b) Questionnaire Structure
The instrument was composed of six thematic sections, driven mostly from a pilot OL survey conducted in Catalonia in the educational sector, inspired by previous OL surveys [,,,,,]:
- b1. Self-identification of territoriality and personal information: this section was designed to explore how students perceive their place of residence in relation to the coast. Students were asked to indicate their gender, municipality of residence, and whether they considered it to be coastal or inland. They also provided information about their current grade level and school name.
- b2. Symbolic representation: These questions draw on established methodologies in tourism research, particularly the use of image-based preference tests to explore affective and motivational responses to landscapes []. These techniques aim to reveal the symbolic meanings and emotional associations that individuals attach to different environments, offering insights into how people perceive, idealize, or identify with landscape types. Students were shown a series of standardized images and asked two questions. First, they were asked to choose the image they liked the most. Second, they were asked to indicate in which landscape they would prefer to live. All images were generated using artificial intelligence to deliberately avoid depicting specific, recognizable locations in Mallorca. This approach was chosen to ensure neutrality, preventing students from being influenced by personal familiarity or associations with particular towns.
The first set of images depicted three symbolic coastal environments (see Figure 3), all featuring the sea but differing in development intensity and visual framing:
(Image A) A rural settlement with sea and mountains in the distance;
(Image B) Natural beach with light tourist use;
(Image C) A built-up coastal resort typical of tourism zones.

Figure 3.
Which picture do you like the most? AI-generated with ChatGPT-5, 2025 version. (A) rural settlement with sea and mountains in the distance. (B) natural beach with light tourist use. (C) built-up coastal resort typical of tourism zones.
The second set represented symbolic inland settlement types found across the island (see Figure 4):
(Image A) A typical mountain town in Mallorca;
(Image B) A typical port town;
(Image C) A typical rural town without coastal access.

Figure 4.
Which of the following towns would you choose to live in? AI-generated with ChatGPT-5, 2025 version. (A) A typical mountain town in Mallorca. (B) A typical port town. (C) A typical rural inland town without coastal access.
This two-part visual activity aimed to better understand how students relate emotionally and symbolically to different Mallorcan environments, beyond their own physical place of residence.
- b3. Emotional connection to the marine environment: Students reported their emotional responses toward the sea, choosing among a list of positive, neutral and negative feelings.
- b4. Experiential interaction: Students described the frequency of their visits to the coast and the activities they engaged in (e.g., leisure, fishing, or sport-related practices).
- b5. Communication and information sources: Students identified their main sources of communication and information about the sea (family, friends, school, internet, books, television).
- b6. Marine knowledge indicators: Two dimensions of marine knowledge were assessed.
- General OL was evaluated through students’ self-perceived knowledge, their level of agreement with key OL principles, and their perceptions of human–ocean interactions. This approach focused on subjective understandings aligned with the OL Framework, rather than factual recall, to capture how students internalize and relate to marine concepts.
- Local marine knowledge was measured through the recognition of culturally and environmentally significant elements of the Mallorcan marine environment. These included Posidonia oceanica (a key seagrass species), the traditional fishing boat (llaüt), and common fish species such as Coryphaena hippurus (llampuga) and Pagellus erythrinus (pagell). Other indicators of place-based familiarity included terms like embat (local sea breeze), rissaga (meteotsunami), albufera (coastal lagoon), and species of ecological importance such as the endangered bivalve nacra (Pinna nobilis). Additionally, elements of maritime craftsmanship, such as the role of the mestre d’aixa (master boatbuilder), and traditional small boats like the batel, were used to capture deeper layers of local marine heritage.
- The final version of the questionnaire is provided in the Appendix A.
2.3. Procedure
An immersive workshop for discovering both the deep sea and the similarities that can be found between marine and land environments [] was conducted during October and November 2024 (see Figure 5). Designed by the Institute of Marine Sciences (ICM-CSIC) and implemented in collaboration with the Balearic Network of Blue Schools, the workshop aimed to bring the ocean directly into the classroom, fostering emotional and cognitive engagement with the marine environment.
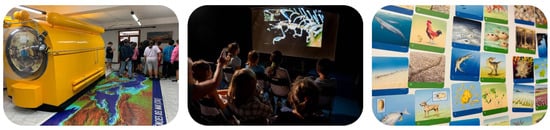
Figure 5.
Pictures taken during the workshops.
Through an experiential learning approach, students explored marine similarities with familiar terrestrial elements during the Land or Sea activities. Key ideas included comparing marine and terrestrial plant species (e.g., Posidonia oceanica meadows versus land prairies), illustrating similarities between ocean currents and atmospheric dynamics, or showing parallel geological and ecological processes as well as human impacts in both systems. In the second part of the workshop, students viewed real video footage from a submarine exploring the Menorca Channel, which introduced them to lesser-known but nearby marine ecosystems and underscored the importance of local oceanographic research. The workshop was specifically designed to awaken students’ “ocean awareness and knowledge” and “ocean consciousness” and to enhance their perception of the continuity between terrestrial and marine ecosystems, as well as to make the ocean more present and accessible through imagination and personal experiences in nature.
Following the completion of the workshop activities, students responded to the structured questionnaire in a classroom setting under teacher supervision. Participation was voluntary and anonymous, and data collection was conducted in compliance with ethical standards for educational research. Due to organizational constraints within the schools, only 11 of the 15 schools were able to complete the full questionnaire protocol. From the 940 collected questionnaires, a stratified subsample of 645 student responses was selected to ensure balanced representation across geographic location and educational level (see Table 1).

Table 1.
Distribution of Selected Student Questionnaires by School and Educational Level. The sample reflects the availability of data across participating schools. All secondary education levels (1r to 4t ESO) are represented, along with the final two years of primary education (5è and 6è). In addition, one vocational education and training (VET) group and one 1r de Batxillerat class (first year of preparatory education for university) also took part in the workshop. Notably, 1r and 3r ESO had the highest participation, aligning with curriculum stages where biology and environmental topics are given greater emphasis.
2.4. Data Analysis
Data analysis was structured according to the study’s three main objectives:
- (a)
- Descriptive and comparative analysis
Following similar approaches in studies about spatial perceptions of coastal proximity [], a visual exploratory analysis was conducted to compare students’ objective coastal proximity with their self-perceived coastality (coastal vs. inland).
The analysis was implemented through the combination the GIS Software [,] ArcGIS Pro v3.6 [], and interactive dashboards created with Power BI [], allowing for a visual examination of:
- The distribution of objective versus perceived coastality,
- Potential mismatches between physical proximity and symbolic identification,
- Differences by municipality and school center.
Students’ symbolic image selections (coastal, rural, or mountainous) were also analyzed descriptively to explore alternative representations of territorial identity. The aim of this visual analysis was to assess whether the hypothesized divergence between real and perceived coastality (H1) was observable in the data patterns.
- (b)
- Spatial Analysis: Coastality Gap Index
To spatially analyze the alignment (or mismatch) between symbolic coastal identification and physical proximity to the sea, we developed the Coastality Gap Index (CGI), a raster-based indicator that compares students’ self-reported inland identity with the geographic distance of their residential nuclei to the coastline.
The index was calculated using the following steps in ArcGIS Pro:
- Distance to Coastline: A Euclidean distance raster was generated from the official coastline of Mallorca using a 250 m resolution. The values were normalized to a 0–1 scale, with 1 representing the point farthest from the sea on the island.
- Symbolic Inlandness: For each populated nucleus with survey data, the percentage of students who identified their municipality as “inland” was calculated and rasterised using the same 1 km grid.
- Index Formula: The Coastality Gap Index was derived by subtracting the normalized distance from the symbolic inlandness value:
- CGIi = Coastality Gap Index for location i (dimensionless, range: −1 to +1)
- P.inlandi = Proportion of students in location i who self-identify as “inland” (range: 0 to 1, where 0 = all students identify as coastal, 1 = all identify as inland)
- D.normi = Normalized Euclidean distance from location i to the nearest coastline (range: 0 to 1, where 0 = at the coast, 1 = maximum inland distance on the island, approximately 25 km).
The normalized distance (D_norm_i) employs Euclidean distance calculated using ArcGIS Pro’s Euclidean Distance tool at 250 m resolution. This measures straight-line distance across a planar surface from each location to the nearest coastline. The maximum distance point was identified near Sineu (approximately 25 km from the coast), serving as the normalization denominator.
This operation yielded a continuous raster where
- Positive values indicate areas where inland identification exceeds expectations based on distance.
- Negative values represent zones where students feel coastal despite being relatively inland.
- Values near zero suggest symbolic–spatial alignment.
- 4.
- Classification Thresholds and Justification: The CGI was grouped into three interpretative zones:
- Symbolically coastal (Gap Index < −0.05)
- Spatial-symbolic alignment (−0.05 to +0.20)
- Inland identification gap (>+0.20)
This index enabled the creation of a spatial typology that supports the broader analysis of perceived coastality and highlights symbolic inland “hotspots” that may be overlooked by traditional buffer-based coastal definitions.
- (c)
- Cluster analysis
To complement the CGI and further explore underlying perceptual patterns among students, a K-means clustering procedure was employed to identify distinct student profiles based on key variables: emotional connection to the ocean, frequency of sea visits, engagement in marine activities, OL at both global and local levels, and knowledge of local marine species. K-means clustering was selected based on three criteria: (1) computational efficiency with our sample size (n = 645), (2) ability to produce interpretable profiles suitable for educational stakeholders, and (3) successful applications in previous environmental perception studies. The clustering was performed using ArcGIS Pro [] which also facilitated the spatial visualization of perceptual typologies across municipalities.
Before clustering, continuous variables were categorized to reduce noise and facilitate the identification of more distinct perceptual profiles (Table 2). This categorization approach is common in behavioral and environmental studies to quantify self-reported experiences and exposures, allowing for a more nuanced analysis of experiential and social dimensions [,].
Table 2.
Variables included in the K-means clustering model: descriptions and coding schemes for emotional, experiential, and cognitive dimensions.
Assigning ordinal values to categorical data enables the integration of experiential measures into statistical models. For instance, coding the frequency of coastal visits as an ordinal variable aligns with established methodologies in studies exploring the impact of nature exposure on wellbeing. Similarly, ordinal scales are frequently employed to assess emotional connection to nature [,] and the extent of social discussions regarding environmental issues []. Meanwhile, continuous variables such as the OL score provide standardized metrics for assessing knowledge, aligning with approaches in OL research [].
The optimal number of clusters was determined using the elbow method [], ensuring both statistical robustness and interpretability. Each cluster was then analyzed descriptively to characterize dominant emotional, experiential, and cognitive features.
To evaluate the robustness of the clustering solution, a cluster-quality indicator was computed. Specifically, the within-cluster sum of squares (WCSS) was examined to assess intra-cluster homogeneity. The WCSS curve revealed an elbow at k = 5, beyond which additional clusters yielded only marginal reductions in variance. This inflection point supported the selection of a five-cluster solution as the optimal balance between explanatory power and parsimony. Each cluster was then analyzed descriptively to characterize dominant emotional, experiential, and cognitive features.
3. Results
This section presents the findings in alignment with the three core objectives of the study: (1) to identify patterns of perceived coastality in relation to actual geographic location, (2) to analyze the Coastality Gap Index as a spatial measure of symbolic-physical mismatch, and (3) to explore factors influencing perception and knowledge through cluster analysis. The results are organized to guide the reader from students’ symbolic identification with the ocean, through their cognitive understanding of marine topics, to a data-driven interpretation of the variables shaping these patterns.
3.1. Visual Exploration of Real vs. Perceived Coastality
3.1.1. Coastal-Inland Divide
The results reveal substantial misalignment between students’ symbolic self-perceptions and objective geographic realities. Even in municipalities with direct coastal access, many students identified their environment as “inland.” The most striking disparities occurred in Artà (54.65% inland identification despite 12.8 km coastal proximity), Manacor (75.22% inland despite 11.8 km proximity), and Capdepera (27.38% inland despite 2.6 km proximity). In contrast, Pollença showed strong coastal identification (88% coastal, only 8% inland) despite comparable distance to the coast as Manacor. As expected, Inca, the only municipality without direct coastal access (23.4 km inland), recorded the highest inland perception (89.13%). Complete municipal-level data, including intermediate categories (“coastal and inland,” “not specified”) and sample sizes, are presented in Table 3.
Table 3.
Student Perceptions of coastal or inland identity by municipality compared to real distance to the coast (in km). Survey results from towns with between 20 and 172 student respondents. The table illustrates the symbolic coastal–inland divide, highlighting discrepancies between student perceptions and the actual physical distance of each municipality to the coast.
Among smaller population centers (n < 20 students), clear patterns emerged: port towns and coastal tourism hubs (Port d’Alcúdia, Portocristo, Portocolom, Cala Mesquida, Can Picafort) showed 100% coastal identification, while inland municipalities without coastal access (Sineu, Lloseta, Campanet, Selva) exhibited 100% inland identification. However, municipalities with coastlines but urban centers located 5–10 km inland (Muro, Son Servera) produced mixed results, underscoring coastality as a perceived rather than strictly spatial concept. Notably, even port settlements like Cala Rajada and Colònia de Sant Pere recorded 6.5% and 10% inland identification, respectively, suggesting that symbolic detachment can occur even in directly coastal locations (see Figure 6).
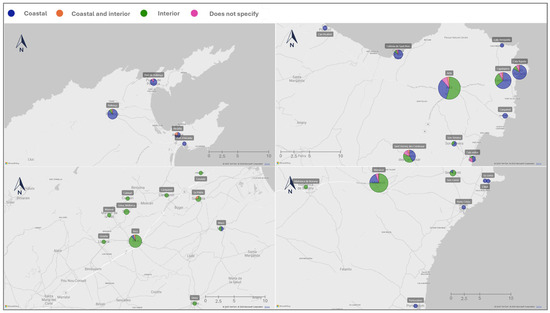
Figure 6.
Self-perceived coastality by population center. Bubble size reflects the number of student respondents in each town. color coding indicates the dominant self-identification: blue for “coastal”, green for “inland”, orange for mixed responses, and pink for “does not specify”.
3.1.2. Symbolic Landscape Preferences: Image and Place Identity
When asked “Which image do you like the most?”, Image B (natural beach with light tourism) dominated across the sample (68% overall), with modest variation by perceived coastality: 69.6% among coastal-identified students versus 66.4% among inland-identified students. Inland students showed slightly stronger preference for Image C (built coastal resort: 27.0% vs. 22.1%), suggesting urban-tourism imaginaries may hold greater aspirational appeal for those without direct coastal access. Image A (rural settlement with distant sea/mountains) received the fewest selections across all groups.
Municipal-level patterns reinforced these trends. Colònia de Sant Pere exhibited the strongest natural coast alignment (82.4% selecting Image B), while Inca students showed the lowest B preference and highest C preference, reflecting symbolic projection toward coastal leisure from an inland position. School-level analysis (detailed in Figure 7) revealed similar patterns, with IES Capdepera recording the highest Image C selection (35.7%), suggesting more tourism-influenced coastal symbolism.
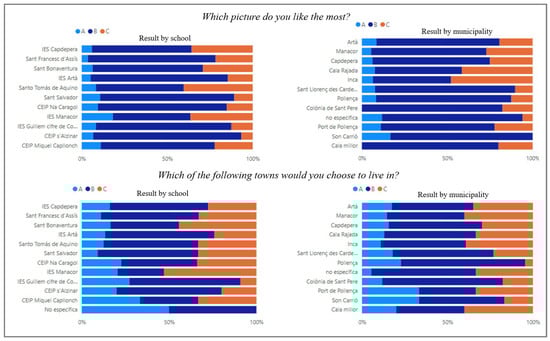
Figure 7.
Results of the image selection by school (left side) and municipality (right side).
For residential preference (“In which village would you prefer to live?”), port villages (Option B) were most popular across all groups (>50% in each coastality category). However, inland students showed stronger support for inland villages (31.25%), while mountain villages attracted least support overall (14.35%). Geographic-symbolic alignment was evident in Pollença and Port de Pollença students’ preference for mountain villages (22.73% and 33%, respectively), reflecting the municipalities’ location in the Serra de Tramuntana. Conversely, Inca students favored inland villages (39.1%) with minimal coastal or mountain attachment. School-level patterns largely mirrored municipal trends, with notable exceptions such as IES Manacor, where 52.9% preferred inland villages despite coastal municipal access, pointing to potential symbolic maritime disconnection.
3.2. Results of the Index Gap
The Coastality Gap Index revealed substantial spatial mismatches between symbolic and geographic coastality across 29 population centers. Index values ranged from −0.07 to +0.72 (mean = 0.23, SD = 0.22), reflecting diverse patterns of coastal-inland identification relative to actual distance.
Three interpretative zones emerged:
- Symbolically coastal (Index < −0.05): This category includes only Pollença (−0.07) where students expressed a strong symbolic attachment to the ocean despite moderate inland distances. These cases suggest that local culture, traditions, or family engagement with the sea may shape symbolic identity more strongly than geography.
- Symbolic–geographic alignment (−0.05 to +0.20): The majority of centers fell into this zone, showing consistency between perceived inlandness and actual distance to the coast. Examples include port areas such as Portocolom (0.00), Port de Pollença (0.00) and Cala Rajada (0.09), and presents interesting results in Muro (0.17) and Sant Llorenç (0.15). These locations typically lie within 11 km of the coastline and show moderate levels of inland self-identification.
- Coastality gap zone (Index > +0.20): This group reveals a notable divergence between physical proximity and symbolic perception. Despite being only 6–10 km from the coast, students in centers such as Son Macià (0.72), Sa Pobla (0.67) and Son Carrió (0.64), reported high rates of inland self-identification. The highest value, found in Son Macià, suggests a symbolic detachment from the marine environment even in relatively accessible coastal areas.
A complete list of all population centers and their corresponding coastality gap values is provided in Table 4. The results indicate that geographic proximity alone does not guarantee symbolic or emotional identification with the sea. This supports the study’s first hypothesis and raises important questions for OL strategies that assume linear relationships between physical space and coastal identity.
Table 4.
Island gap index results.
Mapping the index (see Figure 8) reveals a pattern of symbolic inland hotspots in inland and transitional areas, particularly in central and northern Mallorca. Notably, big population centers like Artà and Manacor exhibit high coastality gap values (0.34 and 0.41, respectively), despite being within 11 km of the coastline.
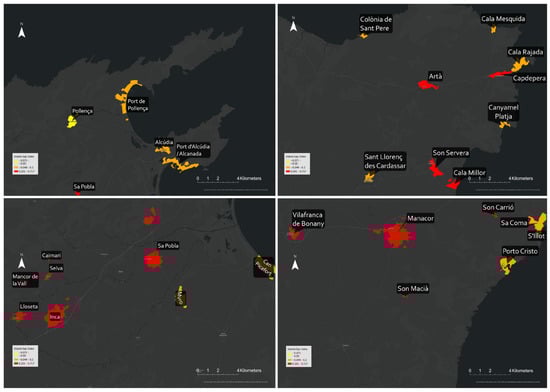
Figure 8.
Mapping of the Coastality Gap Index in the studied nuclei.
The Coastality Gap Index thus serves as a complementary tool to student self-reports, offering a spatialized and interpretable measure of symbolic detachment from the sea. Rather than relying solely on administrative boundaries or fixed-distance buffers, the index captures mismatches between objective proximity and subjective coastal identity. Crucially, it does not attempt to impose a rigid or universal definition of what constitutes a “coastal area.” Instead, it highlights where perceived coastality lags behind geographic opportunity, enabling policymakers and educators to identify target areas for OL or Blue School interventions.
3.3. Clustering
K-means clustering identified five distinct perceptual profiles (n = 645 students). The five-cluster solution was selected based on the elbow method, where within-cluster sum of squares (WCSS) showed diminishing returns beyond k = 5. These profiles range from highly integrated marine identities to students with minimal emotional or cognitive attachment to the ocean. Together, they offer a nuanced typology that supports the design of targeted OL interventions that go beyond spatial proximity or school location (see Figure 9).
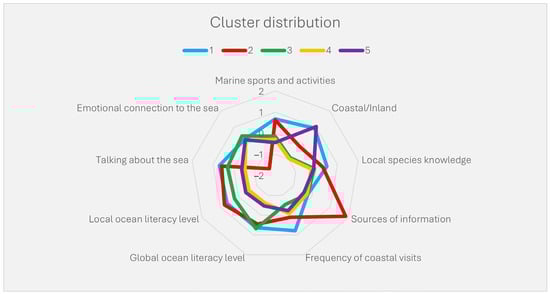
Figure 9.
Student profiles derived from cluster analysis: municipality, sport and activities by the sea, knowledge, sources of information, communication, and emotions.
- Cluster 1—Connected Coastal Engagers: This group represents students who self-identify as coastal (0.92) and exhibit strong integration of marine experience and knowledge. They frequently visit the sea (0.78), engage in marine sports (0.67), and demonstrate high global (0.63) and local (0.63) OL. They actively talk about the sea (0.68), express a positive emotional connection (0.24), and have above-average knowledge of local marine species (0.48). This profile reflects a balanced and well-developed marine identity.
- Cluster 2—Informed but Emotionally Disconnected: These students tend to perceive their environment as inland (−0.20) but demonstrate high local OL (0.77) and moderate global OL (0.45). Despite marine sports engagement (0.63) and low frequency of sea visits (0.11), they access a wide range of information sources (1.85) and frequently talk about the sea (0.57). However, their emotional connection is strongly negative (−1.57), pointing to a disconnect between knowledge and emotional experience.
- Cluster 3—Curious Distant Observers: Students in this cluster perceive their municipality as more inland (−0.89) and report low frequency of coastal visits (−0.54). They engage little in marine sports (−0.13) and have limited species knowledge (−0.12). Despite these limitations, they show moderately high global OL (0.68), but only low local OL (0.21). Their emotional connection is slightly positive (0.44), and their conversations about the sea are infrequent (0.29). This group demonstrates cognitive potential but remains physically and socially distant from the sea.
- Cluster 4—Disconnected and Unaware: These students strongly perceive their region as inland (−0.96) and exhibit the lowest scores in nearly every dimension. They rarely visit the sea (−0.07), do not engage in marine sports (−0.28), and show low global (−0.60) and local (−0.57) OL. Knowledge of species is minimal (−0.26), discussions about the sea are rare (−0.54), and they consult very few sources (−0.25). Their emotional connection is neutral (0.1613), reinforcing a general detachment.
- Cluster 5—Passive Coastal Residents: This group perceives their municipality as coastal (1.03) but shows low levels of marine activity and knowledge. Their participation in marine sports is low (−0.44), sea visits are infrequent (−0.22), and they show limited global (−0.45) and local (−0.39) OL. They rarely discuss marine topics (−0.38), use few information sources (−0.41), and their emotional connection is only slightly positive (0.20). Their perceived coastal identity is not reflected in active engagement.
The distribution of student profiles across the eight municipalities revealed the following patterns: (Figure 10).
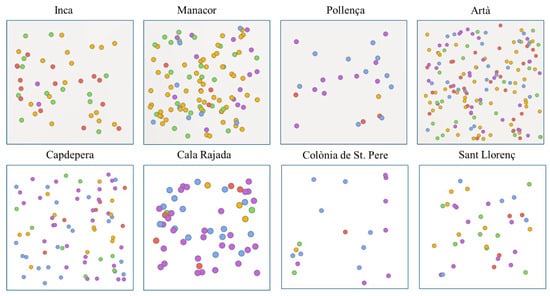
Figure 10.
Student profiles distribution in eight towns. In blue, Cluster 1; in red, Cluster 2; in green, Cluster 3; in yellow, Cluster 4; in purple, Cluster 5.
- Pollença stands out as the clearest example of active coastal engagement, with most students falling into Cluster 1 (Connected Coastal Engagers) and Cluster 5 (Passive Coastal Residents). This distribution reflects a population that predominantly identifies as coastal, where a significant portion not only lives near the sea but also integrates marine experiences, sports, and knowledge into their identity. The presence of Cluster 5 suggests that while coastal identity is strong, it does not always translate into active participation. A similar duality appears in Cala Rajada, Capdepera, and Colònia de Sant Pere. These municipalities show a dominant presence of Cluster 5, indicating students who perceive themselves as coastal but lack strong emotional connection, knowledge, or regular engagement with the sea. Cluster 1 also appears in each of these locations, though to a lesser extent than in Pollença, suggesting that while some students are actively involved, the broader trend is one of passive affiliation with the marine environment. This pattern points to a coastal but disengaged identity, where proximity to the sea does not necessarily foster deeper involvement.
- Artà and Manacor share a different profile: one of diverse and fragmented engagement. Both municipalities display a wide distribution across all five clusters, with no single dominant group. In Artà, Cluster 4 (Disconnected and Unaware) is the most prevalent, while Clusters 1, 2, and 3 also have strong representation. Manacor shows a similar spread, with moderate presence across Clusters 2, 3, 4, and 5. This distribution indicates communities where students’ relationships with the sea are highly variable, some informed, others curious but distant, and many with low awareness or connection, reflecting internal heterogeneity in marine identity and literacy.
- Inca and Sant Llorenç des Cardessar represent a third group, characterized by inland-informed but emotionally disconnected profiles. In both cases, Cluster 1 is nearly absent, while Clusters 2 (Informed but Emotionally Disconnected), 3 (Curious Distant Observers), and 4 dominate. Students in these areas may access information about the sea and demonstrate some cognitive understanding especially global and local OL, but lack direct experiences, emotional resonance, or regular interaction with marine environments. These patterns reflect a geographic and symbolic distance from the sea, where knowledge exists in the absence of personal or cultural connection.
4. Discussion
4.1. Symbolic Detachment in Geographically Coastal Areas
The Coastality Gap Index revealed that 14 of the 29 population centers analyzed, nearly half, were perceived as inland by students, despite being geographically classified as coastal. This suggests a form of symbolic detachment from the ocean that conventional spatial definitions, such as the EU’s 20-km coastal belt, may not fully reflect. Such inland-oriented perceptions were particularly evident in towns like Sa Pobla, Manacor, and Artà, where the sea is geographically near but appears emotionally and cognitively distant in the minds of local youth.
This perceptual dissonance supports Tuan’s [] distinction between space and place, wherein a location becomes meaningful, transformed into place, through lived experience, familiarity, and emotional connection.
4.2. Youth Profiles Show Diverse Relationships with the Sea
The five perceptual profiles identified through cluster analysis reflect a broad spectrum of youth–sea relationships that go beyond physical proximity. Some students (Cluster 1) show strong marine identity, emotional attachment, and regular sea engagement. Others (Cluster 2) demonstrate cognitive awareness but emotional distance, while students in Cluster 4 are disengaged on all levels. Notably, Cluster 5 includes students living near the sea but with limited participation and symbolic disconnection, showing that geography alone is not a predictor of coastal identity.
These findings align with research suggesting that place identity involves an interplay of cognitive, affective, and experiential dimensions []. They also echo Salazar et al. [] who argue that youth participation in marine activities does not automatically lead to stronger emotional connection or ecological commitment. Without contextual understanding or reflective engagement, such experiences may remain superficial, limiting their impact on identity formation. This complexity reinforces the need to interpret marine identity as a layered construct shaped not just by behavior, but by emotion, meaning, and local context.
4.3. Territorial Patterns and Local Contrasts
The spatial distribution of perceptual profiles reveals clear territorial patterns. While coastal municipalities like Pollença and Artà display a mix of engaged (Cluster 1) and passive (Cluster 5) students, others such as Inca and Sant Llorenç show a predominance of disconnected or uninvolved profiles (Clusters 3 and 4). These contrasts suggest that coastality is not merely a function of physical location but emerges through layered socio-spatial dynamics.
This aligns with Lefebvre’s theory of the production of space, where symbolic and lived experiences shape how space is perceived and inhabited []. The Coastality Gap Index complements this perspective by offering a spatially explicit tool to detect mismatches between geographic and symbolic coastality, highlighting areas where intervention may be most needed.
4.4. Implications for Educational and Policy Strategies
These findings call for educational approaches that go beyond simple proximity to the sea. Towns identified by the Coastality Gap Index as symbolically inland, despite being physically coastal, may require targeted strategies to re-establish emotional and experiential ties with the marine environment. Research in environmental education emphasizes the importance of embodied, place-based experiences in fostering environmental identity and stewardship [].
The cluster typology can help educators adapt content and methods. For example, emotionally disconnected students (Cluster 2) may benefit from reflective storytelling or cultural-historical explorations of the ocean while students with low experiential exposure (Cluster 4) may require direct, sensory engagement to build familiarity and comfort.
Beyond educational applications, the Coastality Gap Index offers potential as a diagnostic tool for broader public policy domains. In maritime spatial planning, the CGI could inform more nuanced coastal zone definitions that account for symbolic as well as physical geography, identifying where to prioritize marine infrastructure or integrate coastal considerations into land-use decisions []. For environmental awareness initiatives, the index provides a targeting mechanism to focus conservation outreach and OL programs where symbolic disconnection is greatest [,]. In Blue Economy development, CGI-based assessments could identify communities where marine economic initiatives may face resistance due to weak symbolic coastal identity, enabling early investment in community consultation and capacity building. As Córdoba Hernández and Camerin [] emphasize, sustainable territorial planning requires not only technical expertise but also the development of comprehensive sustainability competencies among stakeholders, including systems thinking and participatory governance skills. The CGI thus contributes to positioning territorial and marine planning as both a technical process and a social practice that fosters a culture of sustainability.
4.5. Methodological Limitations and Future Directions
Several methodological constraints should be acknowledged. The sampling strategy was intentional and non-random, dependent on school availability and Blue School network participation, potentially limiting representativeness and introducing bias toward more marine-engaged institutions []. All data were self-reported, which may introduce social desirability bias, particularly given the marine education context of the workshops (as noted in studies of ocean connectedness and identity []). The cross-sectional design precludes analysis of how perceived coastality develops over time or responds to interventions; longitudinal research in marine identity contexts [] underscores the value of tracking identity trajectories. Future research would benefit from random or stratified sampling designs to enhance generalizability, triangulation of self-reports with behavioral or observational data to reduce measurement error, longitudinal studies to assess intervention effectiveness, and inter-island or cross-regional comparative research to test the transferability of the perceived coastality construct and CGI framework to other coastal and insular contexts. Despite these limitations, the study makes valuable contributions by operationalizing perceived coastality and demonstrating that symbolic dimensions of marine identity are measurable and relevant [,,].
5. Conclusions
This study proposes perceived coastality as a construct that captures how youth relate to the ocean emotionally, cognitively, and experientially, independent of physical proximity. Using data from 645 students in Mallorca, we identified five perceptual profiles that reflect varied configurations of knowledge, attachment, and coastal identity.
The Coastality Gap Index (CGI) reveals that symbolic relationships to the sea do not uniformly align with geography: several coastal population centers exhibit inland-oriented perceptions. This finding challenges conventional spatial definitions of “coastal areas” and highlights the importance of incorporating subjective dimensions into marine education and policy planning.
- Scientific contributions
- New indicator: The CGI provides a measurable way to detect divergences between geographical location and symbolic identification with the sea.
- New typology: The five-cluster model introduces perceptual categories that move beyond binary coastal/inland distinctions.
- New integration: The combination of spatial analysis with perceptual profiling offers a scalable method for linking subjective identity to territorial patterns.
Further work should examine how local physical environments, such as landscape features, sea visibility, accessibility, infrastructure, and coastal conditions, shape marine identity around schools. GIS-based buffer analyses can help determine whether proximity to ports, tourism pressure, or degraded waterfronts correspond to lower engagement. Such spatially explicit research would identify the environmental drivers that enable or constrain Blue Education and support more equitable, place-responsive designs for both coastal and inland communities.
Author Contributions
Conceptualization, C.E.-B.; methodology, C.E.-B., M.R.-P., B.V.-S., J.S., and J.M.G.; software, C.E.-B.; validation, C.E.-B. and M.R.-P.; formal analysis, C.E.-B.; investigation, C.E.-B.; resources, M.R.-P. and J.M.G.; data curation, C.E.-B., M.R.-P., B.V.-S., J.S., and J.M.G.; writing—original draft preparation, C.E.-B.; writing—review and editing, M.R.-P., B.V.-S., J.S., and J.M.G.; visualization, C.E.-B.; supervision, M.R.-P. and J.M.G.; project administration, C.E.-B. All authors have read and agreed to the published version of the manuscript.
Funding
This research received no external funding. The APC was funded by the authors.
Institutional Review Board Statement
Ethical review and approval were waived for this study in accordance with the Ethical Code for Educational Practice of the Educational Commission of the Government of the Balearic Islands [], which regulates research activities in formal educational contexts. The study did not involve any medical or psychological intervention, experimental manipulation, or the collection of identifiable human data that would require review by an ethics committee. All procedures complied with the ethical standards of the institutional and national research committees and with the Declaration of Helsinki (revised 2013).
Informed Consent Statement
Informed consent for participation was obtained from the participating schools and teachers prior to data collection, following institutional educational research procedures. Student participation was voluntary, anonymous, and conducted within ordinary classroom activities. No personal, biometric, or sensitive information was gathered, and all data were analyzed in aggregate form. According to Regulation (EU) 2016/679 (GDPR), the Spanish Organic Law 3/2018 on Data Protection and Guarantee of Digital Rights (LOPDGDD), and the Balearic Educational Ethical Code, formal ethical committee approval was not required, as the research did not involve any processing of identifiable human data.
Data Availability Statement
The data presented in this study are available on request from the corresponding author. The data are not publicly available due to privacy and ethical restrictions.
Acknowledgments
The authors wish to thank the teachers and students who participated in the study, as well as the SharkMed team for their collaboration and support during the workshops. During the preparation of this manuscript, the authors used ChatGPT (OpenAI, GPT-5, 2025 version) to create the pictures to be shown to students during the workshops. The authors have reviewed and edited the output and take full responsibility for the content of this publication.
Conflicts of Interest
The authors declare no conflicts of interest.
Abbreviations
The following abbreviations are used in this manuscript:
| OL | Ocean Literacy |
| CGI | Coastality Gap Index |
| GIS | Geographic Information System |
| EEZ | Exclusive Economic Zone |
| UNCLOS | United Nations Convention on the Law of the Sea |
| SDG(s) | Sustainable Development Goal(s) |
| OLP | Ocean Literacy Principles (si lo mencionas explícitamente) |
| FAO | Food and Agriculture Organization |
| EU | European Union |
| VET | Vocational Education and Training |
| GDPR | General Data Protection Regulation |
| LOPDGDD | Ley Orgánica de Protección de Datos y Garantía de los Derechos Digitales |
| HE | Higher Education |
Appendix A
Appendix A shows the questionnaire that was designed by the team and distributed by teachers to students during class:
ASSESSMENT OF THE MARINE FORESTS AND SUBMARINE WORKSHOPS: STUDENT SURVEY
(Mark with an X, circle, or underline the chosen answer, or write in the space provided.)
PROFILE
- 1.
- Gender☐ Female☐ Male☐ Non-binary☐ Prefer not to say
- 2.
- Municipality (town/city) where you live:____________________________________________________________________________________________________________________
- 3.
- Would you describe your area as…☐ Coastal☐ Inland
- 4.
- What grade are you in?☐ 5th Primary☐ 6th Primary☐ 1st ESO☐ 2nd ESO☐ 3rd ESO☐ 4th ESO☐ Other: ________________________________
- 5.
- Which school do you attend? _________________________________
- 6.
- Write the first three words that come to mind when you think of the sea:____________________________________________________________________________________________________________________________________________________________________________________________________________________________________________________________________________________________________________________________________________________________
- 7.
- Which image do you like the most? (see images on the table)A ☐ B ☐ C ☐
- 8.
- Which of the following towns in Mallorca would you choose to live in?A ☐ B ☐ C ☐
- 9.
- How would you rate your knowledge about the following?(Mark with a cross: 1 = I know almost nothing, 5 = I know a lot)
- The ocean: ☐1 ☐2 ☐3 ☐4 ☐5
- Climate change: ☐1 ☐2 ☐3 ☐4 ☐5
- Marine conservation: ☐1 ☐2 ☐3 ☐4 ☐5
- Currents and winds: ☐1 ☐2 ☐3 ☐4 ☐5
- Dune systems: ☐1 ☐2 ☐3 ☐4 ☐5
- Ecosystem services: ☐1 ☐2 ☐3 ☐4 ☐5
- Eutrophication: ☐1 ☐2 ☐3 ☐4 ☐5
- Freshwater systems: ☐1 ☐2 ☐3 ☐4 ☐5
- The Balearic Sea: ☐1 ☐2 ☐3 ☐4 ☐5
- Marine biodiversity: ☐1 ☐2 ☐3 ☐4 ☐5
- Marine pollution: ☐1 ☐2 ☐3 ☐4 ☐5
- Blue carbon: ☐1 ☐2 ☐3 ☐4 ☐5
- Carbon sinks: ☐1 ☐2 ☐3 ☐4 ☐5
- One Health: ☐1 ☐2 ☐3 ☐4 ☐5
- Blue economy: ☐1 ☐2 ☐3 ☐4 ☐5
- Streams: ☐1 ☐2 ☐3 ☐4 ☐5
- 10.
- Do you know the following words?☐ Llaüt☐ Embat☐ Albufera☐ Mestre d’aixa☐ Posidonia☐ Rissaga☐ Batel☐ Llampuga☐ Nacra☐ Pagell
- 11.
- Read the following statements and indicate your level of agreement:(1 = disagree, 2 = neutral, 3 = agree)
- The Earth has a large ocean with varied characteristics. ☐1 ☐2 ☐3
- The ocean and its life shape the Earth’s properties. ☐1 ☐2 ☐3
- The ocean has a strong influence on weather and climate. ☐1 ☐2 ☐3
- The ocean made Earth habitable. ☐1 ☐2 ☐3
- The ocean supports high biodiversity and ecosystems. ☐1 ☐2 ☐3
- The ocean and humanity are inextricably connected. ☐1 ☐2 ☐3
- The ocean remains largely unexplored. ☐1 ☐2 ☐3
- Protecting the ocean requires studying and understanding it. ☐1 ☐2 ☐3
- The sea influences my life. ☐1 ☐2 ☐3
- My daily actions affect the sea, even if I live inland. ☐1 ☐2 ☐3
- If everyone made small changes to help the ocean/environment, it would have global effects. ☐1 ☐2 ☐3
- I miss the sea when I haven’t been there for a long time. ☐1 ☐2 ☐3
- There is a special place for me on the coast or at sea. ☐1 ☐2 ☐3
- I enjoy going to coastal areas/the sea. ☐1 ☐2 ☐3
- In general, people do not know enough about marine ecosystems in Mallorca. ☐1 ☐2 ☐3
- 12.
- What do you usually feel when you go to the sea? (Select up to 5)☐ Worry☐ Wonder☐ Curiosity☐ Calm/Relaxation☐ Happiness☐ Joy☐ Shame☐ Anger☐ Anxiety☐ Motivation☐ Guilt☐ Fear☐ Enthusiasm☐ Surprise☐ Fulfillment☐ Boredom☐ Sadness☐ Insecurity☐ Confidence☐ Confusion☐ Loneliness☐ Indifference☐ Inspiration☐ Connection with nature☐ Connection with myself☐ Other: ___________________
- 13.
- How often do you visit the sea or coastal areas in Mallorca?☐ Every day☐ Once a week☐ Every 15 days☐ Once a month☐ During holidays (especially summer)☐ Weekends in general☐ Weekends and holidays☐ Almost never☐ Never
- 14.
- Can you name at least five marine species you can see on the coasts of Mallorca?(Avoid generic names like “fish”; if unsure, give as much detail as possible.)1. __________ 2. __________ 3. __________ 4. __________ 5. __________
- 15.
- If you need to look up information about the sea, which source would you prefer?☐ Books and magazines☐ Internet search☐ Social media☐ Documentaries and films☐ Personal experience☐ Ask experts☐ Ask family or teachers☐ Talks and workshops☐ Other: _____________________________
- 16.
- Do you usually talk about the sea with other people? If yes, with whom?☐ Family☐ Friends☐ Teachers☐ Neighbors☐ I don’t usually talk about the sea☐ I post on social media☐ Other: _____________________________
- 17.
- Do you practice any sea-related sport? If yes, which?☐ Snorkeling☐ Swimming☐ Surf/Windsurf☐ Paddleboarding☐ Kayaking☐ Rowing☐ Sailing☐ Scuba diving☐ I do not practice sea sports☐ Other: _____________________________
- 18.
- What other activities do you usually do at the sea/beach? (e.g., photography, family picnic, etc.)________________________________________________________________________________________________________________________________________________________________________________________________________________________________________
QUESTIONS ABOUT THE MARINE FORESTS WORKSHOP
Rate the following aspects of the workshop from 1 to 5 (1 = disliked it a lot; 5 = loved it):
- Duration: ☐1 ☐2 ☐3 ☐4 ☐5
- Materials used: ☐1 ☐2 ☐3 ☐4 ☐5
- Explanations: ☐1 ☐2 ☐3 ☐4 ☐5
- Interesting: ☐1 ☐2 ☐3 ☐4 ☐5
- Surprising: ☐1 ☐2 ☐3 ☐4 ☐5
- Boring: ☐1 ☐2 ☐3 ☐4 ☐5
- Repetitive: ☐1 ☐2 ☐3 ☐4 ☐5
- Useful for learning new things: ☐1 ☐2 ☐3 ☐4 ☐5
- Would recommend it: ☐1 ☐2 ☐3 ☐4 ☐5
What is one thing you learned?
____________________________________________________________________________________________________________________
What did you like most?
____________________________________________________________________________________________________________________
What would you improve?
____________________________________________________________________________________________________________________
Before the workshop, did you know that… ? (Please answer honestly.)
- There are forests in the sea. ☐ Yes ☐ No
- There are many similarities between marine and terrestrial forests. ☐ Yes ☐ No
- Most marine forests are composed of animals. ☐ Yes ☐ No
- There is so much life in underwater darkness. ☐ Yes ☐ No
- Corals and gorgonians are animals. ☐ Yes ☐ No
- Posidonia is a plant, not an algae. ☐ Yes ☐ No
- Marine forests act as nurseries for commercially valuable species. ☐ Yes ☐ No
- Some animals live attached to the seafloor. ☐ Yes ☐ No
If you have any questions or comments after the workshop, write them here:
____________________________________________________________________________________________________________________
____________________________________________________________________________________________________________________
QUESTIONS ABOUT THE SUBMARINE WORKSHOP
Rate the following aspects of the workshop from 1 to 5 (1 = disliked it a lot; 5 = loved it):
- Duration: ☐1 ☐2 ☐3 ☐4 ☐5
- Materials used: ☐1 ☐2 ☐3 ☐4 ☐5
- Explanations: ☐1 ☐2 ☐3 ☐4 ☐5
- Interesting: ☐1 ☐2 ☐3 ☐4 ☐5
- Surprising: ☐1 ☐2 ☐3 ☐4 ☐5
- Boring: ☐1 ☐2 ☐3 ☐4 ☐5
- Repetitive: ☐1 ☐2 ☐3 ☐4 ☐5
- Useful for learning new things: ☐1 ☐2 ☐3 ☐4 ☐5
- Would recommend it: ☐1 ☐2 ☐3 ☐4 ☐5
What is one thing you learned?
____________________________________________________________________________________________________________________
What did you like most?
____________________________________________________________________________________________________________________
What would you improve?
____________________________________________________________________________________________________________________
Before the workshop, did you know that… ? (Please answer honestly.)
- Thanks to technological advances, there are now less harmful ways to study the ocean. ☐ Yes ☐ No
- There are special robots for exploring the sea. ☐ Yes ☐ No
- Seawater contains microscopic life that appears as “marine snow.” ☐ Yes ☐ No
- Teamwork is essential to study the sea well. ☐ Yes ☐ No
- There is high biodiversity in the Balearic Sea. ☐ Yes ☐ No
- Some algae look like rocks (grapissar). ☐ Yes ☐ No
- Did you know about trawling? ☐ Yes ☐ No
- Marine forests are seriously threatened by trawling. ☐ Yes ☐ No
After completing these workshops, do you think…
- When you return to the water, will you notice more than before? ☐ Yes, a lot ☐ Yes, a little ☐ No
- Will you see the sea differently? ☐ Yes, a lot ☐ Yes, a little ☐ No
- Do you want to learn more about the sea? ☐ Yes, a lot ☐ Yes, a little ☐ No
- Would you like to tell others about the sea? ☐ Yes, a lot ☐ Yes, a little ☐ No
- Did it help you learn about the sea? ☐ Yes, a lot ☐ Yes, a little ☐ No
If you have any questions or additional comments after the workshops, write here:
Many thanks!!
References
- Kiousopoulos, J. Exploring Littoral Space by means of ‘Coastality’. Mar. J. 2014, 1, 30–39. [Google Scholar]
- Nuttall, C. Backs to the sea? Least-cost paths and coastality in the Southern Early Bronze Age IIA Aegean. In Islands in Dialogue (Islandia): Proceedings of the First Postgraduate Conference in the Prehistory and Protohistory of the Mediterranean Islands, Turin, Italy, 14–16 November 2018; Torrossa Open: Florence, Italy, 2021; pp. 116–129. [Google Scholar]
- Food and Agriculture Organization. Integrated Coastal Area Management and Agriculture, Forestry and Fisheries. Available online: https://www.fao.org/4/a0266e/a0266e07.htm (accessed on 27 February 2025).
- United States Commission on Marine Science, Engineering and Resources. Our Nation and the Sea A Plan for National Action. 1969. Available online: https://www.coastalstates.org/wp-content/uploads/2018/05/Stratton-Comm-Report.pdf (accessed on 22 October 2025).
- Eurostat. Coastal Area. Available online: https://ec.europa.eu/eurostat/statistics-explained/index.php?title=Glossary:Coastal_area (accessed on 27 February 2025).
- Copernicus Land Monitoring Service. Coastal Zones. Available online: https://land.copernicus.eu/en/products/coastal-zones?tab=technical_summary (accessed on 27 February 2025).
- EU4Ocean Coalition. EU Blue Schools Application Guidelines. Available online: https://maritime-forum.ec.europa.eu/form/become-european-blue-school_en (accessed on 27 February 2025).
- Proshansky, H.M. The City and Self-Identity. Environ. Behav. 1978, 10, 147–169. [Google Scholar] [CrossRef]
- Buchan, P.M.; Glithero, L.D.; McKinley, E.; Strand, M.; Champion, G.; Kochalski, S.; Velentza, K.; Praptiwi, R.A.; Jung, J.; Márquez, M.C.; et al. A transdisciplinary co-conceptualisation of marine identity. People Nat. 2024, 6, 2300–2324. [Google Scholar] [CrossRef]
- Ambrosino, C.M.; Rivera, M.A.J. A longitudinal analysis of developing marine science identity in a place-based, undergraduate research experience. Int. J. STEM Educ. 2022, 9, 70. [Google Scholar] [CrossRef]
- Gómez, S.; Garriga, A.; Bosch, M.T.; Bosch, M.; Villasante, S.; Salazar, J. Ocean literacy in managing marine protected areas: Bridging natural and cultural heritage. Front. Mar. Sci. 2025, 12, 1540163. [Google Scholar] [CrossRef]
- Tuan, Y.F. Space and Place the Perspective of Experience. 1977. Available online: https://www.academia.edu/19846369/Yi_Fu_Tuan_Space_and_Place (accessed on 22 October 2025).
- Nuttall, C. Seascape Dialogues: Human-Sea Interaction in the Aegean from Late Neolithic to Late Bronze Age. Ph.D. Thesis, Uppsala University, Uppsala, Sweden, 2021. [Google Scholar] [CrossRef]
- Lištiaková, I.L.; Preece, D. The Experiences of Families on the Autism Spectrum in Rural Coastal Communities in England. In Including Voices: Respecting the Experiences of People From Marginalised Communities; Emerald Publishing Limited: Leeds, UK, 2024; pp. 43–63. [Google Scholar] [CrossRef]
- Larjosto, V. Islands of the Anthropocene. Area 2020, 52, 38–46. [Google Scholar] [CrossRef]
- Gospodini, A.-A.; Vouza, A.-R.; Kalergis, D.; Kyvelou, S.S. Strategic Participatory Planning and Social Management for Clustering Maritime Cultural Heritage: A Case Study of the West Pagasetic Gulf, Greece. Heritage 2025, 8, 48. [Google Scholar] [CrossRef]
- Jones, R. Political geography I: Blue geopolitics. Prog. Hum. Geogr. 2024, 48, 669–676. [Google Scholar] [CrossRef]
- Oishi, S.; Talhelm, T.; Lee, M. Personality and geography: Introverts prefer mountains. J. Res. Pers. 2015, 58, 55–68. [Google Scholar] [CrossRef]
- Terradas i Saborit, I. La Contradicción Entre Identidad Vivida e Identificación Jurídico. 2004. Available online: https://raco.cat/index.php/QuadernsICA/article/view/95585/165160 (accessed on 22 October 2025).
- Cebrián, G.; Junyent, M.; Mulà, I. Current Practices and Future Pathways towards Competencies in Education for Sustainable Development. Sustainability 2021, 13, 8733. [Google Scholar] [CrossRef]
- Institut Cartogràfic i Geogràfic de les Illes Balears. Litoral de les Illes Balears. Available online: https://apps.caib.es/sites/icgibinfo/es/inici/ (accessed on 2 November 2025).
- Govern de les Illes Balears. Instituto de Estadística de les Illes Balears. Territorio y Medio Ambiente. Available online: https://ibestat.es/estadistica/territorio-medio-ambiente/territorio (accessed on 22 October 2025).
- Agència d’Estratègia Turística de les Illes Balears. Lloret de Vistalegre. Available online: https://www.illesbalears.travel/es/mallorca/municipios/lloret-de-vistalegre (accessed on 22 October 2025).
- United Nations. United Nations Convention on the Law of the Sea. 1982. Available online: https://www.un.org/depts/los/convention_agreements/texts/unclos/unclos_e.pdf (accessed on 22 October 2025).
- Govern de les Illes Balears. Llei 6/2013, de 7 de novembre, de pesca marítima, marisqueig i aqüicultura a les Illes Balears 1. 2013. Available online: https://intranet.caib.es/sites/institutestudisautonomics/f/300047 (accessed on 17 February 2025).
- Goffriller, M. The castral territory of the Balearic islands: The evolution of territorial control in Mallorca during the middle ages. In Chateau et Représentations; Actes du Colloque International de Stirling (Ecosse); Centre de Recherches Archéologiques et Historiques Médiévales (CRAHM): Caen, France, 2008. [Google Scholar]
- Goffriller, M. The Castles of Mallorca A Diachronic Perspective of the Dynamics of Territorial Control on an Islamic Island; University of Exeter: Exeter, UK, 2011. [Google Scholar]
- Armas-Díaz, A.; Murray, I.; Sabaté-Bel, F.; Blázquez-Salom, M. Environmental struggles and insularity: The right to nature in Mallorca and Tenerife. Environ. Plan. C: Politics Space 2024, 42, 639–657. [Google Scholar] [CrossRef]
- Calvo, M.; Molina, D.J.; Santacreu, D.A.; Rossello, J.G. Enhancing ‘Places’ Through Archaeological Heritage in Sun, Sand, and Sea Touristic Coastal Areas: A Case Study From Mallorca (Spain). J. Isl. Coast. Archaeol. 2014, 9, 341–363. [Google Scholar] [CrossRef]
- Picornell, M. Insular identity and urban contexts: Representations of the local in the construction of an image of Palma (Mallorca, Balearic Islands). Isl. Stud. J. 2014, 9, 223–238. [Google Scholar] [CrossRef]
- Sebastián, J.B.; Garau, A.O. Alfabetización en Geografía y mapas mentales. Los conocimientos mínimos entre los estudiantes universitarios de Educación Primaria. Cuad. Geográficos 2018, 57, 330–351. [Google Scholar] [CrossRef]
- Sebastián, J.B.; Garau, A.O.; Pérez, M.R. Assessing geography knowledge in primary education with mental map analysis: A Balearic Islands case study. Educ. Stud. 2024, 50, 1–22. [Google Scholar] [CrossRef]
- Salazar, J.; Gili, J.-M.; Millán, L.; Vendrell-Simón, B.; Gómez, S. Ocean Literacy Opportunities in Urban Marine Ecosystems: Gorgonian Populations in Barcelona (Catalonia, Spain). Ocean. Soc. 2025, 2. [Google Scholar] [CrossRef]
- Salazar, J.; Marambio, M.; Ballesteros, A.; Vendrell-Simón, B.; Gili, J.-M. Reframing jellyfish perception from ‘enemies’ to ‘helpers’ through Ocean Literacy. Front. Mar. Sci. 2025, 12, 1636803. [Google Scholar] [CrossRef]
- IBESTAT. Institut d’Estadística de les Illes Balears. Available online: https://ibestat.es/aviso-legal/ (accessed on 4 March 2025).
- Instituto Nacional de Estadística. Cifras oficiales de población de los municipios españoles: Revisión del Padrón Municipal a 1 de enero de 2024. Available online: https://www.ine.es/jaxiT3/Tabla.htm?L=0&t=2860 (accessed on 4 March 2025).
- Associacions de Can Picafort. Can Picafort; Associacions de Can Picafort: Can Picafort, Mallorca, Spain, 1991; No. 107; Available online: https://ibdigital.uib.es/greenstone/collect/premsaForanaMallorca/index/assoc/Can_Pica/fort_199/1_mes08_.dir/Can_Picafort_1991_mes08_n0107.pdf (accessed on 30 March 2025).
- European Commission. Become a European Blue School. Available online: https://maritime-forum.ec.europa.eu/theme/ocean-literacy-and-blue-skills/ocean-literacy/network-european-blue-schools/become-european-blue-school_en (accessed on 20 November 2024).
- Esteva-Burgos, C.; Ruiz-Pérez, M. Modeling Spatial Determinants of Blue School Certification: A Maxent Approach in Mallorca. ISPRS Int. J. Geoinf. 2025, 14, 378. [Google Scholar] [CrossRef]
- EU4Ocean Coalition—European Commission. Som Escoles Blaves—A Beacon for Ocean Literacy in the Balearic Islands. Available online: https://maritime-forum.ec.europa.eu/som-escoles-blaves-beacon-ocean-literacy-balearic-islands_en (accessed on 20 November 2024).
- Sánchez-Cuenca, P. Conducta Ètica/Bloc A (Ethical Conduct/Block A); Escola Balear d’Administració Pública (EBAP), Govern de les Illes Balears: Palma de Mallorca, Spain, 2016. Available online: https://ebapenobert.caib.es/pluginfile.php/4336/mod_resource/content/6/Competencies_1_i_2_PDF.pdf (accessed on 20 September 2024).
- European Union. Regulation (EU) 2016/679 of the European Parliament and of the Council of 27 April 2016 on the protection of natural persons with regard to the processing of personal data and on the free movement of such data, and repealing Directive 95/46/EC (General Data Protection Regulation). Off. J. Eur. Union 2016, L 119, 1–88. Available online: https://eur-lex.europa.eu/eli/reg/2016/679/oj (accessed on 20 September 2024).
- BOE. Ley Orgánica 3/2018, de 5 de diciembre, de Protección de Datos Personales y garantía de los derechos digitales. Boletín Off. Estado 2018, 294, 119875–120022. Available online: https://www.boe.es/eli/es/lo/2018/12/05/3/con (accessed on 20 September 2024).
- McKinley, E.; Burdon, D.; Shellock, R.J. The evolution of ocean literacy: A new framework for the United Nations Ocean Decade and beyond. Mar. Pollut. Bull. 2023, 186, 114467. [Google Scholar] [CrossRef]
- Cava, F.; Schoedinger, S.; Strang, C.; Tuddenham, P. Science Content and Standards for Ocean Literacy: A Report on Ocean Literacy; National Oceanic and Atmospheric Administration (NOAA); National Geographic Society; COSEE; NMEA: Washington, DC, USA, 2005. Available online: https://www.coexploration.org/oceanliteracy/documents/OLit2004-05_Final_Report.pdf (accessed on 10 October 2024).
- Schoedinger, S.; Cava, F.; Strang, C.; Tuddenham, P. Ocean literacy through science standards. In Proceedings of the MTS/IEEE OCEANS, Washington, DC, USA, 17–23 September 2005; IEEE Computer Society. pp. 736–740. [Google Scholar] [CrossRef]
- United Nations. Transforming Our World: The 2030 Agenda for Sustainable Development (A/RES/70/1). Available online: https://sdgs.un.org/2030agenda (accessed on 10 October 2024).
- United Nations. United Nations Decade of Ocean Science for Sustainable Development 2021–2030 (A/RES/72/73). Available online: https://www.unesco.org/en/decades/ocean-decade (accessed on 10 October 2024).
- United Nations. United Nations Decade of Ocean Science for Sustainable Development Implementation Plan. 2021. Available online: https://unesdoc.unesco.org/ark:/48223/pf0000377082 (accessed on 10 October 2024).
- Fauville, G.; Strang, C.; Cannady, M.A.; Chen, Y.-F. Development of the International Ocean Literacy Survey: Measuring knowledge across the world. Environ. Educ. Res. 2019, 25, 238–263. [Google Scholar] [CrossRef]
- Markos, A.; Boubonari, T.; Mogias, A.; Kevrekidis, T. Measuring ocean literacy in pre-service teachers: Psychometric properties of the Greek version of the Survey of Ocean Literacy and Experience (SOLE). Environ. Educ. Res. 2017, 23, 231–251. [Google Scholar] [CrossRef]
- Paredes-Coral, E.; Deprez, T.; Mokos, M.; Vanreusel, A.; Roose, H. The Blue Survey: Validation of an instrument to measure ocean literacy among adults. Mediterr. Mar. Sci. 2022, 23, 321–326. [Google Scholar] [CrossRef]
- Spoors, F.; Leakey, C.D.B.; James, M.A. Piloting a Regional Scale Ocean Literacy Survey in Fife. Front. Mar. Sci. 2022, 9, 858937. [Google Scholar] [CrossRef]
- Department for Environment Food & Rural Affairs. Ocean Literacy Headline Report. 2022. Available online: www.gov.uk/defra (accessed on 20 April 2025).
- Macneil, S. Canadian Journal of Environmental Education. Yumagulova. 2019. Available online: http://www.colcoalition.ca (accessed on 20 April 2025).
- Ortanderl, F.; Bausch, T. Wish you were here? Tourists’ perceptions of nature-based destination photographs. J. Destin. Mark. Manag. 2023, 29, 100799. [Google Scholar] [CrossRef]
- Salazar, J.; Dominguez-Carrió, C.; Gili, J.-M.; Ambroso, S.; Grinyó, J.; Vendrell-Simón, B. Building a New Ocean Literacy Approach Based on a Simulated Dive in a Submarine: A Multisensory Workshop to Bring the Deep Sea Closer to People. Front. Mar. Sci. 2019, 6, 576. [Google Scholar] [CrossRef]
- Bartlett, D.; Smith, J.L. GIS for Coastal Zone Management; CRC Press: Boca Raton, FL, USA, 2004. [Google Scholar] [CrossRef]
- Nuttall, C. A GIS Analysis of Coastal Proximity with a Prehistoric Greek Case Study. J. Comput. Appl. Archaeol. 2024, 7, 170–184. [Google Scholar] [CrossRef]
- Environmental Systems Research Institute. Esri, ArcGIS Pro, Version 3.4. Available online: https://www.esri.com/en-us/arcgis/products/arcgis-pro/overview (accessed on 20 January 2025).
- Microsoft Corporation. Microsoft Power BI. Available online: https://powerbi.microsoft.com/ (accessed on 20 January 2025).
- Swami, V.; White, M.P.; Voracek, M.; Tran, U.S.; Aavik, T.; Ranjbar, H.A.; Adebayo, S.O.; Afhami, R.; Ahmed, O.; Aimé, A.; et al. Exposure and connectedness to natural environments: An examination of the measurement invariance of the Nature Exposure Scale (NES) and Connectedness to Nature Scale (CNS) across 65 nations, 40 languages, gender identities, and age groups. J. Environ. Psychol. 2024, 99, 102432. [Google Scholar] [CrossRef]
- Geiger, S.J.; White, M.P.; Davison, S.M.; Zhang, L.; McMeel, O.; Kellett, P.; Fleming, L.E. Coastal proximity and visits are associated with better health but may not buffer health inequalities. Commun. Earth Environ. 2023, 4, 166. [Google Scholar] [CrossRef]
- Kals, E.; Schumacher, D.; Montada, L. Emotional Affinity toward Nature as a Motivational Basis to Protect Nature. Environ. Behav. 1999, 31, 178–202. [Google Scholar] [CrossRef]
- Mayer, F.S.; Frantz, C.M. The connectedness to nature scale: A measure of individuals’ feeling in community with nature. J. Environ. Psychol. 2004, 24, 503–515. [Google Scholar] [CrossRef]
- Tam, K.-P. Dispositional empathy with nature. J. Environ. Psychol. 2013, 35, 92–104. [Google Scholar] [CrossRef]
- Umargono, E.; Suseno, J.E.; Gunawan, S.K.V. K-Means Clustering Optimization Using the Elbow Method and Early Centroid Determination Based on Mean and Median Formula. In Proceedings of the 2nd International Seminar on Science and Technology (ISSTEC 2019), Yogyakarta, Indonesia, 25 November 2019; Atlantis Press: Paris, France, 2020. [Google Scholar] [CrossRef]
- Scannell, L.; Gifford, R. Defining place attachment: A tripartite organizing framework. J. Environ. Psychol. 2010, 30, 1–10. [Google Scholar] [CrossRef]
- Henri, L.; Donald, N.-S. The Production of Space; Blackwell Publishing: Hoboken, NJ, USA, 1991. [Google Scholar]
- Yemini, M.; Engel, L.; Simon, A.B. Place-based education—A systematic review of literature. Educ. Rev. 2023, 77, 640–660. [Google Scholar] [CrossRef]
- Pikner, T.; Piwowarczyk, J.; Ruskule, A.; Printsmann, A.; Veidemane, K.; Zaucha, J.; Vinogradovs, I.; Palang, H. Sociocultural Dimension of Land–Sea Interactions in Maritime Spatial Planning: Three Case Studies in the Baltic Sea Region. Sustainability 2022, 14, 2194. [Google Scholar] [CrossRef]
- Willis, K.; Gupta, A. Connecting to the Sea: A Place-Based Study of the Potential of Digital Engagement to Foster Marine Citizenship. Urban Plan. 2025, 10. [Google Scholar] [CrossRef]
- Wozniak-Brown, J. Gaps and Opportunities for Local Resilience Planning in Connecticut. UConn Connecticut Institute for Resilience and Climate Adaptation. 2022. Available online: https://resilientconnecticut.uconn.edu/localresilienceplanning/ (accessed on 25 January 2025). [CrossRef]
- Hernández, R.C.; Camerin, F. The application of ecosystem assessments in land use planning: A case study for supporting decisions toward ecosystem protection. Futures 2024, 161, 103399. [Google Scholar] [CrossRef]
- Stepath, C.M. Marine education: Learning evaluations. J. Mar. Educ. 2007, 23, 45–51. [Google Scholar]
- O’Halloran, C. Impact of ocean connectedness, environmental identity, emotions, and ocean activities on pro-environmental behaviors. Front. Ocean. Sustain. 2025, 3, 1518099. [Google Scholar] [CrossRef]
Disclaimer/Publisher’s Note: The statements, opinions and data contained in all publications are solely those of the individual author(s) and contributor(s) and not of MDPI and/or the editor(s). MDPI and/or the editor(s) disclaim responsibility for any injury to people or property resulting from any ideas, methods, instructions or products referred to in the content. |
© 2025 by the authors. Licensee MDPI, Basel, Switzerland. This article is an open access article distributed under the terms and conditions of the Creative Commons Attribution (CC BY) license (https://creativecommons.org/licenses/by/4.0/).