Abstract
This contribution demonstrates how more human-centered measurements for sustainable urban planning can be created by enlarging the traditional set of urban sustainability indicators. In many municipal reports, sustainable indicators concentrate on environmental issues, by collecting data at an aggregated spatial and temporal level using quantitative methods. Our approach aims to expand and improve the currently dominant quantitative–statistical methods by including perception geographical data (subjective indicators following the social indicator approach), namely additional indicators at spatial and temporal levels. Including small-scale city district levels and a temporal differentiation produces more process assessments and a better representation of everyday life. Based on a survey we conducted at district levels in the city of Karlsruhe, we cover three sustainability dimensions (ecological, social, economic) and analyze (1) how citizens are mobile in a sustainable way (bike use) and (2) how they perceive and react to heat events in the city. We argue for taking people’s perception and the spatiality and temporality of their daily activities better into account when further developing urban sustainability indicators and when aiming for a sustainable, human-centered urban development.
1. Introduction
During the last two decades, sustainability has become increasingly important in spatial planning processes in Germany [1]. This observation can be made in particular for urbanized areas where the interests of many different stakeholders come together and where a consensus has developed that it is necessary to treat and handle resources in a sustainable way. This is due to the fact that many sustainable planning ideas have a direct or indirect impact on the cityscape and thus also on the population’s living environment. Therefore, urban planning processes that seek to reconcile both sustainable aspects and the population’s needs continue to reach limits and face great challenges, despite an increased sustainable awareness [2,3,4,5,6,7].
One of the reasons for this is that how the term sustainability is interpreted depends on how urban planners perceive and interpret the term during planning processes [4,8,9,10]. Another reason for this is that a practical implementation of the Brundtland Report [11] and a link to practical everyday life are still ongoing process.
When, in 1987, the World Commission on Environmental Development published the Brundtland Report titled “Our Common Future”, the development of a guiding principle for a sustainable development was ignited. It emphasizes that environmental and socio-economic concerns are principally interwoven at all regional levels [11] and that environment, economy and society are three overlapping sectors [6], and yet they are typically not discussed together. Typically, they are viewed as independent sectors with the ecological sector taking center stage [12]. Recently, however, there has been a shift towards either re-defining the boundaries between these sectors or even eliminating them altogether [12,13,14]. Ramos concludes that “‘sustainability’ and its related topic are wrapped up in a blurred web of contrary meanings” [15] (p. 824).
The discussion on sustainable development has begun to include questions on the connection between environment protection and equity or justice with a special emphasis on the social dimension of sustainability [8,9,15,16]. As more and more people live in cities, these spatial units, as local levels of development, continue to be highly relevant in the discussion on equal sustainable goals [4,16]. For sustainable spatial planning, emphasizing the social component in the urban context leads to focusing on ecological questions, e.g., climate protection and adaptation as well as biodiversity in cities or providing for green areas [4,10]. The demands on sustainable spatial planning processes and how urban spaces are perceived have changed due to a number of factors: shortage of available land, spaces that are already being used for multiple purposes and a changing awareness for the environment and sustainability [2].
Actors involved in planning in Germany are faced with many challenges at various levels in terms of sustainable urban development—especially when considering that planning often requires negotiation processes between different urban actors such as residents, administration, and politics. “A deeper understanding of which perception these stakeholders hold, as well as the associated procedural conflicts between them, is crucial, but thus far lacking” [4] (p. 2). This results in a number of challenges that have so far received little (scientific) attention, one of them being the level of active participation. Our focus here is on exactly that level since we continue to observe that attempts to increase citizens’ involvement in planning processes through direct and indirect participation often fall short and that citizens “willingness [to interact] […] seems to depend on their immediate concerns” [2] (p.14). Thus, often only particular population groups can be reached. If citizens were aware that their everyday activities are important contributors to their hometown’s sustainable development, it should be easier to motivate them to actively participate in planning processes. In order to create this awareness among the population on the one hand and to utilize it for sustainable planning in cities on the other, we argue that data must be collected especially at the interface of the different sustainability dimensions (e.g., means of transport—ecological-economic sustainable effects; heat waves—ecological-social sustainable effects). Furthermore, behavior must be considered in a real-life context meaning (a) on a small scale (e.g., for cities at district level) as well as (b) in a temporally differentiated way (see also Section 2). These spatio-temporal differentiated results in an everyday “doing sustainability” of citizens in the three intertwined sustainability dimensions, which can then be used to contribute to urban social justice and thus to a more human-centered urban planning. To show how perceptions on smaller scales contribute to a better link of planning with people’s daily life, we collected data on how citizens perceive and act in reference to selected sustainability issues in Karlsruhe at a district level, depending on the season, and the time of day. The indicator we chose to represent these types of mobility and perceptions are bicycles used as a means of transportation and the perception of and reaction to heat events.
This paper is structured as follows: In Section 2, we first introduce the research background on which this paper is based as well as our assumptions towards a more human-centered urban planning, and we then present in Section 3 the methods we used. In Section 4, we present results and answers to our research questions in a descriptive–methodological manner. Section 4.1 analyzes citizens’ bike mobility behavior and thus focuses on the ecological–economical dimension of sustainability. Section 4.2 deals with citizens’ perception and handling of heat events in an urban context, i.e., the ecological–social effects of the sustainability debate. The discussion and conclusion summarize the findings and underline the importance of spatial and temporal differentiated indicators for a sustainable and human-centered urban development.
2. Theoretical Background: State of Research and Our Proposal for a More Human-Centered Measurement
In literature, indicator based analyses are seen as an important measuring instrument when it comes to registering how sustainability goals in their various dimensions were reached in urban contexts and how they can be considered in decision making processes [14,17,18]. The indicators mainly used here are objective indicators that cover social, economic or ecologic sustainable dimensions and allow the quantitative measurement of sustainability [17]. There are numerous studies that criticize the individual sustainability dimensions. Some criticize that the indicators are not seen as being connected [12,19], others criticize that the indicators are not well defined [20] or that the different geographical measurement levels need to be woven closer together in order to win a better impression of how well local sustainability goals were reached [21,22]. What further complicates matters when it comes to sustainability indicators is that they are not always easily understood by the involved actors [15] and that often only objective and quantifiable items are surveyed since they are easy to collect, e.g., hard facts such as household income or types, usage frequency of transportation means, unemployment, human capital, and buying behavior. Furthermore, these items are almost exclusively aggregated at national or district levels, and seasonal or daily rhythms are almost never taken into account.
Only including objective data into a sustainability indicator analysis does not allow the design of development processes in a sustainable manner or to combine social, economic, and environmental dimensions. Pure participation instruments as well as online participation instruments do not go far enough since they only reach certain population groups, whereas the collection of subjective perceptual–geographical data at a district level through surveys can represent a broader cross-section of the population [23,24]. Such surveys are already used, for example, as part of the demand-side balancing ecosystem service analysis in planning processes, and they produce good basic results that can be built upon in the communication between different stakeholders [4,25]. However, such surveys have not yet been carried out on a nationwide and small-scale basis.
Including subjective assessments on spatial and social dimensions gained from surveys allows the gaining of a comprehensive understanding thereof [12,26]. The subjective perceptions of urban citizens play an especially important role since they do not only live in high-density areas but they also contribute to shaping them on a daily basis by “doing sustainability”. Thus, we argue that urban sustainable planning can be improved significantly by implementing more human-centered measurements and indicators.
To achieve this, we refer back to the theoretical frame of social indicator research approach. Social indicator research originally focused not only on prosperity, measured by quantitative indicators such as gross domestic product, but also on citizens’ well-being and welfare [27,28]. The goal of this empirically sound approach is to survey individuals and households regarding social processes and attitudes [28]. Social monitoring, established by Wolfgang Zapf in the 1970s in Germany, today also includes studies that measure sustainability [29,30,31,32]. A further research strand in this area is the indicator research in Seattle, which, on the basis of various sub-projects in the 1990s, aimed, among other things, to improve the quality of life in the neighborhoods [33,34,35,36]. These studies clearly show how important it is to contrast citizens’ perceptions with official data when contributing to the urban sustainability debate. Our research here therefore centers on how sustainability indicators benefit when subjective-perception geographical data are considered by criteria alongside quantitative–statistic data.
The indicator systems used to study sustainable cities can be divided into three sustainability dimensions, i.e., ecological, social, and economic. Looking at previous studies on sustainable city development and the indicator system used for this purpose, the indicators are generally structured according to the three sustainability dimensions, i.e., ecological, social, and economic dimensions. For the purpose of data collection, these dimensions are subdivided into further categories such as social participation or framework conditions for sustainable municipal development [14,36,37] or such topics as ground, mobility, economy, housing, and environment. When distinguishing between spatial scale levels and their methodological approach, however, it becomes clear that most indicators are only available at a citywide level and that they are not discernible at a district level. Other limiting factors, as mentioned earlier, are that indicators are mainly based on objective quantifiable (official) data and that they lack a necessary spatial–temporal differentiation.
Our aim is thus to demonstrate how citizens’ subjective assessments can be made an inherent part of planning processes by including subjective indicators that are measured at the interface of sustainability dimensions and that are (a) spatially and (b) temporally disaggregated.
Towards a More Human-Centered Sustainable Measurement and Urban Planning
Only when urban planners have gained an understanding of the population’s needs and perceptions of these three sustainability dimensions can a more human-centered sustainable urban planning be established. Our contribution to growing this kind of understanding thereof was taken in two steps. In the first step, we focused on how people were thinking about, deciding on, and lastly “doing sustainability”. We collected the data via an explorative survey used quantitative and subjective indicators (see Figure 1). In the second step, we showed how we can approximate citizens’ daily lives via a spatial and temporal differentiation.
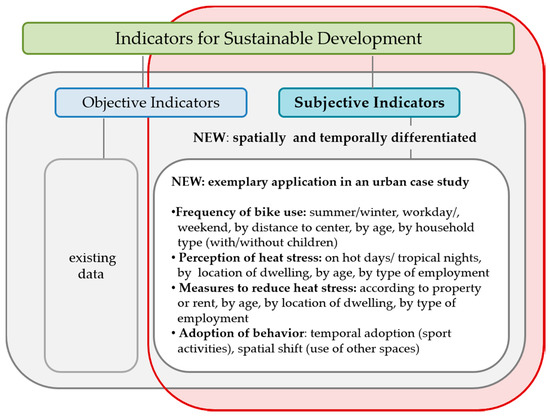
Figure 1.
Research suggestions towards a more human-centered sustainable spatial planning.
- (a)
- In order to represent daily life and action space we argued for a micro-scale approach and for collecting data at district levels since citizens’ daily action radius and socialization processes tend to be at the spatial level [38,39,40] (Section 4.1 and Section 4.2).
- (b)
- Many urban residents’ activities follow a temporal rhythm, be it during the course of the day, the week, or the year. By taking those rhythms into account, we could demonstrate how valuable it is to include indicators that are based on surveyed data regarding subjectivity, spatiality, and temporality when further developing urban sustainability indicators (Section 4.1 and Section 4.2).
We chose two exemplary topics that showed how important it is to take a subjective and spatially differentiated approach to them, i.e., at district levels, and to distinguish between temporal units, i.e., time of day and season. The variables we chose to study those topics were: (1) the use of bikes as one of the most sustainable means of transport and (2) the perception of and reaction to urban heat waves, which have been occurring more frequently over the last years.
3. Materials and Methods
We chose the Karlsruhe municipal area as our pilot study region for two reasons. One was that the city of Karlsruhe won the National German Sustainability Award as Germany’s most sustainable major city in 2015 [41]. The other reason was that, by 2015, it had already published the third comprehensive assessment report on its sustainability development [40], which means that our research area was already open for and accustomed to sustainability issues. Our data were collected by college students participating in a methodology seminar at the University of Karlsruhe on the topic of the Sustainable City and was part of the project “Teaching Geography PLUS: Connecting research and areas of geographical practice” (Lehramt Geographie PLUS: Verbindung von Forschung und Praxisfeldern der Geographie). The seminar’s goal was, firstly, to introduce the students to scientific research methods and projects and, secondly, to introduce them to discussing geographic and sustainability questions in a very practical way. They were involved in each research step, from deciding on the research questions, developing the methods, collecting data, and interpreting data for their student project, to presenting the findings to the public.
The data for this pilot study, conducted in September 2018, were collected through a partially standardized questionnaire and focused on how the interviewees perceived sustainability indicators. Although we understand that this pilot study cannot produce representative results, we do believe that our results allowed us to interpret sustainability indicators and to collect them at the district level in a differentiated way. The survey data were descriptively compared to official statistic data available through Karlsruhe’s Statistic’s Atlas (Statistik-Atlas) in which numerous indicators are reported at the city district level for the whole city area. We made a conscious decision to present an elaborated descriptive report without analytical statistics because of small numbers and partly incomplete data on all districts.
The interviews were conducted in September 2018 where the interviewees were registered, i.e., in 27 districts or places of residence for those interviewees that lived beyond Karlsruhe’s city limits. A total of 697 persons were interviewed albeit not everyone was asked all the questions, which in some cases led to the absolute number of responses to be lower than 697. This was a consequence of the workgroups setting different focal points, i.e., asking different sets of questions. To counter those differences in numbers, responses were aggregated across districts into regional responses for the analyses and were fitted to accommodate the different focal points. This led to separate spatial classifications for mobility behavior and for perceiving heat events.
The regions for analyzing mobility behavior were classified according to their proximity to both Karlsruhe downtown centers (Innenstadt and Durlach), since numerous sustainability features are linked to density, reachability, and other central–local characteristics. It should be noted that the districts were classified according to settlement structure and how they are connected to the downtown areas. Districts such as Waldstadt or Hagsfeld (60, 80), for example, whose built structures are separated from the core city by a large forest area and/or open fields, were grouped as “outskirts” although they seemed to be closer to the center than Neureut or Grötzingen (20, 26), whose built structures directly border the core city structures. Interviewees’ places of residence were grouped into four regions: core city of Karlsruhe, close to the city of Karlsruhe, outskirts of Karlsruhe, and other locations outside of Karlsruhe (see Figure 2).
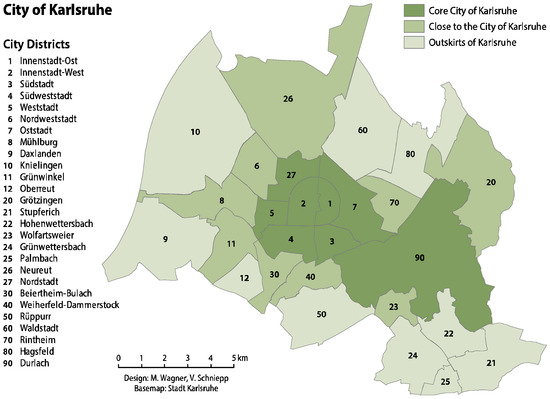
Figure 2.
Classification map of Karlsruhe’s urban districts according to the downtown centers (Innenstadt and Durlach). The fourth class “other locations” represents municipalities outside of Karlsruhe’s city limits that are not shown on the map (own classification) (cartography: Volker Schniepp).
The regions for analyzing the perception of heat events were grouped into four bio-climatic stress levels (following the data of the city of Karlsruhe) [36,42] and led the student workgroups to divide the 27 districts in which the interviewees lived into three “climate zones”, i.e., cool, middle and hot [43]. For the most part, those “climate zones” correspond to the mobility behavior regions, i.e., areas classified as “hot” are located downtown, the “middle” ones are located on the outskirts and the “cool” ones are located outside of Karlsruhe (see Figure 3).
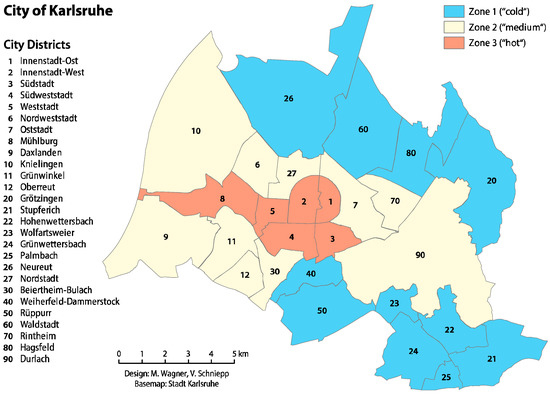
Figure 3.
Climate zone classification map of Karlsruhe’s urban districts (cartography: Volker Schniepp).
In addition, a classification of the response options was also made with regard to the heat events. The question was phrased as follows: “How do you perceive hot days (temperature maximum of ≥30 °C) in your everyday life?” and “How do you perceive nightly heat stress (temperature maximum of ≥20 °C)?” The answer categories were “very stressful”, “stressful”, “neither/nor”, “pleasant”, “very pleasant”. In cases in which the answers were “stressful” or “very stressful” we continued to ask “Which symptoms do you experience? Please name up to three symptoms”. These answers were analyzed by age, climate zone, and living conditions (own property/rent) in the city. We also surveyed individual adaptation strategies, e.g., moving the times for sports activities or working hours, or whether constructional changes were undertaken.
What must be noted for the entire study is that a little more than half the interviewees were 18 to 29 years old. This overrepresentation was owed to the student interviewers having preferred to interview people of their own age group and was accounted for when interpreting the findings. Notwithstanding this limitation, we achieved interesting results especially for elderly respondents. Furthermore, we would like to point out that this survey was a pilot study that makes no claim of completeness, representativeness or reproducibility. Nevertheless, the results and methods can demonstrate how subjective data collected at the district level can contribute to the upstream processes of sustainable urban planning.
In order to register the interviewees’ assessments, perceptions, and user behavior in a controlled fashion, the interviews were conducted based on partially standardized questionnaires, and the sustainability indicators were operationalized. The questionnaire ended with socio-demographic questions and all in all took 15 min to complete. The interviews were conducted during a three-week period from the end of July to the beginning of August 2018 by random street surveys in different city districts. After coding the data electronically, we analyzed them by using the SPSS 24 program (provided by IBM Corporation, Armonk, NY, USA).
We also conducted a document search for studies on bicycle use and heat results in Germany with regard to sustainable urban development processes. By means of a comparative descriptive analysis, the results of our study are related to the results of the document research in the following result section.
4. Results of the Pilot Study Survey
With this pilot study, we wanted to contribute to improving the analytical options of urban sustainability indicators, how they are constructed and—most importantly—how they are interpreted. Our approach was built on bringing in subjective, spatial, and temporal dimensions. The indicators we chose allowed a better understanding of (a) seasonal and spatial differentiated mobility behaviors (economic–ecological) and of (b) how seasonal heat events are perceived in the districts of the city of Karlsruhe (social–ecological).
4.1. Sustainable Mobility: Bicycle Use in City Districts and throughout the Year
The topic of mobility was central for all workgroups and was surveyed in great detail. With regard to the concept of sustainability, the mode of transport in our study connected in particular to both the economic and ecological dimensions. By being mobile without using one’s own car and instead using public transport, car-sharing services, or, as described in more detail below, the bicycle, sustainable action is taken, especially in an ecological sense. In addition, the economic dimension should not be underestimated since ticket prices decide who can afford using public transport. “Mode of transportation” thus combines ecologic, economic, and social dimensions of sustainability.
Considering the great importance of this topic and the special significance of bicycles for everyday mobility in Karlsruhe, this example was intended to show how differentiated an evaluation of subjective data can be carried out.
In Karlsruhe, bicycle riding is a means of transportation that can be used independent regardless of age or physical fitness. This is owed to the city’s topography and the circumstance that for the most part it is located in the fairly flat Upper Rhine Rift; only four smaller districts are situated in more hilly parts and are known as “mountain villages” (Bergdörfer). The bicycle path network was systematically expanded, and in 2019, Karlsruhe won the German Cyclist’s Associations annual prize (Allgemeiner Deutscher Fahrrad-Club) as Germany’s “most bicycle friendly mayor city”.
Surveys on the bicycle situation in Karlsruhe itself have already been conducted by the city’s statistical office. By means of a document analysis, we complied these statistics and compared them according to the guidelines we proposed for a more human-centered sustainable urban planning (see Section 2). One result the comparison showed was that figures on the cycle path network and the paved roads for pedestrians and cyclists measured by length in kilometers were used as objective indicators [44]. Another result was that, in regard to the choice of means of transport and the mobility behavior, data on subjective indicators had also been collected, on namely the choice of means of transportation broken down by distance in kilometers or by destination, as well as the frequency of use of the means of transport [45]. Only the results of a modal split were surveyed according to the districts and thus temporally differentiated. Seasonal fluctuations were found in particular in the use of bicycles [45]. However, the overall survey was also carried out here for the entire urban area of Karlsruhe and not at the district level. This generalization does not do justice to the different topographical and distance-related differences of the individual districts (see also Figure 2), and thus makes it more difficult to use the results for concrete planning processes.
Using a bicycle as a means of transportation is dependent on outside weather conditions, especially temperatures and precipitation, and its attractiveness varies depending on the seasons. The meteorological conditions in Karlsruhe, however, are rather favorable for bicycle riding throughout the year. Monthly mean temperatures during the winter months November, December, and January range between 2 and 3 °C, and during the summer, between 18 and 20 °C [46]. Notwithstanding these mean temperatures, it can be assumed that the frequency with which bicycles are used a means of transportation varies depending on the season, as already confirmed by a survey of the city of Karlsruhe [45].
In order to capture those temporal variations, we asked the interviewees how often they use their bicycles both during the summer and the winter months. Indeed, the frequency with which they are used varies depending on the season: during summer months, 48% of the interviewed Karlsruhers use their bicycles on a daily basis, whereas that share drops to 31% (still a high share) during winter months. When aggregating “daily”, “two to three times a week”, and “once a week” to “regular bicycle usage”, then that share reached 73% for summer months and 55% for winter months (see Figure 4). Both shares were much higher than in cities of comparable size. The German Bicycle Monitor 2019 (Fahrrad-Monitor Deutschland 2019) only registered between 15% and 46% of those surveyed as regular bicycle riders without, however, differentiating between seasons [47]. One reason why the share of (year-round) bicyclists was higher in our sample was that university students were clearly overrepresented. With this understanding, we strongly advise distinguishing seasonal frequencies when collecting data on this means of transportation. The high bicycling frequency is as remarkable as the similar frequency both in summers and winters. This cannot only be explained by mild winters and few snow days but instead suggests that for many interviewees, bicycles are their “main means of transportation” and that less favorable weather conditions are tolerated and accepted as a fact.
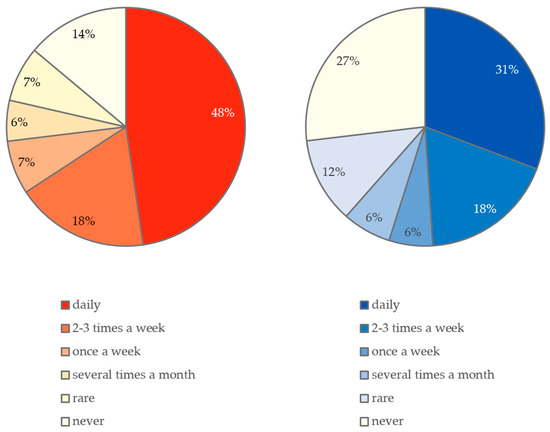
Figure 4.
Bicycle use in summer (left) and winter (right).
In order to learn whether the distance to the city center indicates how often bicycles are used as a means of transportation, we divided the interviewees spatially by their distance to the city center, i.e., core city, close to the city, outskirts, and other locations outside Karlsruhe. Our findings, however, did not confirm this assumption. With the exception of interviewees that lived close to the city, between 45% and 50% of the interviewees used their bicycles on a daily basis during the summer and around 30% during the winter. A total of 40% of the interviewees who lived close to the city used their bicycles on daily basis during the summer and 23% during the winter (see Figure 5). Despite the latter group using bicycles less frequently, the distance between place of residence and the city center did not seem to be decisive for riding a bicycle. This might be owed to the fact that Karlsruhe’s city centers (Mitte and Durlach) can be reached from all districts in roughly 30 min by bicycle, making temporal variabilities more decisive than spatial variabilities. One policy implication that can be concluded is that in the winter months public transport services must be adjusted and increased accordingly. The aim here is to increase the attractiveness of public transport for cyclists who do not use their bicycles in the winter and instead take the bus or train rather than using their own car.
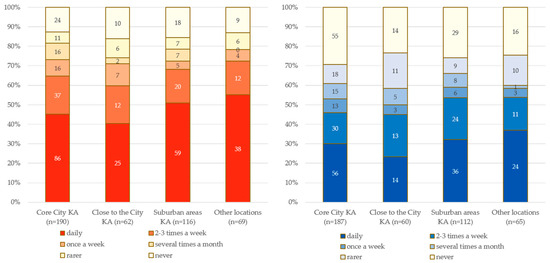
Figure 5.
Bicycle use in summer (left) and winter (right) according to district clusters (absolute numbers in brackets).
Most studies show that older people use their bicycles less often than younger people. The German Bicycle Monitor 2019, for instance, reports that 55% of those aged 14–19 and 48% of those aged 20–30 use their bicycles several times a week, whereas this only applies to 33% of those aged 60–69 [47,48]. In Karlsruhe, 80% of those under 30 years use their bicycles at least once a week during the summer and 66% during the winter; 50% of those older than 60 years use their bicycles at least once a week during the summer and 42% during the winter. What is remarkable about this finding is that riding a bicycle for older people living in Karlsruhe is a favored means of transportation regardless of the time of the year and that they are less influenced by seasons than younger people. This finding definitely deviates from common patterns.
According to the German Mobility Panel (Deutsches Mobilitätspanel), households with children under the age of 18 are the group that has the most cars and that also uses them the most [49,50]. This could lead one to assume that persons in these household types use their bicycles less often than others. Both the results of the German Mobility Panel and ours, however, show that using a bicycle as a means of transportation for adults in these household types reaches 45% and is thus the highest rate on weekends [49]; those rates are somewhat lower on workdays according to the German Mobility Panel. Our results revealed that 81% of persons in households with children under the age of 18 used their bicycles at least once a week during the summer and in households without children that share reached 72%; during the winter those shares dropped to 66% and 54%, respectively (see Figure 6). The usage frequencies for both groups did not differ significantly between the different places of residence in Karlsruhe, which could be indicative that Karlsruhe’s city area has an extensive bicycle infrastructure.
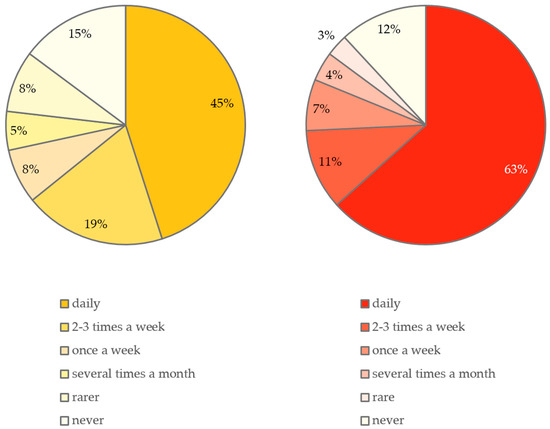
Figure 6.
Bicycle use in summer of households without children under 18 years (left) and with children under 18 years (right).
Another study on the mobility behavior of family households in cities in the German state of Baden-Württemberg underlined the efforts by the cities of Karlsruhe and Freiburg to improve bicycle traffic [50]. Family households that regularly use bicycles as means of transportation year-round contribute to sustainable traffic developments in more than one way: many of their trips are climate-neutral, fewer spaces are needed for parking spaces, and children learn from an early age that bicycles are an everyday means of transportation.
A differentiated analysis of subjective indicators allows taking individual perceptions, spatiality, and temporality into consideration. This in turn allows gaining deeper insights into how means of transportation are used as well as learning more about their specifics than when research is limited to purely quantitative and one-dimensional analyses. A differentiated analysis also allows the different interests different stakeholders might be led by to be taken into account. For example, the city of Karlsruhe is planning a new Bicycle Policy Audit (BYPAD) in 2020, in which the situation of the cyclists in the city will be assessed by the city administration, politicians, associations, and interest groups [51]. The survey, however, will not include a spatially differentiated representative survey of local cyclists. Since data at the level city districts will not be collected, the perception of local cyclists and thus their “doing sustainability” will not be included in the audit.
For negotiation processes in concrete planning, this means that direct argumentation and reaction are possible, especially at the district level. This has the advantage for planners that planning projects can be coordinated even more concretely with the citizens and thus a higher acceptance can be expected. In this way, planning can be shaped more in line with the reality of citizens’ lives and their needs, e.g., increase in the supply of public transport in winter, adapted timetables in different city districts, and new aspects, such as temporary differences in the use of means of transport at a small-scale level, can move into the focus of research and planning.
This example reveals how those studies can be used to derive initial trends in transport planning and how they can highlight in which districts the need for alternative or new public transport services in particular still represents potential compared to bicycle use.
4.2. Climate Change in Cities: Heat Events in Urban Districts
Cities setting out to develop in a sustainable way need to consider developments connected to climate change. The exceptional heat events during the summers of 2018 and 2019 are generally understood as indicative of climate change. The previous section on means of transportation underlined how important it is to take temporal differences into account when analyzing individual’s behavior and assessments as an example of the ecologic–economic dimension of sustainability. The city of Karlsruhe has not yet conducted a statistical survey on how heat waves are perceived, nor have they or other studies from our document analysis surveyed how satisfied Karlsruhe citizens are with green spaces, noise levels, and air quality. The socio-ecological sustainability dimensions that have been surveyed [52] are seldom spatially nor temporally differentiated. Based on this knowledge, in the following chapter we would like to show how important the collection of such spatially and temporally differentiated perception data can be when implementing policy implications.
Analyzing heat events, which in Germany occur during summer months, thus calls for differentiating between day- and night-time temperatures as well as developing an understanding for how these events affect subjective well-being and how heat stress is perceived by city dwellers. In order to study the ecological–social dimension of sustainability, we analyzed how citizens perceive heat events both during the day and the night, depending on the district and their personal perceptions.
The Upper Rhine Rift, which Karlsruhe belongs to, today already belongs to one of the regions in Germany that experience more than twelve days of what are known as hot days, i.e., temperatures above 30 °C [53]; according to prognosis, the number of those days could climb up to 40 days by 2100. Aside from the hot days, what are known as tropical nights are perceived as especially stressful, when temperatures do not sink below 20 °C at night. Currently, the Upper Rhine Rift annually experiences those types of night four times a year on average; long-term prognosis suggest that they might occur up to 30 times per year by the end of this century.
During the past 20 years, numerous studies have been dedicated to analyzing how heat events in cities affect people’s health, as Franck et al. (2013) [54] and Kunz-Plapp (2018) [55] have demonstrated. Among other things, this interest is related to the heat wave that hit all of Europe during August 2003 [56,57,58]. In those studies, as Franck et al. (2013) [54] pointed out that people’s well-being and the effects on their health were typically connected to outdoor temperatures, despite the fact that people spend much of their time indoors, especially during night hours. By contrast, Franck et al.’s study published in 2013 referred to indoor temperatures, different building structures, and people’s subjective perceptions [54]. They concluded that aside from the distance between a place of residence to the downtown area, the most important factor influencing the subjective perception of heat stress is evening indoor temperatures. Based on those findings, we concluded that utilizing both the temporal and subjective perspectives in our study would serve attaining our research goal well.
We asked how the interviewees perceived what are known as “hot days” and tropical nights and whether there are measures they can put in place to ease the situation. Age is a central analytical category when it comes to studying vulnerability during heat waves as it can be assumed that older or ill people are especially affected by heat. Typically, mortality or morbidity studies are referenced [57,59], and they explain why older people are physically not so well capable of adjusting to high temperatures. Interestingly, the study by Pfaffenbach and Siuda (2010) [60] on people over 50 years of age living in Aachen found that only 50% reported that they perceived heat as not stressful or not stressful at all. A total of 30% of those who were 80 years or older reported that they perceived heat as (very) stressful, whereas only 20% of the younger interviewees reported heat to be a stressful experience [60]. Almost half the interviewees with health issues (47%) reported heat as being stressful experience for them [60] (p. 197).
We collected our data in September 2018, only a few weeks after a July and August heat wave. A total of 65% of our interviewees reported that they perceived heat as (very) stressful during the day and 50% reported the same for the night-time hours. This was especially true for the 51 to 65 year old interviewees during the day and for those between 26 and 50 years during the night but not for people older than 65 years. Since interviewees also mentioned stress related to working, it could be that heat stress at work and obligations linked to gainful employment lead to heat stress feeling even more unpleasant. Retirees are in a position to react to heat in a more flexible way, i.e., by not taking up activities or moving them to a different time. Since recent studies, e.g., Schuster et al. (2017) [60], have pointed out that age is far less significant in explaining how heat is perceived than overall health or fitness [61], it seemed necessary to rethink how indicative age, measured in years, is as a distinction criterion.
We categorized the living environment with respect to the particular construction or structural exposition to heat events by distinguishing between three climate zones within Karlsruhe (cp. Section 2). These categories were “cool”, “middle”, or “hot”. The responses showed that heat during the day was perceived as rather stressful in the “cool” zones, albeit without showing a clear pattern. The responses to the situation during the night showed clear patterns in line with the climate zones (see Figure 7). Many more interviewees, in “hot” zones, reported that tropical nights were perceived as (very) stressful. Since university students and those gainfully employed do not spend time in their residential areas during the day but at the university or at work, i.e., in other climate zones, the results cannot concur. During the night, however, they are in their apartments/houses and they then perceived the urban heat island effect directly at their own place of residence. This finding is in line with findings from Francke et al. (2013) [53] that shows the strongest connection between evening indoor temperatures and subjective heat stress. It is remarkable that there is one group that reports heat as being pleasant both during the day and during the night; very often, they are under the age of 25.
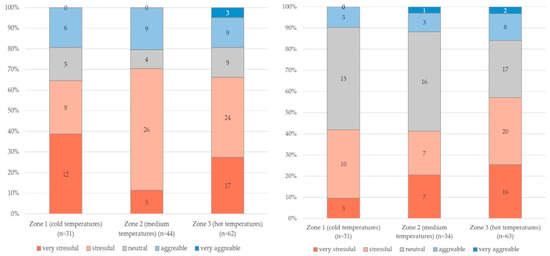
Figure 7.
Heat stress according to climate zones on hot days (left) and in tropical nights (right) (absolute numbers in brackets).
When asked about heat stress symptoms either during the day or at night, most often perspiration, headaches, or exhaustion were mentioned. All these mentions have in common that they affect performance capabilities and that they presumably affect especially those that are expected to perform during certain times of the day, i.e., especially those gainfully employed and among especially those holding full-time positions and subjected to fixed working hours. They are also those that are especially affected by nightly problems since they cannot catch up on lost nightly sleep during the day. This might be why surprisingly neither older interviewees in our or in Pfaffenbach/Siuda’s (2010) [60] studies reported being especially (strongly) affected by hot temperatures. Employing subjective indicators and differentiating them according to social, spatial, and temporal dimensions led to deeper insights into the specific stresses caused by heat both during days and nights.
There are many different ways to protect oneself from heat during heat waves and/or to adjust daily activities to the situation. One way is to undertake construction measures or to employ means that contribute to making the situation in a building more durable. This could either be something such as shading, e.g., through shutters or marquees, that prevent heat from getting into the rooms or something such as cooling the inside of buildings, e.g., cooling fans or air conditioners. These measures differ in how extensive and expensive they are. Renters do not have all the options owners have since structural or architectural changes need to either be carried out by the owner or at least require their consent. In our study, 39% of the interviewees were owners and 61% renters, with the latter’s share being the highest (81%) in the downtown zone. That zone is also the zone with the highest temperatures. Only 9% of all interviewees reported that they had an air conditioner in their apartment or house; 64% of those interviewees that had an air conditioner own the property they live in. A total of 27% of our interviewees could create shade by using marquees; the share of owners reached 81% in this group. A total of 83% of all interviewees had shutters, with 44% of those being owners (see Figure 8). A total of 43% of all interviewees had cooling fans, with 38% of them being owners. As could be expected, the more elaborate and expensive solutions (air conditioners, marquees) could be found more often when interviewees were also the owners of their place of living, and the less elaborate measures (cooling fans and shutters) could be found when interviewees rented the place they live in. This imbalance, in combination with the higher share of renters in “hot” climate zones, was reflected in how stressful heat was perceived during the nights: 51% of all renters perceived heat stress as (very) high, whereas this was only the case for 40% of owners, despite the fact that they were much older than renters.
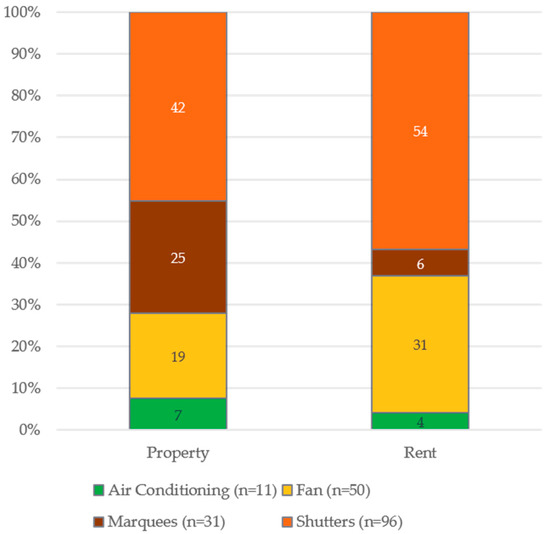
Figure 8.
Measures to reduce heat stress according to property (left) and rent (right) (absolute numbers in brackets).
Pfaffenbach/Siuda’s (2010) [60] study on Aachen revealed similar results: 48% of owners were satisfied with their indoor climate, compared to only 28% of renters. The former had more opportunities to stay in cooler rooms or to darken rooms [60]. Clearly, it is easier for owners to adapt to situations, which suggests that in cities economic capital contributes to a stronger resilience against climate change challenges.
Another strategy in dealing with heat events is changing one’s behavior. One can, for instance, change where one spends time, spending more or less time outdoors, adapting work hours or time for sport activities. When it becomes too hot indoors, one can move to cooler places, i.e., spending time in parks or gardens during early morning or evening hours. In those cases, possessing a private garden can certainly be viewed as a privilege; 59% of owners possessed a private garden, whereas this was only the case for 28% of renters. Instead, renters (79%) frequented public parks much more often than owners. For renters, public green spaces constituted an important recreational space during heat events.
One can also adapt one’s temporal patterns by reducing or shifting one’s working hours or by spatially moving one’s workplace to home, for instance. In order to find out whether these strategies were an option for our interviewees, we asked how they felt about different propositions. Only 37% of those gainfully employed were in favor of “If I had the opportunity I would rather work from home on hot days”, whereas 58% were in favor of “If I had the opportunity I would take a vacation day on hot days”, and 90% were in favor of “If I had the opportunity I would leave work earlier on hot days”. These answers strongly suggest that being able to be more flexible on hot workdays is a favored means in dealing with heat. This leads to the conclusion that those who can decide on when and where to work can deal better with heat events. This situation can be found more for self-employed individuals than for those who are gainfully employed. However, we did not survey how the interviewees are employed directly. Pfaffenbach/Siuda’s study for the city of Aachen draws the same conclusion [60] that self-employed interviewees feel the least impacted, maybe because they have more leeway in setting their work hours.
Typically, people have the most influence on how to spend their time when it comes to free time, and the interviewees did make use of that. When comparing the time spaces in which the interviewees did sports on “normal” days to on hot days (see Figure 9), it became evident that they moved those activities to either the early morning or later evening hours, i.e., that they reacted to heat with temporal flexibility. Thus, it can be concluded that temporal patterns are changed and that temporal flexibility is seen as a good coping strategy when dealing with heat stress.
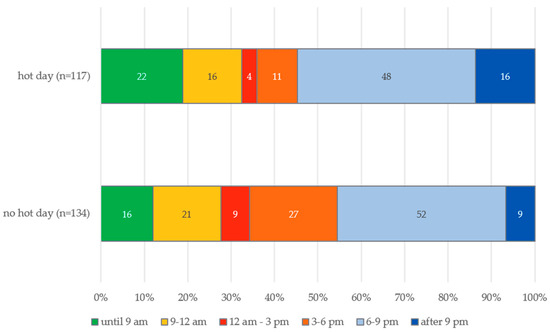
Figure 9.
Sports activities according to time on non-hot days and on hot days (absolute numbers in brackets).
These temporal and spatial patterns are crucial—not only during heat events—in determining everyday life, but they also determine whether means of transportation are used or not, and they are essential when it comes to how stress and well-being are perceived and assessed. These results can thus be used in negotiation processes to draw conclusions about the capacity of public transport at different times of the year or day and, for example, about the need of multifunctional green spaces, which in the event of a heat wave, can both cool the city center and serve as a leisure and recreational area.
In the following chapter, we will discuss these questions in connection with how urban sustainability indicators can be further developed and how sustainable urban planning can become spatially and temporally flexible.
5. Discussion and Conclusions
In this article, we set out to demonstrate that including subjective indicators—at the interface of different sustainability dimensions and in a spatial and temporal differentiated manner—in the more commonly used set of sustainability indicators allows a better understanding of how especially social dimensions are linked to economic resources. Analyses of this type can contribute to a better understanding of urban sustainable developments as a whole. Subjective indicators that show people’s “doing sustainability” in the form of perception, decision, and (re-)acting in a more or less sustainable way can serve as a fundamental basis for discussions in stakeholder negotiation processes.
Our findings are based on a pilot survey conducted in and around the city of Karlsruhe and they show how important it is to not only collect data at the city level but to be able to allocate them at district and quarter levels and differentiate them by seasons and times of day. Collecting data on how citizens perceive the latter dimensions on an everyday basis and in their everyday spatio-temporal context is a rather comprehensive endeavor and consequently not attempted often, especially at small-scale spatial levels.
Another limiting factor that contributes to not including economic and social dimensions is that subjective indicators are seldom collected, whereas objective indicators typically are. By choosing a perception geographical approach, we set our research off at exactly that research gap and focused on finding out how sustainability is adopted in citizens’ daily lives. To do that, we chose indicators that mirror everyday behavior in an urban context for our exemplary empirical analysis. The first indicator we analyzed is the seasonal use of transportation means. This is an indicator that is related to the ecological, economic, and social dimension of sustainability, and it affects environmental issues, user’s economic resources, as well as his/her social integration (via accessibility and participation). The second indicator analyzed how urban heat waves are dealt with during summertime, and it too is closely related to all sustainability dimensions, particularly to measures that reduce heat stress and to adoption strategies. Neither indicator is included in any of Karlsruhe’s statistic surveys at the district level.
Especially the results that differ from what generally might be expected show what can be gained and improved when considering urban sustainability planning issues. Through these spatially and temporally differentiated indicators, it has become evident that bicycles are used as a means of transportation for moving through the city of Karlsruhe in all quarters, in all age groups, and year-round with only little variances. However, concrete planning projects, especially in the sense of sustainable urban development, must start at this scale level in order to be ecologically effective and human-centered.
Our survey also showed that families with children under the age of 18 do not differ significantly in bicycle use form the rest of the population—neither in terms of space nor in terms of seasonal effects—which is rather different from the German average. Therefore, it can be assumed that children who grow up with bicycle riding regularly being an important means of transportation will continue this behavior as grownups. Our findings on bicycles as a means of transportation suggest that this is an important vehicle of choice. Urban planning should take into account that all demographic and social groups should be addressed as target groups for that means of transportation, especially since we can expect a strong acceptance for bikes as vehicles in daily transport.
The other subjective indicator we surveyed from a social perspective was heat events and how citizens perceive heat stress. Even though it can be expected that the citizens’ point of view on this topic will become increasingly important, the city of Karlsruhe has not yet conducted any surveys, that include questions of heat. Our results show that especially the working population between the age of 26 and 65 that lives in downtown districts feels affected and stressed by heat events. This is mainly linked to fact that nocturnal urban heat stress corresponds to urban heat island effects in so-called tropical nights. This result demonstrates the importance of a well-considered temporal differentiation of indicators. The interviewees devise various means in dealing with heat, e.g., by retreating into their backyards and renters seeking to evade the heat relying on public parks. Again, the economic impact on resilience strategies becomes apparent. Another measure in dealing with (heat) stress is being flexible time wise, e.g., adjusting work hours (something many employees would appreciate). This is a good example for how economic capital can counter ecologic events and thus how sustainability dimensions are interlinked.
These results support our claim that subjective indicators should be included when collecting data for sustainable indicators. Combining city-wide quantitative standardized surveys with small-scale, i.e., district level, spatial surveys presents a possibility to include people’s subjective assessments and will lead to a human-centered sustainable urban planning. Spatiality (district or quarter levels) and temporality (time of year, workdays/weekends, day/night) are two more central dimensions for gaining insights into sustainability in everyday life and for deriving policy implications.
There are a number of important questions of sustainable urban planning that can be addressed based on such spatially and temporally differentiated surveys: How, for instance, can public transport services ensure that bicycles can be taken along on buses and trains thus ensuring that bicycles as a means of transportation can be used year-round? How can parking spaces for bicycles with trailers be provided for, especially when we know that they are regularly used by families? How can the city provide for people who do not have a private yard to have access to parks and fresh air areas close by? How can opening hours be adjusted during heat waves for employees and users of urban infrastructure? How can temporal leeway and flexibilities, e.g., work and rest hours, be created and thus contribute to sustainable and just cities? Which opportunities do temporary changes of land use or interim land use hold?
To go beyond these questions, a combination of objective and subjective sustainability indicators can also help planners to communicate between different stakeholders on a more fundamental and lifelike level. The fact that planners not only have to resort to statistical values through collected data, but also know citizens’ assessment and perception of individual issues, leads to a more efficient organization of participation and negotiation processes. Conflicts of use of space and interests between different stakeholders can thus be managed in a more targeted manner and also more easily reconciled with sustainable urban planning objectives.
From our research, it has become clear that sustainable urban planning goes far beyond built infrastructure. It is not enough to only include spatial planning aspects, but temporal rhythms and usage patterns of the city need to be included, especially if social justice is one of the goals attempted to be reached through sustainability as Henckel and Kramer (2019) [62] suggested. If planning sustainable cities entails taking inter-generational, social, geographical, and procedural equity issues into consideration, as suggested by Haughton (1999) [9] (p. 241), then the traditional indicator based approaches (typically focused on objective, quantitative aspects) need to be extended to including subjective aspects. That way citizens’ subjective perspectives on temporal variabilities at micro-scale levels in the city could be included during planning phases.
The results from our pilot study need to be substantiated through further studies on urban sustainability indicators and through collecting perception geographic data at district levels. From a planning perspective, questions relating to policy implications could arise that should include temporal dimensions into spatial planning.
Author Contributions
Conceptualization, C.K.; methodology, C.K., M.W.; validation, C.K.; formal analysis, M.W.; investigation, C.K., M.W.; writing—original draft preparation, C.K., M.W.; writing—review and editing, C.K., M.W.; visualization, C.K., M.W.; supervision, C.K.; project administration, C.K.; funding acquisition, C.K. All authors have read and agreed to the published version of the manuscript.
Funding
This research was funded by the Federal Ministry of Education and Research Germany, FKZ: 01PL12004.
Conflicts of Interest
The authors declare no conflict of interest.
References
- Raco, M. Securing sustainable communities: Citizenship, safety and sustainability in the new urban planning. Eur. Urban Reg. Stud. 2007, 14, 305–320. [Google Scholar] [CrossRef]
- Growe, A.; Freytag, T. Image and implementation of sustainable urban development: Showcase projects and other projects in Freiburg, Heidelberg, and Tübingen, Germany. Raumforsch. Raumordn. 2019, 77, 1–18. [Google Scholar] [CrossRef]
- Wheeler, S.M.; Beatley, T. (Eds.) The Sustainable Urban Development Reader, 3rd ed.; Routledge: New York, NY, USA, 2014. [Google Scholar]
- Wagner, M.; Mager, C.; Schmidt, N.; Kiese, N.; Growe, A. Conflicts about Urban Green Spaces in Metropolitan Areas under Conditions of Climate Change: A Multidisciplinary Analysis of Stakeholders‘ Perceptions of Planning Processes. Urban Sci. 2019, 3, 15. [Google Scholar] [CrossRef]
- Barbey, K. Metropolregion im Klimawandel. Räumliche Strategien Klimaschutz und Klimaanpassung. Zur Entwicklung gesamträumlicher Konzepte am Beispiel der Metropolregion Rhein-Neckar. Ph.D. Thesis, Karlsruhe Institute of Technology (KIT), Karlsruhe, Germany, 2012. [Google Scholar]
- Federal Ministry of Transport and Digital Infrastructure. Wie kann Regionalplanung zur Anpassung an den Klimawandel beitragen? Ergebnisbericht des Modellvorhabens der Raumordnung “Raumentwicklungsstrategie zum Klimawandel” (KlimaMORO); Federal Ministry of Transport and Digital Infrastructure: Berlin, Germany, 2013.
- Kempter, T. Akteursorientierte Vulnerabilitätsanalysen. Bewusstseinsbildung und Akzeptanz für die Anpassung an die Folgen des Klimawandels auf regionaler Ebene durch Akteursbeteiligung. Ph.D. Thesis, Technische Universität Darmstadt, Darmstadt, Germany, 2016. [Google Scholar]
- Marcuse, P. Sustainability is not enough. Environ. Urban. 1998, 10, 103–111. [Google Scholar] [CrossRef]
- Haughton, G. Environmental justice and sustainable city. J. Plan. Educ. Res. 1999, 18, 233–243. [Google Scholar] [CrossRef]
- Bastiago, A.D. Economic, social and environmental sustainability in development theory and urban planning practice. Environmentalist 1998, 19, 145–161. [Google Scholar] [CrossRef]
- World Commission on Environment and Development (WCED). Our Common Future—Brundtland Report. 1987. Available online: https://sustainabledevelopment.un.org/content/documents/5987our-common-future.pdf (accessed on 15 July 2020).
- Giddings, B.; Hopwood, B.; O’Brien, G. Environment, Economy and Society: Fitting them Together into Sustainable Development. Sustain. Dev. 2002, 10, 187–196. [Google Scholar] [CrossRef]
- Hopwood, B.; Mellor, M.; O’Brien, G. Sustainable Development: Mapping Different Approaches. Sustain. Dev. 2005, 13, 38–52. [Google Scholar] [CrossRef]
- Ministry for the Environment, Climate Protection and the Energy Sector Baden-Württemberg. Nachhaltig handeln. Baden-Württemberg; Ministry for the Environment, Climate Protection and the Energy Sector Baden-Württemberg: Stuttgart, Germany, 2015. [Google Scholar]
- Ramos, T.B. Sustainable Assessment: Exploring the Frontiers and Paradigms of Indicator Approaches. Sustainability 2019, 11, 824. [Google Scholar] [CrossRef]
- Dempsey, N.; Bramley, G.; Power, S.; Brown, C. The social dimension of sustainable development: Defining urban social sustainability. Sustain. Dev. 2011, 19, 289–300. [Google Scholar] [CrossRef]
- Dizdaroglu, D. The Role of Indicator-Based Sustainability Assessment in Polcy and the Decision-Making Process: A Review and Outlook. Sustainability 2017, 9, 1018. [Google Scholar] [CrossRef]
- Agol, D.; Latawiec, A.E.; Strassburg, B.B. Evaluating impacts of development and conservation projects using sustainability indicators: Opportunities and challenges. Environ. Impact Assess. Rev. 2014, 48, 1–9. [Google Scholar] [CrossRef]
- Adinyira, E.; Otenga-Seifah, S.; Adjei-Kumi, T. A Review of Urban Sustainability Assessment Methodologies. In International Conference on Whole Life Sustainability and Its Assessment; Horner, C., Hardcastle, A., Price, J., Bebbington, J., Eds.; Glasgow, UK, 2007; Available online: https://download.sue-mot.org/Conference-2007/Papers/Adinyira.pdf (accessed on 1 March 2020).
- Tanguay, G.A.; Rajaonson, J.; Lefébvre, J.-F.; Lanoie, P. Measuring the Sustainability of Cities: An Analysis of the use of Local Indicators. Ecol. Indic. 2010, 10, 407–418. [Google Scholar] [CrossRef]
- Turcu, C. Re-thinking sustainability indicators: Local perspectives on urban sustainability. J. Environ. Plan. Manag. 2012, 56, 695–719. [Google Scholar] [CrossRef]
- Yigitanclar, T.; Dur, F.; Dizdaroglu, D. Towards prosperous sustainable cities: A multiscalar urban sustainability assessment approach. Habitat Int. 2015, 45, 36–46. [Google Scholar] [CrossRef]
- Kaza, N. Tyranny of the Median and Costly Consent: A Reflection of the Justification for Participatory Urban Planning Processes. Plan. Theory 2006, 5, 255–270. [Google Scholar] [CrossRef]
- Alfasi, N. Is Public Participation Making Urban Planning More Democratic? The Israeli Experience. Plan. Theory Pract. 2003, 4, 185–202. [Google Scholar] [CrossRef]
- Spyra, M.; Kleemann, J.; Cetin, N.I.; Navarrete, C.J.V.; Albert, C.; Palacios-Agundez, I.; Ametzaga-Arregi, I.; La Rosa, D.; Rozas-Vásquez, D.; Adem Esmail, B.; et al. The ecosystem services concept: A new Esperanto to facilitate participatory planning processes. Landsc. Ecol. 2018, 34, 1715–1735. [Google Scholar] [CrossRef]
- Bell, S.; Morse, S. Sustainability Indicators Past and Present: What Next? Sustainability 2018, 10, 1688. [Google Scholar] [CrossRef]
- Noll, H.-H. Social Indicators and Quality of Life Research: Background, Achievements and Current Trends. In Advances in Sociological Knowledge over Half a Century; Genov, N., Ed.; VS Verlag für Sozialwissenschaft: Wiesbaden, Germany, 2004. [Google Scholar]
- Noll, H.-H. On the History of Social Indicators Research: Measuring, Monitoring and Researching Wellbeing. In Essays by the Members of the Scientific Advisory Board. Government Strategy on Wellbeing in Germany; German Government, Ed.; Federal Press Office: Berlin, Germany, 2017; pp. 6–17. [Google Scholar]
- Babcicky, P. Rethinking the Foundations of Sustainability Measurement: The Limitations of the Environmental Sustainability Index (ESI). Soc. Indic. Res. 2013, 113, 133–157. [Google Scholar] [CrossRef]
- Parkinson, J.R.; Stedman, R.C.; Varghese, J. Moving towards Local-level Indicators of Sustainability in Forest-based Communities: A Mixed-method Approach. Soc. Indic. Res. 2001, 56, 43–72. [Google Scholar] [CrossRef]
- Hodge, T. Toward a Conceptual Framework for Assessing Progress Toward Sustainability. Soc. Indic. Res. 1997, 40, 5–98. [Google Scholar] [CrossRef]
- Rajaonson, J.; Tanguay, G.A. Urban Sustainability Indicators from a Regional Perspective: Lessons from the Montreal Metropolitan Area. Soc. Indic. Res. 2019, 141, 85–1005. [Google Scholar] [CrossRef]
- German Environment Agency: Stadtentwicklung. 2019. Available online: https://www.umweltbundesamt.de/themen/nachhaltigkeit-strategien-internationales/planungsinstrumente/umweltschonende-raumplanung/stadtentwicklung#textpart-1 (accessed on 1 December 2019).
- Stadt Karlsruhe, Amt für Stadtentwicklung: Nachhaltigkeitsentwicklung 2015. Karlsruhe. 2015. Available online: https://www.karlsruhe.de/b3/natur_und_umwelt/umweltschutz/agenda21/HF_sections/content/1445943350050/Nachhaltigkeitsentwicklung2015.pdf (accessed on 5 December 2019).
- Stadt Karlsruhe: Nachhaltigkeitspreis 2015. 2019. Available online: https://www.karlsruhe.de/b3/natur_und_umwelt/umweltschutz/nachhaltigkeitspreis (accessed on 1 December 2019).
- Steiling, B. Klima im Wandel. In Atlas Karlsruhe. 300 Jahre Stadtgeschichte in Karten und Bildern; Bräunche, E.O., Kramer, C., Ludäscher, P., Zibat, A., Wiktorin, D., Eds.; Emons: Köln, Germany, 2014; pp. 110–111. [Google Scholar]
- Brugmann, J. Is there a method in our measurement? The use of indicators in local sustainable development planning. Local Environ. Int. J. Justice Sustain. 1997, 2, 59–72. [Google Scholar] [CrossRef]
- Healy, A.; Morgan, K. Spaces of Innovation: Learning, Proximity and the Ecological Turn. Reg. Stud. 2012, 46, 1041–1054. [Google Scholar] [CrossRef]
- Howells, J. The Geography of Knowledge: Never so Close but Never so far Apart. J. Econ. Geogr. 2012, 12, 1003–1020. [Google Scholar] [CrossRef]
- Jacobs, J. The Death and Life of Great American Cities; Random House: New York, NY, USA, 1961. [Google Scholar]
- Holden, M. Revisting the Local Impact of Community Indicators Projects: Sustainable Seattle as Prophet in Its Own Land. Appl. Res. Qual. Life 2006, 1, 253–277. [Google Scholar] [CrossRef]
- Bundesamt für Bevölkerungsschutz und Katastrophenhilfe. Abschätzung der Verwundbarkeit von Bevölkerung und Kritischen Infrastrukturen gegenüber Hitzewellen und Starkregen; Bundesamt für Bevölkerungsschutz und Katastrophenhilfe: Bonn, Germany, 2013.
- Eckhardt, A.; Kollnig, S.; Kreutz, F.; Wille, J. Nachhaltige Stadt—Hitze in der Stadt: Abschlussbericht des Methodenorientierten Projektseminars (MPS) “Nachhaltige Stadt“ 2018/2019 am Institute for Geography and Geoecology des Karlsruhe Institute for Technology (KIT), Karlsruhe. 2019; unpublished. [Google Scholar]
- Stadt Karlsruhe: Statistisches Jahrbuch 2019. 2019. Available online: https://web5.karlsruhe.de/Stadtentwicklung/statistik/pdf/2019/2019-jahrbuch.pdf (accessed on 1 July 2020).
- Stadt Karlsruhe: Verkehrsmittelwahl und Mobilitätsverhalten: Ergebnisse der repräsentativen Verkehrsbefragung (SrV) 2018. 2020. Available online: https://www.karlsruhe.de/b4/stadtentwicklung/umfanaprog/srv2018/HF_sections/content/ZZoAZwcx1cSziZ/StEw%20aktuell_%20Mobilit%C3%A4t%20in%20St%C3%A4dten%20SrV%202018_Ergebnisse%20KA.pdf (accessed on 1 July 2020).
- Deutscher Wetterdienst (DWD): Station Rheinstetten (Karlsruhe). 2019. Available online: https://www.dwd.de/DE/wetter/wetterundklima_vorort/baden-wuerttemberg/rheinstetten/_node.html (accessed on 20 December 2019).
- SINUS (Markt-und Sozialforschung): Fahrrad-Monitor Deutschland 2019. Ergebnisse einer repräsentativen Online-Befragung. Version vom 30.09.2019. 2019. Available online: https://www.bmvi.de/SharedDocs/DE/Artikel/K/fahrradmonitor-2019.html (accessed on 20 December 2019).
- Federal Ministry of Transport and Digital Infrastructure (Ed.) Deutsches Mobilitätspanel (MOP)—wissenschaftliche Begleitung und erste Auswertungen (FE-Projektnummer: 70.923/2015). Bericht 2011/2012: Alltagsmobilität und Fahrleistung Karlsruhe. 2016. Available online: https://mobilitaetspanel.ifv.kit.edu/downloads/Bericht_MOP_11_12.pdf (accessed on 15 July 2020). [CrossRef]
- Federal Ministry of Transport and Digital Infrastructure (Ed.) Mobilität in Deutschland (MiD)—Ergebnisbericht. 2019. Available online: http://www.mobilitaet-in-deutschland.de/pdf/MiD2017_Ergebnisbericht.pdf (accessed on 15 July 2020).
- Schneider, U.; Hilgert, T. Urbane Familienmobilität im Wandel: Wie sind Familien im Alltag mobil und wie bewerten sie neue Mobilitätskonzepte? Working Paper Sustainability and Innovation. No. 2 08/2017; Karlsruhe, Germany. 2017. Available online: https://www.isi.fraunhofer.de/content/dam/isi/dokumente/sustainability-innovation/2017/WP08-2017_Urbane-Familienmobilitaet-im-Wandel_Schneider_Hilgert.pdf (accessed on 15 July 2020).
- Stadt Karlsruhe: Neues Bicycle Policy Audit (BYPAD) in Karlsruhe. 2019. Available online: https://www.karlsruhe.de/b3/verkehr/radverkehr/2020_bypad.de (accessed on 1 July 2020).
- Stadt Karlsruhe: Stadtentwicklung aktuell. Lebensqualität in Karlsruhe im Städtevergleich 2019. 2019. Available online: https://www.karlsruhe.de/b4/stadtentwicklung/umfanaprog/urbanaudit2019/HF_sections/content/ZZomuBCGjwaxNg/Lebensqualit%C3%A4t%20in%20Karlsruhe%20im%20St%C3%A4dtevergleich%202019.pdf (accessed on 1 July 2020).
- German Environment Agency (Ed.) Vulnerabilität Deutschlands gegenüber dem Klimawandel. CLIMATE CHANGE 24/2015, eine Studie durchgeführt von adelphi; Dessau-Roßlau, Germany. 2015. Available online: https://www.umweltbundesamt.de/sites/default/files/medien/378/publikationen/climate_change_24_2015_vulnerabilitaet_deutschlands_gegenueber_dem_klimawandel_1.pdf (accessed on 15 July 2020).
- Franck, U.; Krüger, M.; Schwarz, N.; Grossmann, K.; Röder, S.; Schlink, U. Heat Stress in Urban Areas: Indoor and Outdoor Temperatures in Different Urban Structure Types and Subjectively Reported Well-being during a heat wave in the city of Leipzig. Meteorol. Z. 2013, 22, 167–177. [Google Scholar] [CrossRef]
- Kunz-Plapp, T. Hitzewellen—Bewältigung und Anpassung an ein unterschätztes Risiko. Geogr. Rundsch. 2018, 7–8, 20–24. [Google Scholar]
- Conti, S.; Meli, P.; Minelli, G.; Solimini, R.; Toccaceli, V.; Vichi, M.; Beltrano, C.; Perini, L. Epidemiologic Atudy of Mortality During the Summer 2003 heat wave in Italy. Environ. Res. 2005, 98, 390–399. [Google Scholar] [CrossRef] [PubMed]
- Heudorf, U.; Meyer, C. Gesundheitliche Auswirkungen extremer Hitze—am Beispiel der Hitzewelle und der Mortalität in Frankfurt am Main im August 2003. Gesundheitswesen 2005, 67, 369–374. [Google Scholar] [CrossRef] [PubMed]
- Laaidi, K.; Zeghnoun, A.; Dousset, B.; Bretin, P.; Vandentorren, S.; Giraudet, E.; Beaudeau, P. The Impact of heat Islands on Mortality in Paris During the August 2003 heat wave. Environ. Health Perspect. 2012, 120, 254–259. [Google Scholar] [CrossRef] [PubMed]
- Havenith, G. Temperature Regulation, Heat Balance and Climate Stress. In Extreme Weather Events and Public Health Responses; Kirch, W., Menne, B., Bertollini, R., Eds.; Heidelberg: Berlin, Germany; New York, NY, USA, 2005; pp. 69–80. [Google Scholar]
- Pfaffenbach, C.; Siuda, A. Hitzebelastung und Hitzewahrnehmung im Wohn- und Arbeitsumfeld der Generation 50plus in Aachen. Eur. Reg. 2010, 18, 192–206. [Google Scholar]
- Schuster, C.; Honold, J.; Lauf, S.; Lakes, T. Urban heat Stress: Novel Survey Suggest Health and Fitness as Future Avenue for Research and Adaptation Strategies. Environ. Res. 2017, 12, 1–10. [Google Scholar] [CrossRef]
- Henckel, D.; Kramer, C. (Eds.) Zeitgerechte Stadt. Konzepte und Perspektiven für die Planungspraxis; Forschungsberichte der ARL 09; ARL: Hannover, Germany, 2019. [Google Scholar]
© 2020 by the authors. Licensee MDPI, Basel, Switzerland. This article is an open access article distributed under the terms and conditions of the Creative Commons Attribution (CC BY) license (http://creativecommons.org/licenses/by/4.0/).