Abstract
Urban underground pipeline aging and leakage can result in soil erosion and ground collapse, constituting a major threat to urban public safety. To investigate this disaster mechanism, this present study established a two-dimensional numerical model based on the computational fluid dynamics–discrete element method (CFD–DEM) two-way fluid–solid coupling approach, simulating and reproducing the entire process from soil erosion, soil arch evolution to ground collapse caused by underground pipeline leakage in water-rich sand layers. The simulation shows that under the action of seepage pressures, soil particles are eroded and lost, forming a cavity above the pipeline defect. As soil continues to be lost, the disturbed zone expands toward the ground surface, causing ground settlement, and in water-rich sand layers, a funnel-shaped sinkhole is eventually formed. The ground collapse process is closely related to the groundwater level and the thickness of the overlying soil layer above the pipeline. Rising groundwater levels reduce the effective stress and shear strength of the soil, significantly exacerbating seepage erosion. Increasing the thickness of the overlying soil layer can enhance the confining pressure, improve soil compactness, and promote the formation of soil stress arch, thereby effectively slowing down the rate of ground collapse. This study reproduces the process of ground collapse numerically and reveals the mechanism of ground collapse induced by underground pipeline leakage in water-rich sand layers.
1. Introduction
Currently, the issue of urban ground collapse has become increasingly severe, and it has emerged as a prominent hidden hazard that poses a significant threat to urban safety. For instance, 122 cases of urban ground collapse were reported in China between 2014 and 2018 []. Similar incidents have also been frequently documented in Thailand [], Spain [], South Singapore [], the Republic of Korea [], Italy [], and Brazil []. These incidents have severely affected urban traffic and posed threats to the lives and property of citizens. A large amount of data shows that urban ground collapse is trending towards higher occurrence frequency and greater hazard levels [].
As revealed by statistical analysis, underground pipeline failures represent the dominant factor contributing to urban subsidence. This is particularly true for pipelines in water-rich sand layers—layers that are below the water table, saturated, and possess weak particle bonding as well as high permeability. Notably, the probability of leakage increases substantially when pipelines exceed 25 years of service life []. Kuliczkowska [] analyzed the outcomes of 100 road traffic accidents caused by pipeline defects and found that such defects destabilize the soil around the pipelines, ultimately leading to ground surface settlement. Therefore, urban ground collapse is intimately linked to pipeline defects and groundwater seepage. For disaster prevention and control, investigating the ground collapse mechanism caused by the damage and leakage of underground pipelines is of great significance.
Laboratory-scale physical models enable the full replication of soil erosion and loss processes induced by groundwater infiltration into pipelines, thereby providing an effective means to investigate the mechanisms underlying ground collapse. For instance, existing experimental and physical modeling studies have extensively probed the key influencing factors and mechanisms of flow-induced erosion and ground collapse [,]. Research centered on erosion cavity evolution has pinpointed critical controlling factors: hydraulic head and soil height were found to govern the geometry of infiltration-induced erosion cavities [], while for internal erosion triggered by sewer pipe breakage, subsurface structures modify cavity formation by redirecting localized seepage pathways—typically developing along the shortest route from the surface to pipe cracks []. In terms of disaster progression mechanisms, studies on water-rich sand layers have revealed that water-sand leakage involves a continuous cycle of stress arch formation and failure []; for sand–fines mixtures surrounding defective pipes, cavity formation and evolution under hydraulic loading are primarily dependent on the fines content of the soil layers []. Additionally, systematic assessments of the drivers of ground collapse have established correlations between collapse depth and pipe burial depth, defect size, and groundwater level [], with large-scale physical models further validating the combined effects of groundwater conditions, overlying strata thickness, and particle size on collapse initiation []. While these experimental efforts [,,,,,] have collectively elucidated the core mechanisms of pipeline leakage-induced ground collapse and delineated key influencing factors, they exhibit two notable limitations: the inherent size effect of physical models constrains the direct applicability of their results to real-world engineering scenarios, and such tests often require substantial human and material resources—posing barriers to efficiently exploring a broader spectrum of parameter combinations or dynamic failure processes.
With the rapid advancement of computer technology and numerical methods, a diverse suite of numerical models has been developed to dissect the mechanisms of flow-induced ground collapse in geomaterials, each with distinct strengths and limitations tied to their underlying theoretical frameworks. Continuum-based models remain a foundational tool for macro-scale seepage–stress coupling analysis. Finite Element Method (FEM) models, for instance, have been widely applied to investigate leakage-induced deformation—such as analyzing the impact of waterproof curtain leakage during excavation dewatering, where simulations consistently demonstrate a strong correlation between ground settlement and the hydraulic conductivity of leakage points []. However, these continuum approaches inherently oversimplify the discrete, particle-scale interactions that govern erosion and cavity formation in granular geomaterials, limiting their ability to capture the progressive, localized failure processes critical to collapse initiation. In recent years, the discrete element method (DEM) and its hybrid coupling models have emerged as more powerful tools for resolving particle-scale mechanisms. Standalone DEM studies have successfully demonstrated correlations between soil particle loss rate and collapse magnitude in pipeline leakage scenarios [], yet they often neglect the dynamic fluid–particle interactions that drive erosion. To address this, hybrid coupling approaches have been developed: DEM–Lattice Boltzmann Method (LBM) models excel at simulating internal fluidization in pipe leakage by directly coupling discrete particle motion with fluid flow [], while DEM–Finite Difference Method (FDM) couplings have clarified how seepage-induced soil stress redistribution triggers stress arching, with intrinsic links between arch distribution and ground settlement []. The most widely adopted DEM–Computational Fluid Dynamics (CFD) coupling framework further expands this capability, enabling exploration of both collapse causes and deformation characteristics [], and even demonstrating that particle loss drives subsurface cavity formation alongside Platts stress arches through contact force chain analysis [,]. Compared to physical modeling, numerical simulations offer greater flexibility in simulating complex scenarios.
This study establishes a two-dimensional model through the coupling of DEM and CFD using the discrete element software PFC (Particle Flow Code) and the fluid dynamics solver FiPy. It analyzes the process of cavity formation caused by pipeline leakage in water-rich sand layers, as well as the impacts of groundwater level and overburden thickness on the expansion law of soil cavities and the process of ground surface collapse.
2. Mathematical Models
Flow-induced failure in geomaterials, exemplified by ground collapse due to underground pipeline leakage, is a complex multi-physics process rooted in dynamic interactions between solid particles and pore fluid. As depicted in Figure 1, pipeline leakage triggers fluid interaction with surrounding sand: the infiltrating fluid reduces soil strength through elevated water content and pore water pressure, while simultaneously transporting particles to form a soil disturbance zone. This fluid–solid coupling ultimately leads to subsurface cavitation and potential ground collapse, accompanied by a depression in the water table above the leakage site. Traditional single-phase numerical methods, such as continuum-based finite element methods (FEM), fall short in capturing discrete particle-scale behaviors—including particle migration and contact breakage—that govern the initiation and progression of such failures. To address this, this study develops a fluid–soil interaction model to simulate ground collapse induced by underground pipeline leakage in water-rich sand layers.
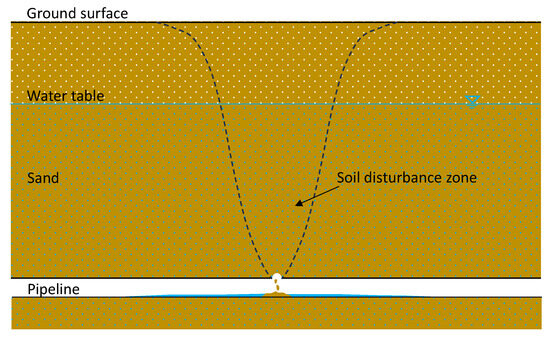
Figure 1.
Schematic illustration of flow-induced failure in geomaterials.
2.1. Governing Equations of Particle Motion
In the proposed model, the DEM is employed to characterize the mechanical behavior of soil particles. The translational and rotational motions of particles adhere to Newton’s second law, which enables the calculation of particle velocities and positions at each computational time step []. In coupled simulations, seepage forces induced by groundwater act on the centroids of particles. The discretized forms of the governing equations are as follows:
where mi and Ii are mass and moment of inertia of particle i; ui and ωi are translational and rotational velocity vectors of the soil particle, respectively; FC,ij is the contact force between particles i and j; Ffluid,i is the seepage force from the groundwater; g denotes the gravitational acceleration; and Tij represents the torques acting on the particle i. For a spherical particle of radius Ri, Tij is given by
where FCt,ij is the tangential component of the contact force FC,ij.
2.2. Governing Equations of Fluid Flow
The fluid in the model is simulated using the CFD method. Equal-volume fluid meshes are generated via Gmsh, with each mesh containing a series of PFC particles. The fluid solver (FiPy) is employed to solve the flow equations within these meshes and compute parameters such as flow velocity and pressure gradient. The governing equations adopt the incompressible Navier–Stokes (N–S) equations:
where n is porosity of the host fluid cell, v is the velocity vector of fluid, p denotes the mean pressure in fluid cells, ρf is the density of fluid, μ is hydrodynamic viscosity, and fint is the interaction force from the soil particles in fluid cell.
For the pressure gradient force, in the case of low Reynolds number flow through porous media, Darcy’s law is adopted with this model:
where μ is dynamic viscosity of the fluid and K is permeability coefficient. Considering the influence of particle motion on fluid flow, permeability coefficient K is determined via the Kozeny–Carman [] relation as follows:
where r is the radius of the PFC particle.
2.3. Fluid–Solid Coupling Model
Soil particles below the groundwater level are subjected to seepage force (Ffluid) from the fluid phase, including hydrostatic and hydrodynamic forces. Hydrostatic force refers to the buoyancy effect (fb) exerted on particles stationary in the fluid, while hydrodynamic force mainly consists of drag force (fd) and pressure gradient force (fg):
The buoyancy force (fb) is defined as:
The pressure gradient force (fg) is defined as:
Di Felice [] demonstrated that the fluid resistance experienced by particles is influenced by the concentration of surrounding particles, which is a function of porosity. In the coarse-mesh method, based on the conditions of the fluid element containing the particle, the resistance exerted by the fluid on each particle is individually defined and characterized. The drag force fd is defined as:
where f0 is the drag force on a single particle, which can be determined by:
where Cd is the drag coefficient defined as:
Rep is the particle Reynolds number defined as:
The χ in Equation (12) is an empirical factor accounting for local porosity effects defined as:
3. Numerical Implementation
Current implementations of fluid–solid coupling in PFC predominantly utilize the built-in CFD module. This approach simplifies model setup and enhances computational efficiency. However, this method solely considers fluid effects on particles while failing to account for reciprocal particle influences on the fluid phase, thus constituting a one-way coupling scheme.
This study implements bidirectional fluid–solid coupling within PFC5.0 through integration of Python2.7’s FiPy library. The FiPy solver handles CFD computations while the PFC module executes DEM simulations. The CFD–DEM interaction module was developed using FISH and Python scripting [].
Figure 2 illustrates the CFD–DEM coupling procedure. First, solid particle models are established using the DEM module, while fluid meshes and parameters are configured via the CFD module. Subsequently, the stratigraphic model is discretized by Gmsh into computational grids with predefined boundary conditions for solving hydrodynamic equations. The interaction module then retrieves fluid cell data to solve motion equations, calculating cell porosity and average volume forces. These parameters are transferred to the CFD module to solve the Navier–Stokes equations. Finally, the computed flow field from CFD is imported into the DEM model, where fluid–particle interaction forces act as coupling linkages to achieve bidirectional fluid–solid coupling, thus completing the simulation of seepage-induced erosion processes.
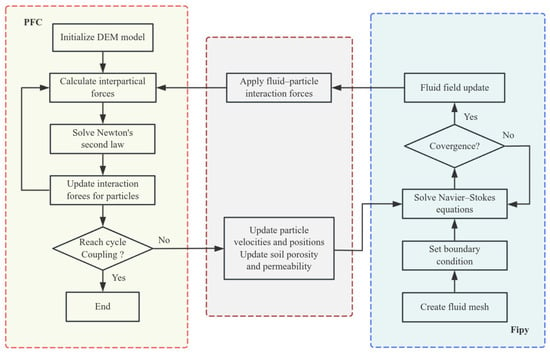
Figure 2.
CFD–DEM coupling flow chart.
4. Model Validation
4.1. Free Settling of a Single Particle in Static Water
To verify the accuracy of the CFD–DEM coupled model, the free settling of a single particle in a fluid was simulated in this section. When a spherical particle settles in still water, it is subject to the combined effects of gravity, buoyancy, and fluid resistance. Eventually, the particle reaches a state of force equilibrium and attains a stable descending velocity [], whose final value satisfies the following equation:
where ρs is solid particle density.
In this case, particles with radii of 1 mm, 1.5 mm, and 2 mm were statically positioned at the top of the fluid domain. Under gravitational acceleration, these particles, with a specified density, settle freely in static water with a viscosity coefficient of 1.003 × 10⁻³ Pa·s. The particle density and fluid density were set to 2640 kg/m3 and 1000 kg/m3, respectively. As shown in Figure 3, the numerically obtained terminal velocities are 0.224 m/s, 0.285 m/s, and 0.336 m/s, while the theoretical values calculated via Equation (17) are 0.224 m/s, 0.285 m/s, and 0.337 m/s. The close agreement between the simulated and theoretical results demonstrates strong consistency in particle settling velocities derived from the CFD–DEM coupling framework. This validates the model’s capability to accurately capture particle-fluid dynamics and confirms methodological reliability.
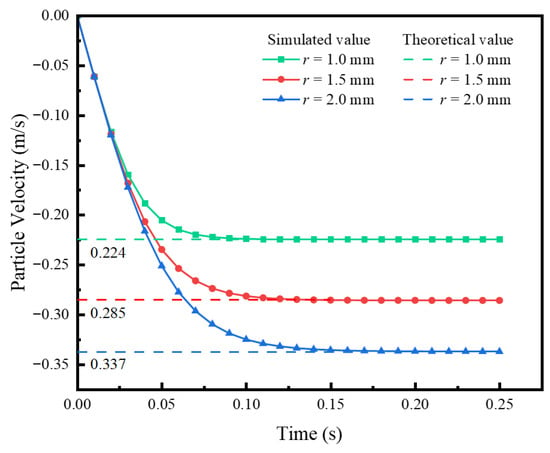
Figure 3.
Free settling velocity of a single particle.
4.2. Upward Seepage Flow Through a Single Column of Particles
Another benchmark case is the upward seepage flow through a single column of particles. Suzuki et al. [] proposed a methodology for calculating seepage forces on particles during diffusion processes using an upward seepage flow model. As illustrated in Figure 4a, the present study employs a vertical column model comprising 100 densely packed spherical particles (radius = 0.5 mm) confined within a 1 mm-wide longitudinal space. Notably, the model scale is consistent with that in the literature [] to ensure direct comparability between the simulation results of this study and the theoretical data in the reference. Initial settlement displacement is determined under non-seepage conditions, followed by upward seepage flow application at the base with velocity 0.005 m/s. Displacement of the topmost particle is recorded throughout the process and compared against theoretical predictions. The initial settlement calculation formula adopted in this work is expressed as follows:
where δ is the initial settlement, d is the particle diameter, kn is particle stiffness, and N is the number of particles.
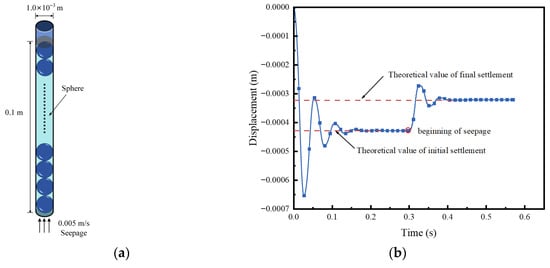
Figure 4.
Upward seepage through monolayer spheres. (a) Model of single column of particles (b) Displacement history of the top particle.
According to Equation (18), the theoretical settlement value is determined to be −0.4278 mm. After imposing a seepage velocity of 0.005 m/s, the theoretical displacement of the top spherical particle is calculated as follows:
where u* is initial seepage velocity, Cv is the consolidation coefficient, Hp is the position of soil particles relative to the bottom of the model, Tv is a time-dependent parameter, k is permeability coefficient, and mv is the coefficient of volume compressibility.
Figure 4b compares the simulated and theoretical displacement values of the top particle. Before the initiation of upward seepage at the base, the particles are subjected solely to gravitational and buoyant forces, resulting in an initial settlement of −0.4278 mm. After the injection of upward seepage at 0.005 m/s at t = 0.3 s, the simulated final settlement reaches −0.321 mm. The discrepancy between the simulated and theoretical values is less than 5%, confirming that the proposed methodology enables effective and precise fluid–solid coupling computations.
5. Ground Collapse Simulation Results
This study establishes a two-dimensional CFD–DEM coupled model to simulate the ground collapse process induced by underground pipeline leakage, as shown in Figure 5. The pipeline featured a diameter of 0.1 m and a burial depth of 0.6 m, with a 0.03 m-diameter defect located at its top. For the pipe leakage simulation, the groundwater level was set at 0.3 m. Notably, the model dimensions, pipeline burial depth, and groundwater level adopted in this study are consistent with the model test settings documented in the referenced literature (Dai et al. []; Ren et al. []). The computational domain of the model measures 0.8 m × 0.626 m and is discretized into a series of triangular meshes, as illustrated in Figure 5b.
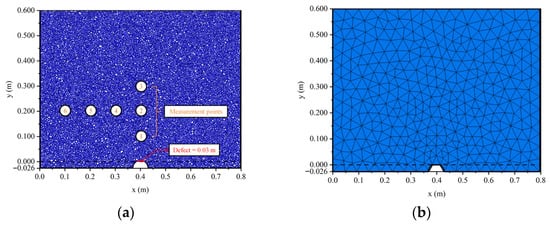
Figure 5.
Numerical model of the ground collapse induced by underground pipeline leakage. (a) DEM model of soil assembly (b) Meshed computational model.
Given the limitations of current computing capabilities, soil particle size can be appropriately increased during the modeling process. Yang et al. [] demonstrated that when the W/Rmax ratio (where W is the model width and Rmax is the maximum particle radius in the discrete element model) exceeds 80, the influence of particle size on the macro-mechanical properties of the material becomes negligible. In this study, to maximize the number of particles generated, the minimum particle radius was set to 0.002 m and the maximum radius to 0.003 m, resulting in a W/Rmax value of 266. The mesoscopic parameters employed in this study are tabulated in Table 1. Specifically, in the PFC simulation of sand, normal stiffness dictates the resistance of sand particles to perpendicular deformation under normal forces; shear stiffness regulates the resistance of sand particles to shear deformation when a shear force is exerted; the friction coefficient mirrors the frictional interaction between sand particles and impacts the force required for particles to slide past one another; and the damping coefficient accounts for energy dissipation within the sand system during dynamic loading, thereby influencing the rate at which vibrations diminish. The values of these parameters, which were chosen with reference to the prior literature [], are provided in the table.

Table 1.
Mesoscopic parameters of PFC2D model.
Figure 6 illustrates the evolutionary process of soil loss across distinct stages. During the initial leakage phase, soil disturbance remained localized in the vicinity of the defect. As soil loss persisted, the disturbed zone expanded both laterally and vertically, eventually propagating to the ground surface and forming a subsidence trough. Observations reveal that at 5 s, a cavity emerges within the soil layer directly above the pipeline defect, with an incipient soil arch forming overhead. By 10 s, the disturbed zone had reached the ground surface, initiating gradual surface subsidence. Progressive soil loss led to an expansion of the disturbance span, accompanied by incremental increases in surface settlement, with the maximum settlement occurring directly above the pipeline. At 20 s, the surface settlement trough extended approximately 0.4 m, with a maximum subsidence of 0.15 m. At this stage, significant ground collapse had developed, exhibiting a funnel-shaped depression. By 30 s, the bulk settlement reached 0.07 m, while the maximum surface subsidence increased to approximately 0.225 m. The simulated morphology of the cavity, soil disturbed zone, and funnel-shaped collapse is consistent with the experimental observations reported by Ren et al. [], as depicted in Figure 7. This demonstrates that the CFD–DEM coupling model presented in this study is well suited for simulating ground collapse induced by underground pipeline leakage.
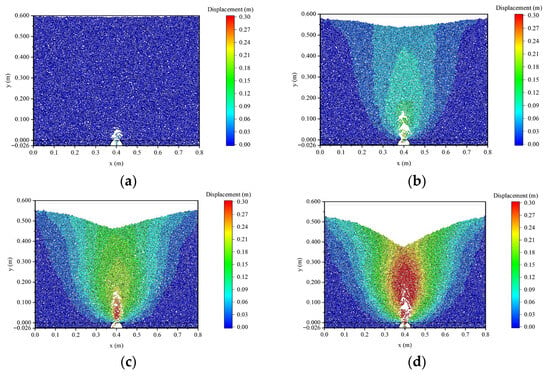
Figure 6.
Process of soil particle loss under seepage force. (a) t = 5 s (b) t = 10 s (c) t = 20 s (d) t = 30 s.
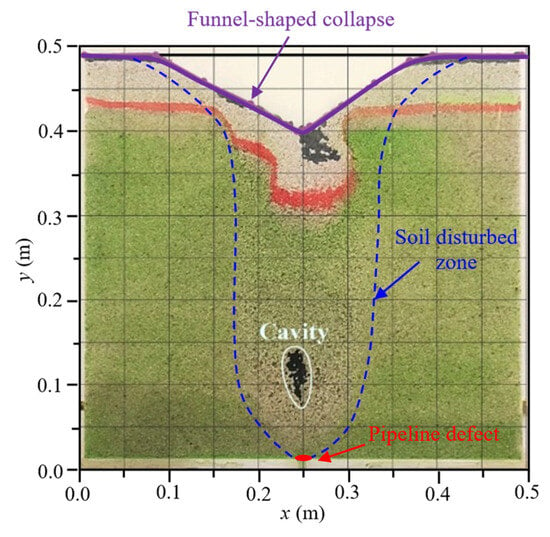
Figure 7.
Results of the ground collapse model test [].
6. Discussion and Analysis
6.1. Settlement Process of the Ground Surface
Groundwater infiltration caused by underground pipeline damage leads to the loss of soil particles, which is prone to surface settlement. Figure 8 depicts the characteristic temporal evolution of ground surface settlement simulated by the CFD–DEM coupling model. The curves at each moment are funnel-shaped, with the maximum settlement directly above the defect and a gradual decrease toward both sides, indicating that the seepage effect is most obvious above the defect. As time progresses, the soil deformation continues to accumulate and the disturbed area gradually expands, which reflects the dynamic settlement process of the soil under the action of continuous seepage.
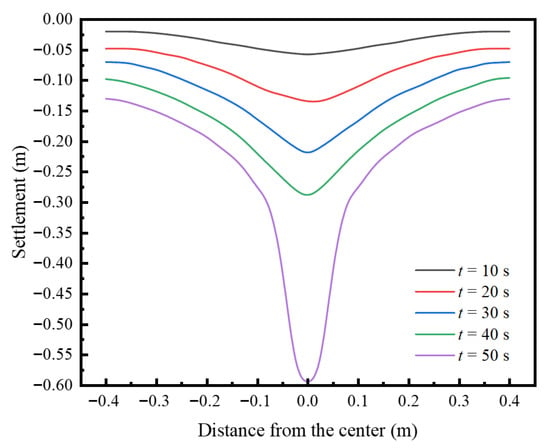
Figure 8.
Temporal evolution of the ground surface settlement.
Figure 9 illustrates the settlement process at the ground surface directly above the defect under different groundwater levels. In the initial stage, the settlement rate is relatively slow. Despite the presence of cavities in the soil adjacent to the defect, the soil overlying these cavities still retains a certain degree of strength, thus slowing the development of surface settlement. As the soil disturbance zone expands continuously, the settlement rate gradually accelerates. Once the disturbance zone reaches the ground surface, the settlement rate surges rapidly, exhibiting a phenomenon of instantaneous collapse. Under identical conditions, a higher groundwater level leads to a more pronounced seepage effect and a more rapid ground settlement.
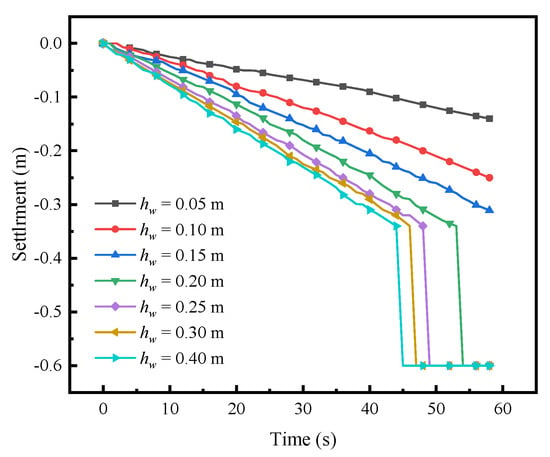
Figure 9.
Settlement process of ground surface directly above the defect.
The numerical results indicate that subsurface seepage significantly accelerates erosion within sand layers. Figure 10 presents a comparison of numerically simulated collapse depths at t = 50 s under different initial groundwater levels. It reveals that higher initial water levels are associated with substantially greater pit depths. This phenomenon is primarily ascribed to elevated water levels saturating more extensive overburden zones; saturated sand exhibits diminished shear strength and enhanced vulnerability to seepage-induced erosion. As illustrated in Figure 11, intensified seepage forces under high water level lead to a marked increase in the mass migration of soil particles per unit of time, thereby accelerating the progression of pit development. Collectively, rising groundwater levels not only triggers earlier collapse initiation but also amplifies the ultimate magnitude of subsidence.
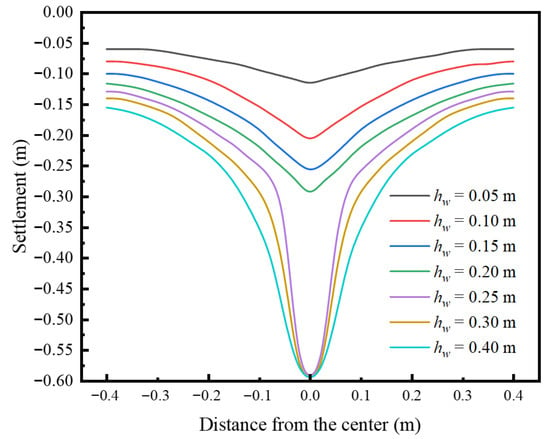
Figure 10.
Collapse depths under different water levels.
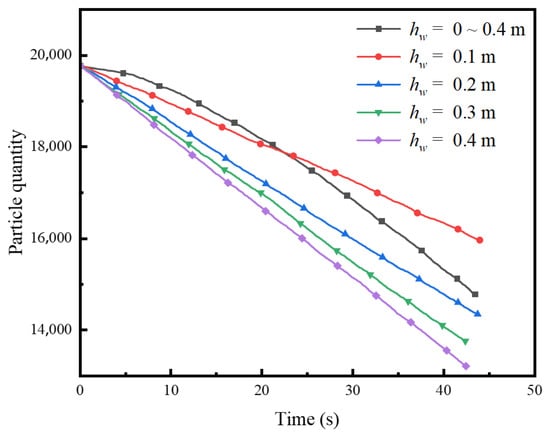
Figure 11.
Water level effects on particle loss count.
6.2. Soil Particle Velocity Under Seepage
In the presented CFD–DEM model, the movement velocity of each particle can be tracked. Comparative simulations under varying initial groundwater levels reveal that elevated water levels enhance seepage forces, thereby increasing the migration velocity of soil particles. Figure 12 quantitatively compares the particle velocity distributions and evolution under different water levels. At the initial stage (t ≤ 5 s), seepage-disturbed zones expand markedly as the water level rises. Over time, the amplified seepage forces gradually mobilize a larger volume of soil into high-velocity migration states. Sustained hydraulic loading on the soil skeleton induces directional displacement of extensive soil masses, ultimately accelerating surface settlement.
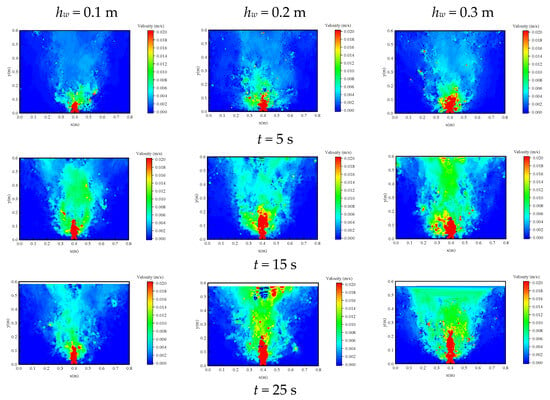
Figure 12.
Velocity contour of soil particles under different groundwater levels.
Figure 13 compares the migration velocities of the sand directly above the pipeline defect under different initial groundwater levels. In the early stage (t ≤ 5 s), particle migration is concentrated in the area near the defect; while in the area more than 0.1 m above the defect, the displacement rate is almost zero. As coupled seepage–erosion progresses, the disturbed zone expands vertically. By t = 15 s, the migration velocities of near-surface particles have increased by a factor of 2.8–4.5 compared to their initial values, indicating a systematic restructuring of seepage paths. At this stage, the soil particle velocity field exhibits a characteristic dual-zone mechanical response: in the below zone, the velocity field intensifies due to stress release; in the above zone, the soil layer remains relatively stable, with a low particle velocity.
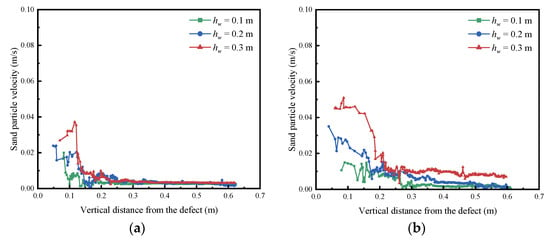
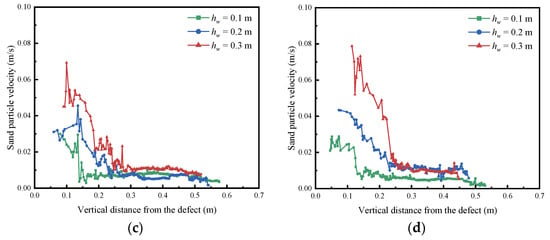
Figure 13.
Sand particle velocities under varying groundwater levels. (a) t = 1 s (b) t = 5 s (c) t = 15 s (d) t = 25 s.
6.3. Stress Distribution and Evolution
Through the DEM simulation, the direct interaction forces between soil particles can be analyzed, thereby enabling the analysis of the distribution and evolution process of stress in the soil layers, as shown in Figure 14. The color mapping is governed by the second deviatoric stress invariant I2, with cross symbols denoting the orientation of principal stresses (longer arms indicate the direction of the major principal stress) and their relative magnitudes (cross-arm length is proportional to the trajectories of the stress tensor) [].
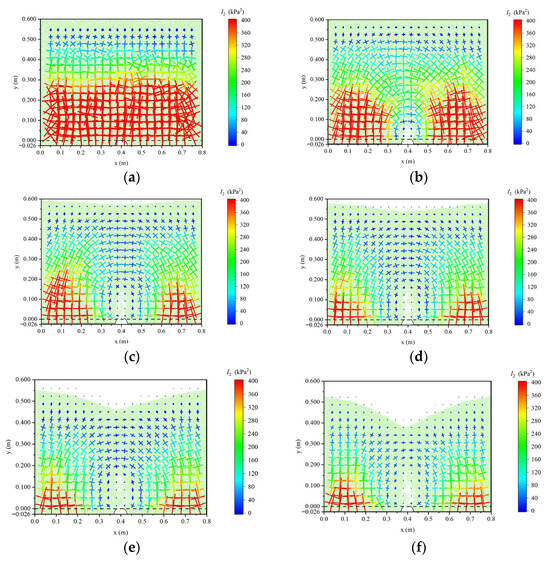
Figure 14.
Particle contact force evolution during soil loss. (a) t = 0 s (b) t = 1 s(c) t = 5 s (d) t = 10 s (e) t = 20 s (f) t = 30 s.
Upon initial pipe leakage, interparticle contact forces remain stable, with soil particle loss concentrated near the leakage point. As soil erosion progresses, a cavity forms above the defect, triggering redistribution of contact force. The soil stress near the cavity is significantly reduced. An obvious stress deflection phenomenon is observed: the stress trajectories near the cavity are nearly perpendicular, indicating that the major principal stress of the soil deflects horizontally. This implies that a stress arch is formed above the cavity. At the arch crown, the principal stresses undergo a 90° rotation: the major principal stress reorients horizontally, while the minor principal stress aligns vertically. As particle loss intensifies, the stress arch fractures under the weight of the overburden, accelerating particle loss and inducing upward propagation of the soil disturbed zone. Ultimately, ground collapse occurs when the disturbed soil zone reaches the surface. The evolution of particle contact forces during the erosion process is consistent with the numerical results of the FEM–DEM coupled model proposed by Long and Tan []. Analysis of stress distribution and evolution shows that with the loss of soil particles, the stress in the soil layer is redistributed, and the direction of the principal stress deflects, forming a stress arch above the pipeline defect to support the gravity of the overlying soil layer.
To investigate the stress evolution of soil during the erosion process, stress measurement points were arranged in the model as illustrated in Figure 5a. Points 1, 2, and 3 are sequentially distributed directly above the pipeline defect. Their stress histories indicate that soil pressure above the defect decreases rapidly following pipeline leakage. The closer the point is to the defect, the faster the soil pressure declines; as the cavity forms, the pressure approaches zero, as depicted in Figure 15a. Points 2, 4, 5, and 6 are horizontally arranged 0.2 m above the pipeline defect, with Point 2 positioned directly above the defect and Points 4, 5, and 6 distributed sequentially toward the boundary. As shown in the stress histories in Figure 15b, soil at the same depth is subjected to uniform stress initially. After pipeline leakage occurs, soil directly above the defect is the first to be lost, resulting in the most rapid stress reduction at Point 2. The rate and magnitude of stress reduction at Points 4, 5, and 6 decrease sequentially.
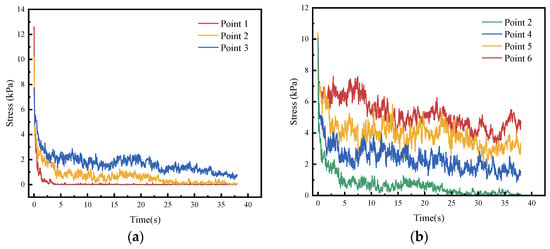
Figure 15.
Stress variations at measurement points. (a) Stress evolution at Points 1, 2, and 3 (b) Stress evolution at Points 2, 4, 5, and 6.
6.4. Dynamic Evolution of Soil Stress Arch
Under the action of groundwater seepage, soil particles are continuously eroded into the pipe, and the soil near the pipeline defect has been strongly disturbed. As soil particles are lost, a cavity rapidly forms in the soil layer above the defect. The stress in the soil near the cavity is redistributed, with the direction of its principal stress changing from the previous vertical direction to the horizontal direction, thus forming a stress arch as shown in Figure 16. The simulation results obtained in this present study are consistent with the Platts theory [].
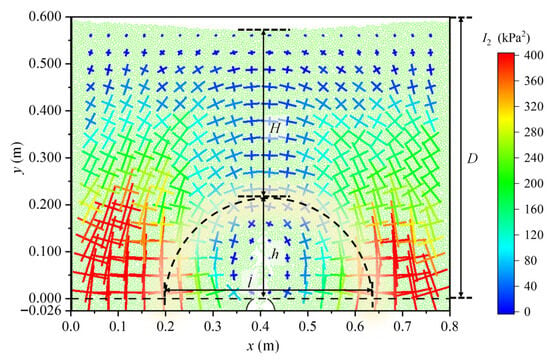
Figure 16.
Theoretical minimum soil arch configuration.
Liu et al. [] indicated that to form a stable soil arch, the minimum arch height hmin corresponding to a specific arch span (l) and overburden thickness (H) can be calculated as:
where ϕ is effective angle of internal friction.
The simulation results from this present study show that, in this numerical case, the stress arch appears at about 5 s after the start of leakage, and the minimum arch height is approximately 0.20 m. Under the action of groundwater seepage, the soil beneath the stress arch continues to be lost, and the disturbed area gradually expands, leading to the collapse of the stress arch. The stress in the overlying soil is then redistributed again, forming a new stress arch with larger height. Figure 17 shows the soil arch heights form at different times. Over time, as soil particles continue to be lost, the soil disturbance zone gradually expands toward the ground surface, and the height of the stress arch increases slowly. Therefore, the process of ground collapse can be regarded as a cyclic process in which the soil stress arch forms, collapses, and re-forms. In this process, as the soil cavity above the defect expands, the height of the stress arch h increases.
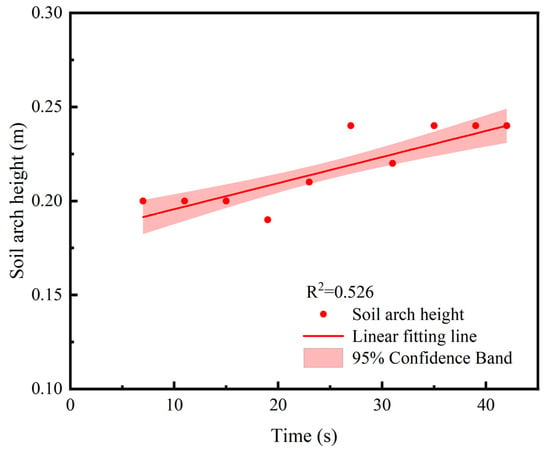
Figure 17.
Developmental stages of soil arching.
6.4.1. Water Level Effect on Soil Arch
According to Terzaghi’s effective stress principle [], rising water level increases pore water pressure, which reduces effective stress and thereby diminishes soil shear strength. Meanwhile, as the groundwater level rises, the seepage effect at the pipeline defect becomes more pronounced, thus increasing the rate of soil loss. In this section, the authors defined the height difference between the groundwater level and the location of the pipeline defect as hw. As illustrated in Figure 18, when the hw rises from 0 to 0.2 m, the soil arch height increases from 0.10 m to 0.21 m. However, further elevation of hw leads to the stabilization of arch height with no significant growth. This indicates a threshold effect of the water level on soil arching: below this threshold, fluctuations exert a pronounced impact on the bearing capacity of the arch, whereas beyond it, further increases in the water level have a diminishing influence on effective stresses.
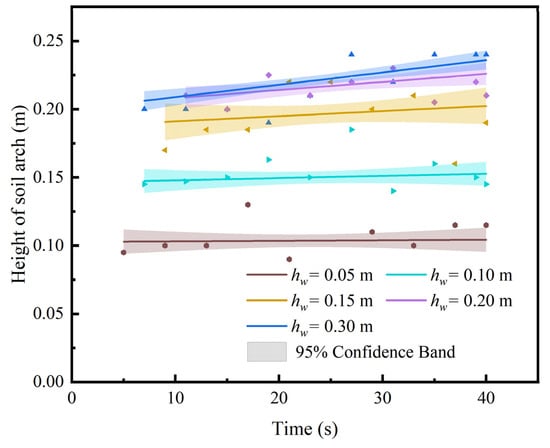
Figure 18.
Soil arch height evolution under variable water levels.
Figure 19 reveals a marked non-monotonic variation in the time required for stable soil arch formation with increasing water levels. Under low water levels, the height of the soil arch increases as the water level rises. Therefore, the time required to form the soil arch becomes longer. When the water level exceeds 0.2 m, the minimum soil arch height ceases to increase significantly. Elevated water levels intensify hydrodynamic pressure, accelerating particle loss, resulting in a shorter time required for the soil arch formation. Under high-water-level conditions (hw ≥ 0.4 m), the soil loss rate tends to stabilize, and thus the time required for soil arch formation also stabilizes. Ibrahim and Meguid [] similarly observed that beyond a critical limit, elevated groundwater levels do not significantly affect erosion rates.
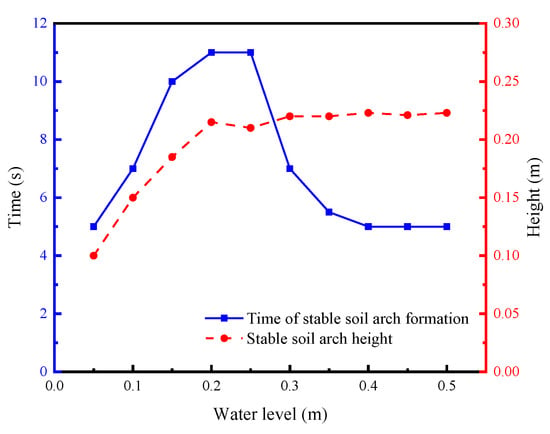
Figure 19.
Time and height of stable soil arch formation under varying water levels.
The results of the accident investigation show that ground collapse frequently coincides with rainstorms []. Consequently, a concurrent simulation of water level rise was implemented in this study. Using Python scripting in PFC, the entire 2D domain was designated as an inflow boundary to simulate water level elevation at a rate of 0.01 m/s.
Figure 20 shows the time history of the height of the soil stress arch under the condition of a uniformly rising groundwater level, which is significantly different from the height of the soil arch under a stable water level as shown in Figure 19. The increase in groundwater level causes the height of the soil arch to gradually increase. As the rate of soil loss increases, the height of the newly formed soil arch gradually increases until it exceeds 0.2 m and then tends to stabilize.
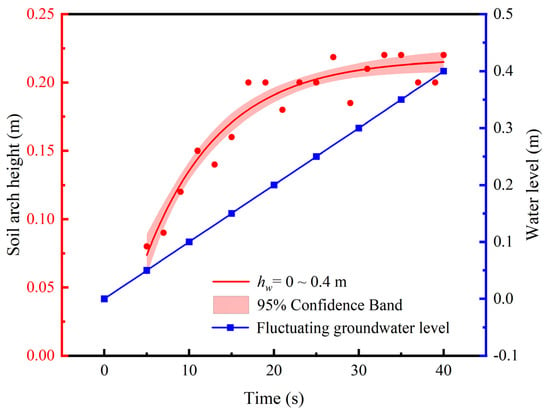
Figure 20.
Time history of soil arch height.
6.4.2. Effect of Pipeline Burial Depth on Soil Arch
For cohesionless soils, Equation (21) indicates that the relationship between the minimum arch height (hmin) and the overburden thickness (H) is a monotonically decreasing function. For fixed values of the effective angle of internal friction (ϕ) and arch span (l), the smaller the overburden thickness, the greater the minimum arch height. Figure 21 demonstrates that the time required for stable soil arch formation decreases with increasing overburden thickness. Under conditions of high overburden, the arch morphology tends to flatten, conforming to the principle of minimum potential energy. Flattened arches more efficiently resist vertical loads through enhanced horizontal stress transmission, reducing their dependence on height while accelerating structural reorganization.
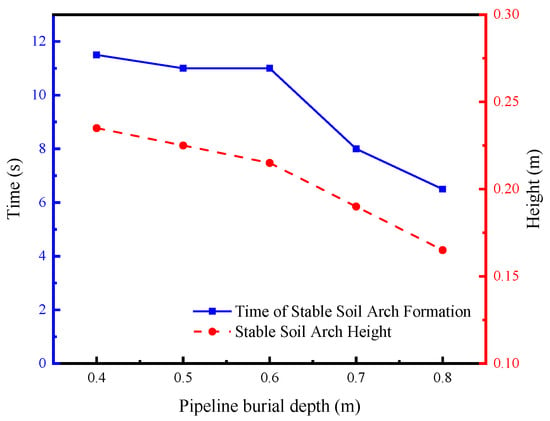
Figure 21.
Time and height of stable soil arch formation under varying overburden thicknesses.
Figure 22 presents soil arch heights under varying thickness of the soil layer overlying the pipeline (D). The figure demonstrates that the stable arch height decreases as the overburden thickness increases. This phenomenon is consistent with the theoretical derivation by Liu et al. [] that the stable arch height is a decreasing function of the overburden thickness. Greater overburden thickness significantly augments the overlying pressure, thereby enhancing the confining stress within the soil mass. This process indirectly increases the apparent angle of internal friction and soil density. In densified sand, an increased number of particles contact points results in a more stable force chain network, reducing localized stress concentrations and ultimately lowering the stable arch height.
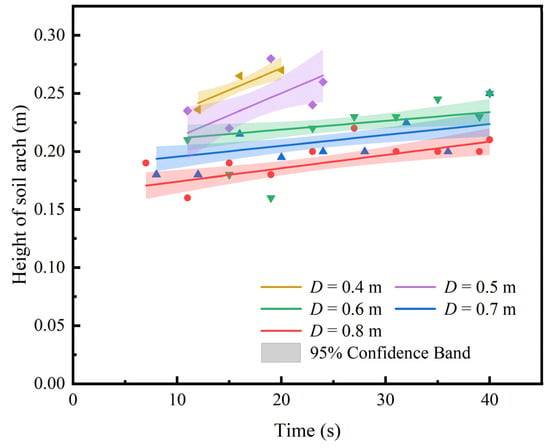
Figure 22.
Soil arch height evolution under variable overburden thicknesses.
7. Conclusions
This study systematically investigates ground collapse mechanisms induced by pipe leakage under variable water level conditions using a bidirectional CFD–DEM fluid–solid coupling approach. It reveals the dynamic evolution of soil arching during seepage erosion and its spatiotemporal coupling with surface subsidence. The key conclusions are:
- (1)
- Underground pipeline damage causes groundwater seepage. Under the action of seepage pressure, soil particles are eroded and lost, forming an underground cavity above the pipeline defect. As soil is lost, the disturbed zone develops toward the ground surface, causing ground settlement. In cohesionless soil layers, soil loss caused by pipeline leakage eventually forms a funnel-shaped sinkhole on the ground surface. A rise in the groundwater level reduces soil strength and, to a certain extent, increases seepage pressure, thereby accelerating soil loss and increasing the rate of ground settlement.
- (2)
- When disturbed, the soil stress undergoes redistribution: the direction of the major principal stress in the soil above the cavity shifts from vertical to horizontal, forming a stress arch that bears the weight of the overlying soil layer. Under the effect of groundwater seepage, the soil beneath this stress arch continues to be eroded and lost, causing the disturbed zone to expand gradually and eventually leading to the collapse of the stress arch. Subsequently, the stress in the overlying soil redistributes once more, giving rise to a new stress arch with a greater height. Thus, the process of ground collapse can be characterized as a cyclic sequence involving the formation, collapse, and re-formation of soil stress arches.
- (3)
- Overburden thickness exerts a significant effect on collapse mechanisms. Thick overburden enhances soil densification through increased confining pressure, promoting flattened arch formation that redistributes vertical loads. Although a thicker overlying soil layer can delay the occurrence of ground collapse, it will expand the collapse range to a certain extent. Conversely, insufficient overburden thickness significantly intensifies local stress concentrations and elevates abrupt collapse risk.
To summarize, ground collapse induced by pipeline leakage is an engineering issue affected by the coupling of multiple factors. The present study shows that variations in pipeline burial depth lead to differences in the impact effects of adjacent pipeline leakage, and this regularity provides a key basis for the monitoring, early warning, and prevention of ground collapse. When damage is detected at the top of a pipeline, great attention should be paid to the soil loss dynamics on the upper side of the pipeline, and targeted mitigation measures should be taken promptly. In addition, working conditions such as heavy rainfall and high water levels significantly increase the risk of ground collapse, which should be regarded as key scenarios for collapse prevention and control.
Author Contributions
Conceptualization, Z.D.; methodology, L.Z.; software, L.Z.; validation, L.Z.; investigation, L.Z.; data curation, Z.D. and L.Z.; writing—original draft preparation, Z.D. and L.Z.; writing—review and editing, Z.D.; supervision, Z.D.; funding acquisition, Z.D. All authors have read and agreed to the published version of the manuscript.
Funding
This research was funded by the National Natural Science Foundation of China, grant number 42472332.
Data Availability Statement
Data will be made available on request.
Conflicts of Interest
The authors declare no conflicts of interest.
References
- Wang, X.W.; Xu, Y.S. Investigation on the phenomena and influence factors of urban ground collapse in China. Nat. Hazards 2022, 113, 1–33. [Google Scholar] [CrossRef]
- Phien-wej, N.; Giao, P.H.; Nutalaya, P. Land subsidence in Bangkok, Thailand. Eng. Geol. 2006, 82, 187–201. [Google Scholar] [CrossRef]
- Gutiérrez, F.; Mozafari, M.; Carbonel, D.; Gómez, R.; Raeisi, E. Leakage problems in dams built on evaporites. The case of La Loteta Dam (NE Spain), a reservoir in a large karstic depression generated by interstratal salt dissolution. Eng. Geol. 2015, 185, 139–154. [Google Scholar] [CrossRef]
- Cheng, X.S.; Zheng, G.; Diao, Y.; Huang, T.M.; Deng, C.H.; Lei, Y.W.; Zhou, H.Z. Study of the progressive collapse mechanism of excavations retained by cantilever contiguous piles. Eng. Fail. Anal. 2017, 71, 72–89. [Google Scholar] [CrossRef]
- Karoui, T.; Jeong, S.Y.; Jeong, Y.H.; Kim, D.S. Experimental study of ground subsidence mechanism caused by sewer pipe cracks. Appl. Sci. 2018, 8, 679. [Google Scholar] [CrossRef]
- Scotto di Santolo, A.; Forte, G.; Santo, A. Analysis of sinkhole triggering mechanisms in the hinterland of Naples (southern Italy). Eng. Geol. 2018, 237, 42–52. [Google Scholar] [CrossRef]
- Lago, A.L.; Borges, W.R.; Barros, J.S.; Amaral, E.D. GPR application for the characterization of sinkholes in Teresina, Brazil. Environ. Earth Sci. 2022, 81, 132. [Google Scholar] [CrossRef]
- Dai, Z.L.; Peng, L.H.; Qin, S.W. Experimental and numerical investigation on the mechanism of ground collapse induced by underground drainage pipe leakage. Environ. Earth Sci. 2024, 83, 32. [Google Scholar] [CrossRef]
- Zheng, G.; Dai, X.; Diao, Y.; Zeng, C.F. Experimental and simplified model study of the development of ground settlement under hazards induced by loss of groundwater and sand. Nat. Hazards 2016, 82, 1869–1893. [Google Scholar] [CrossRef]
- Kuliczkowska, E. The interaction between road traffic safety and the condition of sewers laid under roads. Transp. Res. Part D Transp. Environ. 2016, 48, 203–213. [Google Scholar] [CrossRef]
- Gan, L.; Liu, Y.; Xu, T.; Xu, L.; Ma, H.Y.; Xu, W.C. Experimental investigation of the seepage characteristics of a single fracture in limestone with different roughness and seepage fluids. J. Hydrol. 2023, 622, 129699. [Google Scholar] [CrossRef]
- Wang, L.Y.; Chen, W.Z.; Sui, Q. Study of hydro-mechanical behaviours of rough rock fracture with shear dilatancy and asperities using shear-flow flow model. J. Rock Mech. Geotech. Eng. 2024, 16, 4004–4016. [Google Scholar] [CrossRef]
- Guo, S.; Shao, Y.; Zhang, T.Q.; Zhu, D.Z.; Zhang, Y.P. Physical modeling on sand erosion around defective sewer pipes under the influence of groundwater. J. Hydraul. Eng. 2013, 139, 1247–1257. [Google Scholar] [CrossRef]
- Sato, M.; Kuwano, R. Influence of location of subsurface structures on development of underground cavities induced by internal erosion. Soils Found. 2015, 55, 829–840. [Google Scholar] [CrossRef]
- Ren, J.L.; Liu, Y.; Yu, P.Q.; Zhang, Y.L.; Li, D.S. The influence of fines content on ground collapse due to internal erosion of sand-fines mixtures around defective pipes. Eng. Fail. Anal. 2024, 165, 108810. [Google Scholar] [CrossRef]
- Guo, J.X.; Zhang, Y.J.; Cheng, Y.X.; Zhang, X.; Shi, H.X.; Zheng, J.Q.; Ma, Y.J. Study on urban ground collapse induced by defective pipelines based on physical model experiments and numerical simulation. Sci. Rep. 2025, 15, 6085. [Google Scholar] [CrossRef] [PubMed]
- Wu, Y.X.; Shen, S.L.; Lyu, H.M.; Zhou, A. Analyses of leakage effect of waterproof curtain during excavation dewatering. J. Hydrol. 2020, 583, 124582. [Google Scholar] [CrossRef]
- Yuan, X.Y.; Yan, Y.D.; Li, X.Y.; Wang, T.; Ji, J. Discrete element simulation of ground collapse induced by buried sewage pipeline breakage and soil leakage. Eng. Fail. Anal. 2025, 167, 108910. [Google Scholar] [CrossRef]
- Cui, X.; Li, J.; Chan, A.; Chapman, D. Coupled DEM-LBM simulation of internal fluidisation induced by a leaking pipe. Powder Technol. 2014, 254, 299–306. [Google Scholar] [CrossRef]
- Long, Y.Y.; Tan, Y. Soil arching due to leaking of tunnel buried in water-rich sand. Tunn. Undergr. Space Technol. 2020, 95, 103158. [Google Scholar] [CrossRef]
- Qi, G.; Wang, Z.Y.; Chen, Y.; Zhu, C.; Ren, D.Z.; Tian, T.; Yang, F. Analysis of Instability Mechanism and Induced Cause of Urban Pavement in Xining City, China. Adv. Mater. Sci. Eng. 2022, 2022, 3365402. [Google Scholar] [CrossRef]
- Tsuji, Y.; Kawaguchi, T.; Tanaka, T. Discrete particle simulation of two-dimensional fluidized bed. Powder Technol. 1993, 77, 79–87. [Google Scholar] [CrossRef]
- Cui, J.Y.; Liu, F.Y.; Geng, Y.W.; Pu, C.; Miao, M. Numerical simulation of ground subsidence factors resulting from unpressurized pipeline rupture below the water table. Appl. Sci. 2023, 13, 9536. [Google Scholar] [CrossRef]
- Di Felice, R. The voidage function for fluid-particle interaction systems. Int. J. Multiph. Flow 1994, 20, 153–159. [Google Scholar] [CrossRef]
- Chen, F.; Wang, Y.C.; Jiang, W.; Zheng, S.H. Numerical simulation of ground movement induced by water and sand gushing in subway through fault based on DEM-CFD. Comput. Geotech. 2021, 139, 104282. [Google Scholar] [CrossRef]
- Suzuki, K.; Bardet, P.J.; Oda, M.; Iwashita, K.; Tsuji, Y.; Tanaka, T.; Kawaguchi, T. Simulation of upward seepage flow in a single column of spheres using discrete-element method with fluid-particle interaction. J. Geotech. Geoenviron. Eng. 2007, 133, 104–109. [Google Scholar] [CrossRef]
- Yang, B.D.; Jiao, Y.; Lei, S.T. A study on the effects of microparameters on macroproperties for specimens created by bonded particles. Eng. Comput. 2006, 23, 607–631. [Google Scholar] [CrossRef]
- Liu, C.J.; Wang, Y.Z.; Tan, Y.; Cao, Y.C. Failure evolution and mechanism of ground collapse due to exfiltration of shallowly buried water pipeline. Eng. Fail. Anal. 2024, 162, 108390. [Google Scholar] [CrossRef]
- He, M.C.; Wang, Q. Excavation compensation method and key technology for surrounding rock control. Eng. Geol. 2022, 307, 106784. [Google Scholar] [CrossRef]
- Liu, D.Z.; Zhang, J.F.; Li, S.L.; Wang, B.J. Mechanism of soil collapse based on soil arching theory. J. Yangtze River Sci. Res. Inst. 2011, 28, 35. [Google Scholar]
- Terzaghi, K. The shearing resistance of saturated soils and the angle between the planes of shear. Proc. Int. Conf. Soil Mech. Found. Eng. 1936, 1, 54–56. [Google Scholar]
- Ibrahim, A.; Meguid, M.A. CFD-DEM simulation of sand erosion into defective gravity pipes under constant groundwater table. Tunn. Undergr. Space Technol. 2023, 131, 104823. [Google Scholar] [CrossRef]
- He, R.X.; Hao, Y.Z.; Zhou, Z.W. Experimental study on the dynamic properties of undisturbed loess under moistening conditions in Zhengzhou, China. Bull. Eng. Geol. Environ. 2024, 83, 186. [Google Scholar] [CrossRef]
Disclaimer/Publisher’s Note: The statements, opinions and data contained in all publications are solely those of the individual author(s) and contributor(s) and not of MDPI and/or the editor(s). MDPI and/or the editor(s) disclaim responsibility for any injury to people or property resulting from any ideas, methods, instructions or products referred to in the content. |
© 2025 by the authors. Licensee MDPI, Basel, Switzerland. This article is an open access article distributed under the terms and conditions of the Creative Commons Attribution (CC BY) license (https://creativecommons.org/licenses/by/4.0/).